Thermally conductive and electrically insulating epoxy nanocomposites with silica-coated graphene†
Xue
Pu
a,
Hao-Bin
Zhang
a,
Xiaofeng
Li
*a,
Chenxi
Gui
a and
Zhong-Zhen
Yu
*ab
aState Key Laboratory of Organic-Inorganic Composites, Beijing University of Chemical Technology, Beijing 100029, China. E-mail: xfli@mail.buct.edu.cn; yuzz@mail.buct.edu.cn; Fax: +86-10-6442 8582
bBeijing Key Laboratory on Preparation and Processing of Novel Polymer Materials, Beijing University of Chemical Technology, Beijing 100029, China
First published on 14th March 2014
Abstract
Graphene oxide was reduced and functionalized simultaneously by reacting with 3-aminopropyltriethoxysilane (APTES) without the use of conventional reducing agents. Silica was subsequently formed in situ on APTES functionalized graphene (A-graphene) sheets by a sol–gel approach using tetraethyl orthosilicate as the precursor of silica. The covalently bonded APTES on A-graphene enhances the compatibility between A-graphene and silica nanoparticles. The silica-coated A-graphene (S-graphene) sheets were incorporated to improve the thermal conductivity of epoxy. The presence of silica nanoparticles not only enhances the interfacial interaction between S-graphene and the epoxy matrix, but also alleviates the modulus mismatch between the fillers and the matrix and thus benefits the interfacial thermal conductance. The thermal conductivity of the epoxy nanocomposite with 8 wt% S-graphene is improved by 72% in comparison with that of neat epoxy, while the electrically insulating feature of the nanocomposite is retained.
Introduction
With the continuing miniaturization of electronic devices and the increasing power output of electrical equipment, efficient thermal management is imperative for electronic packaging materials.1 Thermally conductive polymer composites have attracted considerable attention due to their good processability and low cost. Many inorganic fillers, such as metal powders,2 carbon fiber,3 graphite4 and ceramic particles,5 have been used to improve the thermal conductivity of polymers. However, the improvement effects are usually not as satisfactory as expected because of the interfacial thermal resistance (Kapitza resistance), which arises from the weak phonon–phonon coupling that leads to a scattering of phonons at the interface between fillers and matrix.6–8 The weak phonon–phonon coupling is mainly attributed to mismatch in modulus between fillers and matrix. Larger mismatch usually induces weaker phonon–phonon coupling and higher thermal resistance.9,10 The interfacial resistance is very serious when nanofillers are used to make up the thermally conductive network due to their high density interface.11 Therefore, adjusting the interface structure of nanocomposites to reduce the modulus mismatch between nanofillers and polymer matrix is important for the improvement of thermal conductivity of polymer nanocomposites.Among the thermally conductive nanofillers, graphene exhibits a superior thermal conductivity (∼5000 W mK−1) and layered structure that benefits the formation of a thermally conductive network.12–14 However, it has to be noted that graphene is also electrically conductive with a high electrical conductivity of ∼6000 S cm−1,15 which would reduce the electrical resistance of polymers and may cause malfunctions of electronic devices. Therefore, it would be interesting to use an electrically insulating coating to reduce the electrical conductivity of graphene sheets, improve the interfacial compatibility and alleviate the modulus mismatch between graphene sheets and polymer matrix. Xie et al. successfully coated carbon nanotubes (CNTs) with in situ formed silica nanoparticles and the coated CNTs were effective in improving the thermal conductivity of epoxy and keeping its high electrical resistance.16 Recently, Ma et al. coated graphene with silica and the resultant sandwiched nanosheets were used to endow epoxy nanocomposites with improved thermal conductivity while retaining the electrically insulating feature of epoxy.17
In the present study, graphene oxide (GO) is simultaneously functionalized and reduced with 3-aminopropyltriethoxysilane (APTES). The APTES functionalized graphene (A-graphene) sheets are covalently coated with silica nanoparticles by a sol–gel approach. The silica coated A-graphene (S-graphene) sheets are then compounded with epoxy to examine their efficiency in improving the thermal conductivity of epoxy and keeping its electrically insulating property.
Experimental
Materials
Natural graphite flakes were supplied by Huadong Graphite Factory (Pingdu, China) with an average diameter of 13 μm. Sodium nitrate (99%) and tetraethyl orthosilicate (TEOS) were bought from Xilong Chemical Industry (China). N,N′-Dicyclohexyl-carbodiimide (DCC, 99%) was obtained from Alfa Aesar (USA). APTES (>98%) was purchased from Tokyo Chemical Industry Co., Ltd. (Japan). Bisphenol-A epoxy monomer (JY257) was received from Changshu Jiafa Chemical Co., Ltd. (China). Methyl hexahydrophthalic anhydride (MeHHPA) was supplied from Jiaxing Dongfang Chemical Factory (China). Trisdimethylaminomethyl phenol (DMP-30), potassium permanganate (99.5%), sulphuric acid (98%), hydrochloric acid (37%), hydrogen peroxide (30%), ammonia (25–28%), dichloromethane (99.5%) and all the other reagents and solvents were purchased from Beijing Chemical Factory (China). All reagents were analytical-grade and used as received.Chemical reduction of GO
Graphite oxide was obtained from natural graphite flakes with a modified Hummers method.18 100 mg graphite oxide was mixed with 100 mL deionized water and exfoliated into GO sheets by ultrasonication with a JY99-2 DN ultrasonicator (Ningbo, China) for 1 h. The suspension was mixed with 80 μL hydrazine solution as a reducing agent. 350 μL ammonia solution was added to adjust the pH value of the suspension to ∼10. After stirred for a few minutes, the suspension was heated at ∼95 °C for 2 h. The chemically reduced GO (RGO) was filtered through polytetrafluoroethylene membrane (0.2 μm), washed with deionized water and methanol for several times, and finally dried at 80 °C for 24 h in a vacuum oven.Preparation of A-graphene sheets
GO (100 mg) was dispersed in APTES (100 mL) by ultrasonication for 1 h and then DCC (50 mg) was added. After the suspension was magnetically stirred at 75 °C for 12 h, the solid product was centrifuged, washed repeatedly with absolute ethanol, and then dried in an oven at 80 °C for 24 h.Coating of A-graphene sheets with silica nanoparticles
Coating of silica nanoparticles onto A-graphene sheets was conducted by in situ hydrolysis of TEOS. In a typical procedure, 50 mg A-graphene was dispersed in 288 mL ethanol–water (5![[thin space (1/6-em)]](https://www.rsc.org/images/entities/char_2009.gif) :
:![[thin space (1/6-em)]](https://www.rsc.org/images/entities/char_2009.gif) 1, v/v) solvents by ultrasonication for 1 h. After 360 μL ammonia solution was added, the suspension was magnetically stirred for 0.5 h. Then, 0.6 mL TEOS was added quickly and the mixture was further stirred for 12 h at room temperature. The solid product (S-graphene) was filtered, washed with ethanol, and dried in an oven at 80 °C for 24 h.
1, v/v) solvents by ultrasonication for 1 h. After 360 μL ammonia solution was added, the suspension was magnetically stirred for 0.5 h. Then, 0.6 mL TEOS was added quickly and the mixture was further stirred for 12 h at room temperature. The solid product (S-graphene) was filtered, washed with ethanol, and dried in an oven at 80 °C for 24 h.
Preparation of epoxy nanocomposites
The S-graphene sheets were dispersed in dichloromethane (dichloromethane/S-graphene, 1 mL/1 mg) by ultrasonication for 1 h. After epoxy monomer (JY-257) was added, the mixture was homogenized using an IKA T18 homogenizer (Germany) for 2 h at ambient temperature, and then magnetically stirred for 3 h at 60 °C, followed by degassing in a vacuum chamber at 60 °C for 12 h to ensure the removal of the dichloromethane solvent. After cooling to ambient temperature, the epoxy/S-graphene slurry was mixed with the curing agent of MeHHPA and the promoter of DMP-30 using an IKA Labortecnik high speed mixer (Germany) at 2000 rpm for 20 min, and then degassed in the vacuum chamber for approximately 30 min. The epoxy/S-graphene mixture was poured into a cylindrical mould (H = 2 mm and D = 70 mm) and cured at 100 °C for 2 h followed by 120 °C for 2 h. For comparison, epoxy/RGO and epoxy/A-graphene nanocomposites were also prepared using the same procedure.Characterization
X-ray diffraction (XRD) measurement was carried out using a Rigaku D/Max 2500 diffractometer with CuKα radiation (λ = 1.54 Å) at a generator voltage of 40 kV and a generator current of 40 mA. Thermogravimetric analysis (TGA) was conducted on a TA Instruments TA Q50 thermal analyzer. GO and A-graphene were characterized with a Thermo VG RSCAKAB 250X high resolution X-ray photoelectron spectroscopy (XPS) and a Nicolet Nexus 670 Fourier transform infrared spectroscopy (FT-IR) and a Renishaw inVia Raman microscopy (Britain). The morphology and microstructure of the nanocomposites were observed with a Hitachi S4700 field emission scanning electron microscopy (SEM) and a JEOL JEM-3010 transmission electron microscopy (TEM). Storage modulus and glass transition temperature were measured with a Rheometric Scientific Model-V dynamic mechanical analyzer (DMA) using a single-cantilever mode from 0 to 200 °C with a heating speed of 5 °C min at 1 Hz. The electrical volume resistance was measured by a Keithley Model 6517 electrometer with an 8009 resistivity test fixture equipped with ring electrodes. Thermal conductivity was obtained using a Mathis TCi thermal conductivity analyzer (Canada) at room temperature.Results and discussion
Functionalization and reduction of GO with APTES
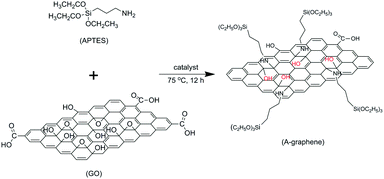
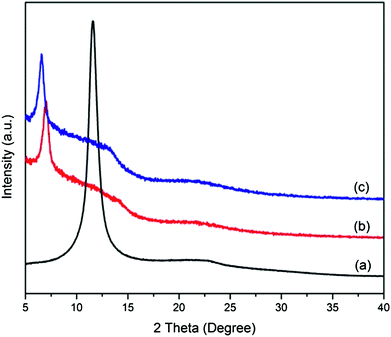
The functionalization and reduction of GO with APTES via the nucleophilic substitution reaction between the epoxide groups of GO and the amine groups of APTES is illustrated in Scheme 1.Fig. 1 shows the XRD spectra of GO and A-graphene prepared with different reaction times. The characteristic diffraction peak of GO is at the 2θ Bragg angle of 11.6°, corresponding to an interlayer distance of 0.76 nm, which is larger than that of pristine graphite (∼0.34 nm) due to the presence of oxygenated functional groups on carbon sheets.19 After reaction with APTES for 6 h, the peak shifts to 7.0° with an interlayer distance of 1.26 nm. By increasing the reaction time to 12 h, the interlayer distance of A-graphene expands to 1.34 nm (6.6°). The enlarged interlayer distance of GO confirms the intercalation of APTES.
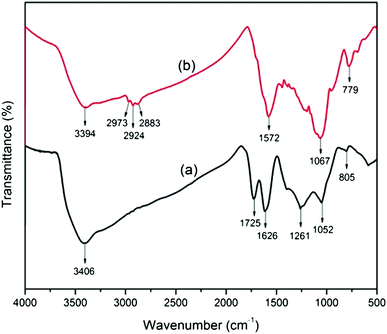
The functionalization of GO with APTES is confirmed by FT-IR results of GO and A-graphene (Fig. 2). Typical peaks of GO appear at 1725 cm−1 (C![[double bond, length as m-dash]](https://www.rsc.org/images/entities/char_e001.gif) O carboxyl stretching vibration), 1626 cm−1 (C
O carboxyl stretching vibration), 1626 cm−1 (C![[double bond, length as m-dash]](https://www.rsc.org/images/entities/char_e001.gif) C in aromatic ring) and 1261 cm−1 (C–OH stretching vibration). The C–O vibration of the epoxide groups in GO appears at 1052 cm−1 and 805 cm−1. The broad peak at 3000–3500 cm−1 could be assigned to the hydroxyl groups. A new broad peak appears at 2800–3000 cm−1 after reacting with APTES, which corresponds to the –CH2 stretching of alkyl chains from the silane moieties of A-graphene. It is worth noting that a new peak at 1572 cm−1 (N–H stretching vibration) appears in the FT-IR spectrum of A-graphene, indicating the formation of –C–NH–C– bands due to the reaction between the epoxide groups and the amine groups. Furthermore, the appearance of the peaks at 1067 cm−1 (Si–O–C/Si–O–Si) and 779 cm−1 (Si–C) provides more evidence for the functionalization of graphene.
C in aromatic ring) and 1261 cm−1 (C–OH stretching vibration). The C–O vibration of the epoxide groups in GO appears at 1052 cm−1 and 805 cm−1. The broad peak at 3000–3500 cm−1 could be assigned to the hydroxyl groups. A new broad peak appears at 2800–3000 cm−1 after reacting with APTES, which corresponds to the –CH2 stretching of alkyl chains from the silane moieties of A-graphene. It is worth noting that a new peak at 1572 cm−1 (N–H stretching vibration) appears in the FT-IR spectrum of A-graphene, indicating the formation of –C–NH–C– bands due to the reaction between the epoxide groups and the amine groups. Furthermore, the appearance of the peaks at 1067 cm−1 (Si–O–C/Si–O–Si) and 779 cm−1 (Si–C) provides more evidence for the functionalization of graphene.
XPS is used to characterize the reduction of GO and its interaction with APTES (Fig. 3). Compared to GO, the survey of A-graphene shows the peaks of Si2p, Si2s and N1s of APTES. The C1s XPS spectrum of GO clearly indicates the oxidation of graphite with 4 peaks corresponding to carbon atoms in different functional groups: C–C (BE, 284.8 eV), C–OH (BE, 285.3 eV), C–O–C (BE, 287 eV) and O–C![[double bond, length as m-dash]](https://www.rsc.org/images/entities/char_e001.gif) O (BE, 288.9 eV). After reacting with APTES, the disappearance of C–O–C peak in the epoxide group and the emergence of a new C–N peak at 286.4 eV confirm the covalent bonding between GO and APTES.20,21
O (BE, 288.9 eV). After reacting with APTES, the disappearance of C–O–C peak in the epoxide group and the emergence of a new C–N peak at 286.4 eV confirm the covalent bonding between GO and APTES.20,21
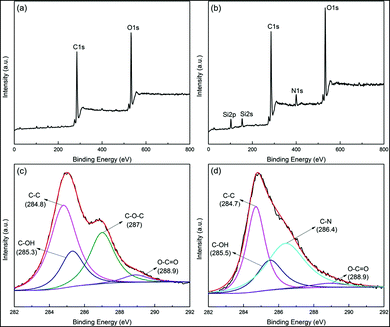 | ||
| Fig. 3 XPS wide scan spectra of (a) GO and (b) A-graphene. XPS C1s spectra of (c) GO and (d) A-graphene. | ||
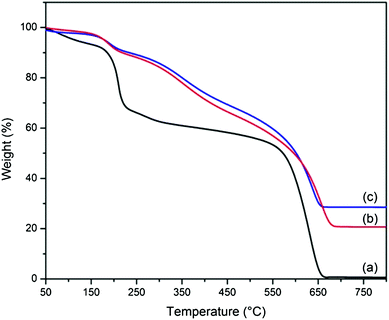
The reduction of GO during its reaction with APTES is also reflected in the TGA results of A-graphene (Fig. 4). It is clear that GO is thermally unstable and exhibits a large mass loss of ∼30 wt% between 200 and 300 °C due to the thermal decomposition of the labile oxygen-containing groups, yielding CO2, CO and vapour. Further removal of more stable oxygen-containing groups above 500 °C results in a final mass loss of 41.6 wt%. However, A-graphene shows a less significant mass loss. The mass losses at 200 °C for A-graphene with the reaction times of 6 and 12 h are only 7.2 and 6.1 wt%, respectively.
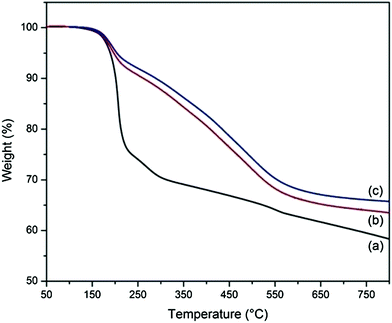 | ||
| Fig. 4 TGA curves of (a) GO and A-graphene with reaction times of (b) 6 h and (c) 12 h under nitrogen atmosphere. | ||
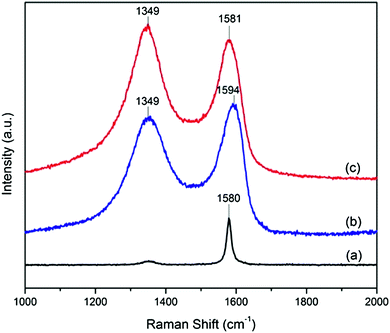
Fig. 5 shows the Raman spectra of natural graphite, GO and A-graphene. It is well recognized that the G band corresponds to the in-plane stretching motion between pairs of sp2 carbon atoms,22 while the D band indicates the occurrence of defects. The G band of natural graphite at 1580 cm−1 is assigned to the in-phase vibration of graphite lattice.23 The Raman spectrum of GO displays a prominent D band at 1349 cm−1, resulting from the decrease in size of the in-plane sp2 domains due to the extensive oxidation. The G band is broadened and shifted to 1594 cm−1, ascribed to the presence of isolated double bonds on GO sheets that resonate at higher frequencies than the G band of graphite.23 After the reaction of GO with APTES, however, the G band shifts back to the position of the G band in graphite, indicating the re-emergence of the sp2-carbon network.23 The evolution of disorder is usually quantified by the intensity ratio of D-band and G-band (ID/IG). A-graphene has an increased ID/IG ratio compared to that of GO, suggesting that new graphitic domains are created with smaller size, but larger amount.20,24
Coating of A-graphene sheets with silica nanoparticles
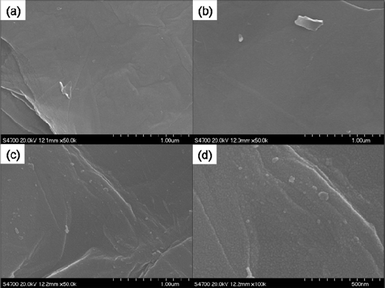
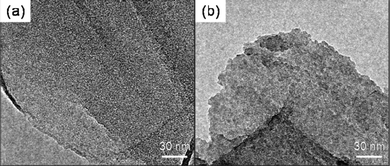
Element mapping images unravel the homogeneous distribution of carbon, silicon, oxygen and nitrogen in A-graphene (Fig. S1†). The coating of silica nanoparticles on A-graphene surface by the hydrolysis of TEOS is confirmed by SEM and TEM observations (Fig. 6 and 7). The surfaces of GO and A-graphene are relatively smooth and compact (Fig. 6a and b). The SEM images of S-graphene exhibit lots of protuberances, confirming the presence of silica nanoparticles with sizes of 10–20 nm (Fig. 6c and d and S2†). The overall structure shown in the TEM image of S-graphene (Fig. 7b and S2†) is consistent with the closely packed arrangement of nanoparticles documented above by SEM. Element mapping images of S-graphene well-reflect the homogeneous distribution of carbon, silicon, oxygen and nitrogen (Fig. S3†).The thermal stabilities of S-graphene, A-graphene and GO are characterized by TGA (Fig. 8). As silica is resistant to high temperature, the powder samples were measured under air atmosphere to burn off all carbon components whilst retaining the silica. GO exhibits a large mass loss (∼30 wt%) of oxygen-containing groups at around 200 °C, and its carbon skeleton decomposes at around 650 °C.25 GO is burned off at 700 °C with less than 1 wt% residue. A-graphene and S-graphene are more thermally stable than that of neat GO. The residue of A-graphene (∼20.8 wt%) is caused by the hydrolysis of silane moieties. The higher residue (∼24.9 wt%) of S-graphene is due to the presence of silica nanoparticles on S-graphene surface.
Electrical resistivities and thermal conductivities of epoxy nanocomposites
Fig. 9 shows the electrical resistivities and thermal conductivities of neat epoxy and its nanocomposites filled with RGO, A-graphene and S-graphene. Since RGO is electrically conductive, its addition clearly decreases the volume electrical resistivity of neat epoxy. It is interesting that both A-graphene and S-graphene do not reduce the electrical resistivity of the epoxy. With 8 wt% of nanofillers, the electrical resistivities of epoxy/A-graphene and epoxy/S-graphene nanocomposites are still as high as 1.3 × 10¹² Ω m and 1.7 × 10¹² Ω m, respectively. These results indicate that the functionalizations of GO with APTES and silica nanoparticles prevent electron tunneling,26,27 and hinder the formation of electrical transport channels, leading to electrically insulating epoxy nanocomposites. Similar result was reported by Teng et al. where the epoxy with high loadings of Al2O3-covered CNTs exhibited negligibly decreased electrical resistivity.28 For epoxy/A-graphene nanocomposites, the insulating silane molecules on the graphene sheets probably play the role of degrading the electrical properties of the nanocomposites.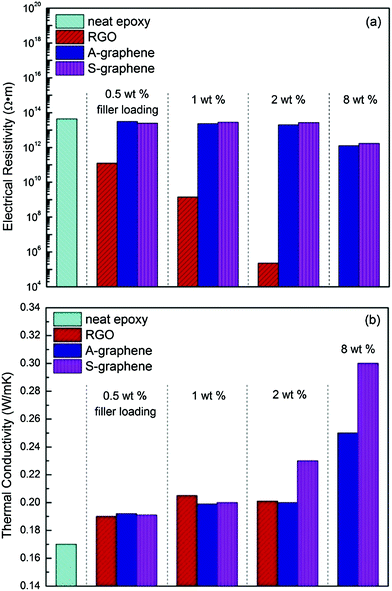 | ||
| Fig. 9 (a) Electrical resistivities and (b) thermal conductivities of neat epoxy and its nanocomposites filled with different percentages of RGO, A-graphene and S-graphene. | ||
The thermal conductivities of neat epoxy and its nanocomposites filled with RGO, A-graphene and S-graphene at different filler loadings are shown in Fig. 9b. RGO is ineffective in improving the thermal conductivity of epoxy, which may be due to the modulus mismatch between the soft polymer matrix and rigid RGO that induces phonon scattering. On the other hand, increased loading of RGO causes its aggregation in the epoxy matrix, which blocks the effective phonon transport path and acts like a heat reservoir, restricting heat diffusion.17,29 At 2 wt% filler content, the epoxy/S-graphene nanocomposite exhibits a higher thermal conductivity than epoxy/A-graphene and epoxy/RGO nanocomposites, the improvement is more obvious at 8 wt% filler content, where the thermal conductivity of the epoxy/S-graphene nanocomposite is increased by 72% in comparison to that of neat epoxy (0.173 W mK−1). The lack of thermal conductivity data of epoxy/RGO (8 wt%) nanocomposite is due to the extreme difficulty in processing the sample, alternatively, epoxy nanocomposite with 8 wt% of silica nanoparticles was prepared and its thermal conductivity is merely 0.205 W mK−1. There are two reasons for the improvement of thermal conductivity by S-graphene: first is the layered structure that benefits the formation of an interconnecting network; second, the silica nanoparticles of S-graphene acts as a buffer layer to reduce the modulus mismatch between the fillers and the matrix and thus reduces the phonon scattering at the interface.8
Microstructure and dynamic mechanical properties of epoxy nanocomposites
Fig. 10 shows SEM images of the epoxy nanocomposites with 2 wt% of RGO, A-graphene and S-graphene. RGO is clearly observed in the form of agglomerates and pulled out from the matrix. A-graphene and S-graphene are well-embedded in the epoxy matrix due to the improved interfacial interactions between fillers and matrix. The improved interfacial interactions are well reflected in the dynamic mechanical properties of the epoxy nanocomposites.30,31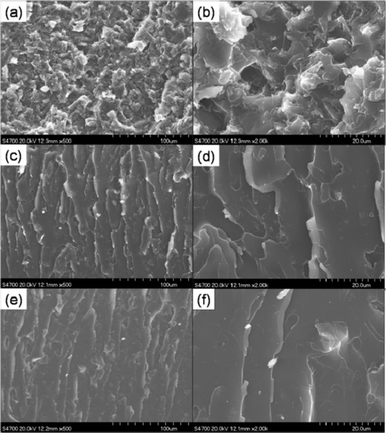 | ||
| Fig. 10 SEM images of the epoxy nanocomposites with 2 wt% of (a, b) RGO, (c, d) A-graphene and (e, f) S-graphene. | ||
Fig. 11 shows plots of storage modulus and dynamic loss as a function of temperature for neat epoxy and its nanocomposites with 2 wt% of RGO, A-graphene and S-graphene. At room temperature, the storage modulus of the nanocomposite with 2 wt% S-graphene is the highest (2.12 GPa), which is 89.3% larger than that of neat epoxy (1.12 GPa), and 40.4% larger than that of the nanocomposite with 2 wt% RGO (1.51 GPa). Furthermore, the glass transition temperature of the nanocomposite with S-graphene is 124.1 °C, which is much higher than those of neat epoxy (115.5 °C) and the nanocomposite with RGO (116.6 °C). The increased glass transition temperature should result from the interaction between the hydroxyl group enriched silica layer of S-graphene and epoxy matrix. In addition, the intensity of the dynamic loss peak of epoxy is decreased with S-graphene, indicating an enhanced interfacial interaction and an increasing load transfer efficiency at the interface between S-graphene and epoxy.32 The improved interfacial interaction between the filler and the epoxy matrix is another positive factor on interfacial thermal conductance enhancement as the strong interfacial bonding decreases the thermal contact resistance.16,33
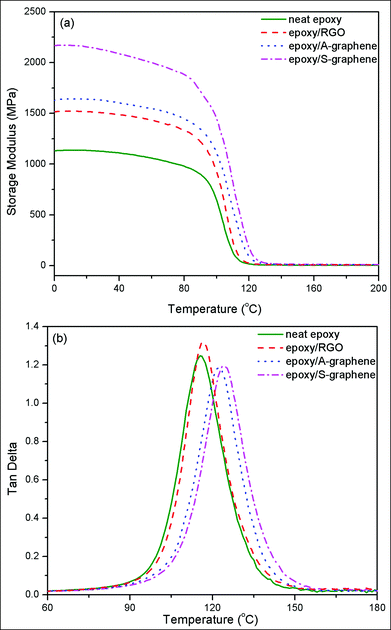 | ||
| Fig. 11 Plots of (a) storage modulus and (b) dynamic loss as a function of temperature for neat epoxy and its nanocomposites with 2 wt% of RGO, A-graphene and S-graphene. | ||
Conclusions
By reaction with APTES, GO is reduced and functionalized simultaneously. Coating of silica nanoparticles on A-graphene is realized by a sol–gel approach using TEOS as the precursor of silica at room temperature. The silica layer on S-graphene makes electrically conducting graphene insulating, reduces the modulus mismatch between the filler and matrix, and improves the interfacial interaction of the nanocomposites. S-graphene is more effective in improving thermal conductivity of epoxy than RGO and A-graphene. The thermal conductivity of epoxy is increased by 72% with 8 wt% of S-graphene and the epoxy/S-graphene nanocomposites retain high electrical resistivities due to the presence of the silica layers on S-graphene.Such thermally conductive and electrically insulating nanocomposites are key materials in developing integrated multifunctional structural/electronic systems and now being used in thermal-control and electronic-packaging areas.
Acknowledgements
Financial support from the National Natural Science Foundation of China (51125010, 51221002) and the Specialized Research Fund for the Doctoral Program of Higher Education of China (20100010110006) is gratefully acknowledged.Notes and references
- D. G. Cahill, W. K. Ford, K. E. Goodson, G. D. Mahan, A. Majumdar, H. J. Maris, R. Merlin and S. R. Phillpot, J. Appl. Phys., 2003, 93, 793–818 CrossRef CAS PubMed.
- S. Nikkeshi, M. Kudo and T. Masuko, J. Appl. Polym. Sci., 1998, 69, 2593–2598 CrossRef CAS.
- Y. M. Chen and J. M. Ting, Carbon, 2002, 40, 359–362 CrossRef CAS.
- L. M. Veca, M. J. Meziani, W. Wang, X. Wang, F. Lu, P. Zhang, Y. Lin, R. Fee, J. W. Connell and Y. P. Sun, Adv. Mater., 2009, 21, 2088–2092 CrossRef CAS.
- C. P. Wong and R. S. Bollampally, J. Appl. Polym. Sci., 1999, 74, 3396–3403 CrossRef CAS.
- M. Hu, P. Keblinski and P. K. Schelling, Phys. Rev. B: Condens. Matter Mater. Phys., 2009, 79, 104305 CrossRef.
- K. Chu, W. Li, H. Dong and F. Tang, Europhys. Lett., 2012, 100, 36001 CrossRef.
- M. Hu, S. Shenogin and P. Keblinski, Appl. Phys. Lett., 2007, 91, 241910 CrossRef PubMed.
- A. G. Every, Y. Tzou, D. P. H. Hasselman and R. Raj, Acta Metall. Mater., 1992, 40, 123–129 CrossRef CAS.
- E. T. Swartz and R. O. Pohl, Rev. Mod. Phys., 1989, 61, 605–668 CrossRef.
- S. Shenogin, L. Xue, R. Ozisik, P. Keblinski and D. G. Cahill, J. Appl. Phys., 2004, 95, 8136–8144 CrossRef CAS PubMed.
- A. A. Balandin, S. Ghosh, W. Bao, I. Calizo, D. Teweldebrhan, F. Miao and C. N. Lau, Nano Lett., 2008, 8, 902–907 CrossRef CAS PubMed.
- M. J. Allen, V. C. Tung and R. B. Kaner, Chem. Rev., 2010, 110, 132–145 CrossRef CAS PubMed.
- S. Ghosh, I. Calizo, D. Teweldebrhan, E. P. Pokatilov, D. L. Nika, A. A. Balandin, W. Bao, F. Miao and C. N. Lau, Appl. Phys. Lett., 2008, 92, 151911 CrossRef PubMed.
- X. Du, I. Skachko, A. Barker and E. Y. Andrei, Nat. Nanotechnol., 2008, 3, 491–495 CrossRef CAS PubMed.
- W. Cui, F. Du, J. Zhao, W. Zhang, Y. Yang, X. Xie and Y. W. Mai, Carbon, 2011, 49, 495–500 CrossRef CAS PubMed.
- M. C. Hsiao, C. C. M. Ma, J. C. Chiang, K. K. Ho, T. Y. Chou, X. Xie, C. H. Tsai, L. H. Chang and C. K. Hsieh, Nanoscale, 2013, 5, 5863–5871 RSC.
- W. S. Hummers and R. E. Offeman, J. Am. Chem. Soc., 1958, 80, 1339 CrossRef CAS.
- H. C. Schniepp, J. L. Li, M. J. McAllister, H. Sai, M. Herrera-Alonso, D. H. Adamson, R. K. Prudhomme, R. Car, D. A. Saville and I. A. Aksay, J. Phys. Chem. B, 2006, 110, 8535–8539 CrossRef CAS PubMed.
- S. Stankovich, D. A. Dikin, R. D. Piner, K. A. Kohlhaas, A. Kleinhammes, Y. Jia, Y. Wu, S. T. Nguyen and R. S. Ruoff, Carbon, 2007, 45, 1558–1565 CrossRef CAS PubMed.
- R. J. Waltman, J. Pacansky and C. W. Bates, Chem. Mater., 1993, 5, 1799–1804 CrossRef CAS.
- A. Malesevic, R. Vitchev, K. Schouteden, A. Volodin, L. Zhang, G. Van Tendeloo, A. Vanhulsel and C. Van Haesendonck, Nanotechnology, 2008, 19, 305604 CrossRef PubMed.
- K. N. Kudin, B. Ozbas, H. C. Schniepp, R. K. Prudhomme, I. A. Aksay and R. Car, Nano Lett., 2007, 8, 36–41 CrossRef PubMed.
- M. M. Lucchese, F. Stavale, E. H. M. Ferreira, C. Vilani, M. V. O. Moutinho, R. B. Capaz, C. A. Achete and A. Jorio, Carbon, 2010, 48, 1592–1597 CrossRef CAS PubMed.
- M. Kim, J. Hong, J. Lee, C. K. Hong and S. E. Shim, J. Colloid Interface Sci., 2008, 322, 321–326 CrossRef CAS PubMed.
- B. E. Kilbride, J. N. Coleman, J. Fraysse, P. Fournet, M. Cadek, A. Drury, S. Hutzler, S. Roth and W. J. Blau, J. Appl. Phys., 2002, 92, 4024–4030 CrossRef CAS PubMed.
- F. M. Blighe, Y. R. Hernandez, W. J. Blau and J. N. Coleman, Adv. Mater., 2007, 19, 4443–4447 CrossRef CAS.
- C. C. Teng, C. C. M. Ma, S. Y. Yang, Y. W. Huang, K. C. Chiou, T. M. Lee, W. S. He and J. C. Chiang, 4th International Microsystems, Packaging, Assembly and Circuits Technology Conference, Taipei, 2009, pp. 413–416 Search PubMed.
- P. Kim, L. Shi, A. Majumdar and P. L. McEuen, Phys. Rev. Lett., 2001, 87, 215502 CrossRef CAS.
- Y. Pan, Y. Xu, L. An, H. Lu, Y. Yang, W. Chen and S. Nutt, Macromolecules, 2008, 41, 9245–9258 CrossRef CAS.
- H. Lu, H. Shen, Z. Song, K. S. Shing, W. Tao and S. Nutt, Macromol. Rapid. Commun., 2005, 26, 1445–1450 CrossRef CAS.
- P. C. Ma, J. K. Kim and B. Z. Tang, Compos. Sci. Technol., 2007, 67, 2965–2972 CrossRef CAS PubMed.
- R. Prasher, Appl. Phys. Lett., 2009, 94, 041905 CrossRef PubMed.
Footnote |
| † Electronic supplementary information (ESI) available: SEM image of A-graphene and its corresponding elemental mapping images; SEM and TEM images of S-graphene and its corresponding elemental mapping images. See DOI: 10.1039/c4ra00518j |
| This journal is © The Royal Society of Chemistry 2014 |

