The luminescence properties of novel α-Mg2Al4Si5O18:Eu2+ phosphor prepared in air

Jian Chen, Yan-gai Liu*, Haikun Liu, Dexin Yang, Hao Ding, Minghao Fang and Zhaohui Huang
School of Materials Science and Technology, China University of Geosciences (Beijing), Beijing 100083, China. E-mail: liuyang@cugb.edu.cn; Fax: +86-10-82322186; Tel: +86-10-82322186

Received 16th January 2014 , Accepted 4th April 2014

First published on 8th April 2014


Abstract

The α-Mg2Al4Si5O18:Eu2+ phosphor was firstly prepared via the conventional high temperature solid-state reaction method and the reduction of Eu3+ to Eu2+ in air was observed in α-Mg2Al4Si5O18:Eu. The phase structure, photoluminescence (PL) properties, the PL thermal stability and the fluorescence decay curves of the samples were investigated, respectively. Emission and excitation spectra were employed to detect the presence of Eu2+ ions in the compound. Under the excitation at 365 nm, the phosphor exhibited a broad-band blue emission with peak at 463 nm, which was ascribed to the 4f–5d transition of Eu2+. It was further proved that the dipole–dipole interactions resulted in the concentration quenching of Eu2+ in α-Mg2Al4Si5O18:xEu2+ phosphors. When the temperature was increased to 150 °C, the emission intensity of the α-Mg2Al4Si5O18:0.12Eu2+ phosphor was 59.07% of the initial value at room temperature. The activation energy ΔE was calculated to be 0.21 eV, which proved the good thermal stability of the sample. All the properties indicated that the blue-emitting α-Mg2Al4Si5O18:Eu2+ phosphor has potential application in white LEDs.

1 Introduction

Due to their high luminous efficiency, low power consumption, and environment-friendly characteristics in comparison with traditional incandescent and currently implemented fluorescent lamps, phosphor-converted white light emitting-diodes (pc-wLEDs) have received great attention to be a next-generation light source.1 Currently, commercial w-LEDs employ a blue InGaN LED chip with a yellow phosphor of Ce3+-doped yttrium aluminum garnet (YAG:Ce), and are very poor in the color rendering index (CRI) because of the color deficiency in the red region.2 Consequently, w-LEDs fabricated with near ultraviolet (n-UV) LEDs chip and three primary color emissions mixed (red, green and blue) phosphors have been widely investigated.3

The luminescent properties of Eu2+ ions in various matrix compounds and the reduction processes of Eu3+ to Eu2+ in phosphor have attracted significant attention in the past decades.4–9 Normally, the photoluminescence of Eu2+ in most silicates host is associated with the 4f → 5d transitions. Compared with 4f orbitals of Eu2+, those of 5d orbitals are sensitive to the changes of the crystal field strength due to its existing in the outer shell. The peak positions in the emission spectra depend strongly on the nature of the Eu2+ surroundings.9 Therefore Eu2+ can be efficiently excited in a broad spectral range depending on the host lattices in which it is incorporated.

Generally, the reducing atmospheres, such as H2, H2/N2, or CO, is necessary to reduce Eu3+ to Eu2+ during the annealing process in order to prepare the optical materials activated by Eu2+ ions since the raw material of the europium is Eu2O3.6,7 If the reduction of Eu3+ to Eu2+ can be realized in air condition, it would greatly reduce the cost and increase the safety in preparing of Eu2+-activated phosphor materials. Recently, the reduction of Eu3+ to Eu2+ in air condition has been reported.8,10–18 Since the first reported of an aliovalent substitution method to reduce trivalent rare earth ions Eu3+ into divalent ions Eu2+ even in air when these ions were doped in alkaline earth borate SrB4O7 (ref. 11) in 1993, there have been significant advances in LEDs. Until now, the phenomena of Eu3+ reducing into Eu2+ in air have been found in many systems, such as borates (SrB4O7:Eu, SrB6O10:Eu, BaB8O13:Eu and CaBPO5:Eu),8,10–13 phosphates (Ba3(PO4)2:Eu),14 sulfates (BaSO4:Eu),15 aluminates (Sr4Al14O25:Eu),16 silicates (BaMgSiO4:Eu)17 and ZnO–B2O3–P2O5 glasses.18

The cordierite is a magnesium/aluminium aluminosilicate with the crystallo-chemical formula Mg2[6]Al3[4](Si5Al[4]O18),19 which have a complex structure with six tetrahedral units [Si/AlO4]. Binding of the tetrahedral units is ensured by the [MgO6] octahedral and [AlO4] tetrahedral. The cordierite has several polymorphic modifications. A low temperature modification (β-Mg2Al4Si5O18) crystallizes in the orthorhombic system, a metastable modification (μ-Mg2Al4Si5O18, crystallizes from glass below 925 °C)20 crystallizes in the hexagonal and a high temperature modification (α-Mg2Al4Si5O18) crystallizes in the hexagonal system.21

Magnesium cordierite, Mg2Al4Si5O18, have been used more frequently as promising ceramic material over the past several years attribute to easy preparation, chemical and thermal durability and mechanical properties resistant to corrosion at higher temperature.22–24 Piriou et al.25 and Thim et al.26 have studied luminescent properties of magnesium cordierite (Mg2Al4Si5O18) doped with Eu3+ ion prepared by sol–gel without any flux at 1300 °C and 1200 °C, respectively, and they all found the weak broad peak in the range of 420–570 nm. However, they have not further investigated about the broad peak in the range of 420–570 nm. Additionally, no further researches on the luminescence properties of Mg2Al4Si5O18 have been reported so far. In this study, the Mg2Al4Si5O18:Eu2+ was prepared in air via using the conventional high temperature solid-state reaction method. The phase structure and luminescence properties of the blue-emitting (peak at 463 nm) α-Mg2Al4Si5O18:Eu2+ phosphors and the mechanism of the Eu3+ to Eu2+ reduction in α-Mg2Al4Si5O18 were studied in detail. These results indicate that the sample has good performance for w-LEDs application and it is of great significance for energy conservation.

2 Experimental

The Mg2Al4Si5O18:Eu2+ phosphors were prepared by conventional solid-state method with a stoichiometric quantities of MgO (A. R.), Al2O3 (A. R.), H2SiO3 (A. R.), Eu2O3 (A. R.), La2O3 (A. R.) (an excess of 8 wt% of La2O3 was added as flux). The selected starting materials were mixed and ground homogeneously according to the given stoichiometric ratio in the agate mortar, and then some mixtures were fired at 1300 °C in an alumina crucible for 6 hours in air. Other mixtures were sintered at the same temperature and time in the thermal carbon-reducing atmosphere (TCRA). The crystalline phases of synthesized products were examined by X-ray diffraction (XRD; D8 Advance diffractometer, Germany), using Cu-Kα1 radiation (λ = 1.5406 Å) with a step of 0.02° (2θ) and a scanning rate of 2°·min−1. The emission and the excitation spectra were recorded on a Hitachi F-4600 fluorescence spectrofluorimeter.

3 Results and discussion

3.1 Phase structure of the samples

Fig. 1 shows the XRD patterns of Mg2Al4Si5O18 [Fig. 1(a)], Mg2Al4Si5O18:0.16Eu [Fig. 1(b)], the standard pattern (JCPDS 841222) of α-Mg2Al4Si5O18 and the standard pattern (JCPDS 130294) of β-Mg2Al4Si5O18. As the Fig. 1 shows, the characteristic peak between the JCPDS card no. 13-0294 (β-phase) and no. 84-1222 (α-phase) look like similar, while there are some difference to distinguish that the phosphor is either β-Mg2Al4Si5O18 or α-Mg2Al4Si5O18. It is obviously shows that the amount of characteristic peaks of β-phase is more than α-phase (such as: 23.14° and 37.88°) and XRD patterns of Mg2Al4Si5O18 don't have any peaks on 23.14° and 37.88°. In addition, some peaks of no. 13-0294 would form the double peak phenomenon due to the distance of characteristic peaks are close [such as: (26.34°, 26.43°), (28.32°, 28.48°) and (29.37°, 29.41°, 29.64°)], while the formation of peaks of Mg2Al4Si5O18 on 26.19°, 28.28° and 29.36° are symmetrical single peaks. It indicates that the phosphors we prepared are α-Mg2Al4Si5O18 (hexagonal) which crystallize in a hexagonal cell, with the space group P6/mcc, and has a hexagonal structure with the cell parameters of a = 9.794 Å, b = 9.794 Å, c = 9.339 Å, V = 775.70 Å3 and Z = 2.27 The miller indices for each XRD pattern are demonstrated in Fig. 1(a). It also can be seen that all the diffraction peaks of compounds are all well indexed to the standard pattern of α-Mg2Al4Si5O18, indicating that the obtained sample is single phase and the doping caused by a small amount of Eu ions did not cause the structural variation. In the α-Mg2Al4Si5O18:Eu2+ phosphor system, Piriou et al.25 had demonstrated that the Eu ion cannot inside the structure channels at room temperature and it is assumed that Eu2+ (r = 0.117 nm when coordinate number (CN) = 6) ions occupied the Mg (r = 0.072 when CN = 6) sites because both the Al3+ (r = 0.039 nm) and the Si4+ (r = 0.026 nm) sites are too small to take the Eu2+ ions.28
image file: c4ra00452c-f1.tif
Fig. 1 XRD patterns of α-Mg2Al4Si5O18:0.16Eu (a), α-Mg2Al4Si5O18 (b), the standard pattern (JCPDF84-1222) of α-Mg2Al4Si5O18, and the standard pattern (JCPDF13-0294) of β-Mg2Al4Si5O18.

3.2 Luminescence properties

It is well known that the emission of Eu2+ ion in a solid state compound generally originated from the transition of 4f65d → 4f7 with a broad band character. However, the emission of Eu3+ ion shows a narrow band character in the spectral region of 570–750 nm corresponding to 5D07FJ (J = 0–4) transitions.17 In consequence, the existence of Eu2+ ions in phosphor compounds can be detected by luminescent measurements.

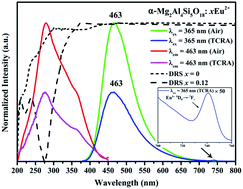
Fig. 2 depicts the photoluminescence (PL), photoluminescence excitation (PLE) and reflectance spectra of α-Mg2Al4Si5O18:xEu prepared in air. Although the precursor for europium was trivalent from Eu2O3 and the samples were prepared by annealing at 1300 °C in air condition, it seems that the europium exists in divalent state in the compound. The PLE monitoring by 463 nm is composed of one strong absorption peak at 275 nm in the spectral range from 200 to 450 nm, which is attributed to 4f7(8S7/2)–4f65d transitions of the doped Eu2+ ions. PL spectrum shows that α-Mg2Al4Si5O18:xEu phosphor exhibits similar blue emission band peaked at 463 nm under the excitation at 365 nm, which belongs to the typical emission of Eu2+ ions ascribed to 4f65d–4f7 transitions.10 As shown in Fig. 2, there are a part of overlap between the PL and PLE spectra of α-Mg2Al4Si5O18:xEu, indicates the existence of energy transfer between Eu2+–Eu2+.29 In the reflection spectra, the α-Mg2Al4Si5O18 host material shows a high reflection in the visible range. As Eu2+ ions were doped into the host, a strong broad absorption appeared in the range of 200–400 nm near-UV, which assigned to the 4f7–4f65d1 absorption of Eu2+ ions. The results confirm that the phosphor can match well with the emission of diffuse reflection spectrum. Additionally, we synthesized the α-Mg2Al4Si5O18:Eu2+ phosphor in TCRA, and detected its PL and PLE spectra (Fig. 2) for further verification of the existence of Eu2+ ions in α-Mg2Al4Si5O18:Eu prepared in air. By comparing the spectral characteristics of the PL and PLE between the air and TCRA, the shapes and positions of the PL and PLE are almost the same. However, as the inset of Fig. 2 shows, a very weak emission, which peaked at 740 nm and originated from the transition of 5D07F3 from Eu3+, could be observed from the enlarged emission spectra. It can be seen clearly that most of the Eu3+ have been reduced to Eu2+ during the annealing process, while a very small amount of Eu3+ also exist. Hence, it indicated that the incomplete reduction of Eu3+ which prepared in air might be the main reason of decrement of intensity of PL from air to TCRA and it confirmed by Peng et al.16 and Liu et al.30 Consequently, we can conclude that the reduction of Eu3+ to Eu2+ in air took place in α-Mg2Al4Si5O18:Eu during the preparation at high temperature.


image file: c4ra00452c-f2.tif
Fig. 2 The excitation and emission spectra of α-Mg2Al4Si5O18:0.12Eu2+ (λem = 454 nm for excitation and λex = 365 nm for emission) prepared in air and in TCRA; the diffuse reflection spectrum of α-Mg2Al4Si5O18:xEu2+(x = 0 and 0.12). The range of 700–760 nm of emission spectra prepared in TCRA was amplified by factor of 50. All spectra were taken at RT.

As we can also find from the excitation spectrum, the broad-band excitation character from 200–450 nm verified that the phosphor can match well with the emission of n-UV chip. The CIE color coordinate for the α-Mg2Al4Si5O18 phosphor under 365 nm UV excitation is calculated to be (0.1674, 0.1700). These results mean that the phosphor can be used as a blue-emitting phosphor for w-LEDs application.

The emission (λex = 365 nm) spectra of α-Mg2Al4Si5O18:xEu (x = 0.02, 0.04, 0.08, 0.12, 0.16) phosphors at room temperature were presented in Fig. 3. As found in Fig. 3, with an increase of Eu concentration up to 4 mol%, the intensities increase to maximum and then the emission intensity decreased with further increasing concentration, which is caused by the concentration quenching effect. From the emission spectra, the dependence of the emission intensity on the concentration of Eu2+ is shown in the inset of Fig. 3. Thus, the optimum Eu-doping concentration is about 4 mol% for obtaining the strongest PL emission intensity. In addition, a red-shift of the peak wavelength is observed as the concentration of Eu2+ increases gradually, which could originate from the variations of the crystal field strength surrounding the activators.31,32 When the doping concentration of Eu2+ increases, the inter-atomic distance between the two activators become shorter and the interaction is enhanced; as a result, the 5d band of Eu2+ is decreased, and finally the emission wavelength is red-shifted with increasing Eu2+ concentration.33 The mechanism of the interaction between sensitizers or between sensitizer and activator can be expressed by the following equation:34,35

 
image file: c4ra00452c-t1.tif(1)
where x is the activator concentration, which is not less than the critical concentration; I/x is the emission intensity (I) per activator concentration (x); K an α are constants for the same excitation condition of host crystal; and θ is a function of multipole–multipole interaction. According to the previous reports, θ = 3 means the energy transfer among the nearest-neighbor ions and θ = 6, 8 and 10 corresponds to dipole–dipole (d–d), dipole–quadrupole (d–q), and quadrupole–quadrupole (q–q) interactions, respectively.36 As the Fig. 4 shows, the relationship between the lg(I/x) and lg(x) shows a relatively linear and the slope of straight line is measured to be −1.8446 which equals −θ/3. Thus the value of θ can be calculated to be 5.5337, which is close to 6 that means the quenching results from dipole–dipole interactions in α-Mg2Al4Si5O18:xEu.


image file: c4ra00452c-f3.tif
Fig. 3 The emission spectra of α-Mg2Al4Si5O18:xEu (x = 0.02, 0.04, 0.08, 0.12 and 0.16). The inset shows the dependence of the emission intensity on the concentration of Eu2+.

image file: c4ra00452c-f4.tif
Fig. 4 The relationship between the lg(I/x) and lg(x) of α-Mg2Al4Si5O18:xEu2+.

In general, the thermal stability of the phosphor plays an important role in solid-state lighting and has a significant influence on the light output and CRI. The temperature-dependent emission spectra under 365 nm excitation of α-Mg2Al4Si5O18:0.12Eu2+ prepared in air are shown in Fig. 5. The intensity of the emission spectrum decreases with temperature increment. The emission intensities of α-Mg2Al4Si5O18:0.12Eu2+ decrease to 56.95% of the initial emission intensity, which is regarded as 100%, with the increasing temperature up to 150 °C. To further investigate the relationship between the photoluminescence and the temperature and to calculate the activation energy from the thermal quenching, the activation energy was calculated using the Arrhenius equation:37,38

 
image file: c4ra00452c-t2.tif(2)
where I0 is the initial emission intensity of the phosphor at room temperature, IT is the emission intensity at different temperatures, c is a constant, ΔE is the activation energy for the thermal quenching, and k is the Boltzman's constant (8.62 × 10⁻⁵ eV). As shown in Fig. 6, the activation energy ΔE of the thermal quenching of α-Mg2Al4Si5O18:0.12Eu2+ was calculated as 0.21 eV via plotting ln[(I0/I) − 1] against 1/kT, where a straight slope equals −ΔE.


image file: c4ra00452c-f5.tif
Fig. 5 The emission spectra of α-Mg2Al4Si5O18:0.12Eu2+ prepared in air at different temperatures. The inset shows the emission intensities as a function of the temperature.

image file: c4ra00452c-f6.tif
Fig. 6 The Arrhenius fitting of the emission intensity of α-Mg2Al4Si5O18:0.12Eu2+ phosphor and the calculated activation energy (ΔE) for thermal quenching.

Fig. 7 presents the room temperature decay curves of the Eu2+ luminescence in α-Mg2Al4Si5O18:xEu with different Eu contents (x = 0.02–0.16) upon excitation at 365 nm. The entire decay curve can be well fitted to a second-order exponential decay model by the following equation:39

 
I(t) = A1[thin space (1/6-em)]exp(−t/τ1) + A2(−t/τ2) (3)
where I is the luminescence intensity; A1 and A2 are constants; t is time; and τ1 and τ2 are the lifetimes for the exponential components. Further, the average lifetime constant (τ*) can be calculated as
 
τ* = (A1τ12 + A2τ22)/(A1τ1 + A2τ2) (4)


image file: c4ra00452c-f7.tif
Fig. 7 The decay curves of α-Mg2Al4Si5O18:xEu (x = 0.02–0.16) monitored at 463 nm.

The obtained lifetimes monitored at 365 nm were calculated to be 613.02, 775.23, 610.01, 433.00 and 320.70 ns with Eu content = 2, 4, 8, 1.2 and 1.6 mol%, respectively. With an increase of Eu concentration up to 4 mol%, the measured lifetime τ of Eu2+ 5d–4f emission increase to maximums, and then decline sharply, which is a typical sign of energy transfer, and causes concentration quenching.37 The measured lifetime is also related to the total relaxation rate by:40,41

 
image file: c4ra00452c-t3.tif(5)
where τ0 is the radiative lifetime; Anr is the nonradiative rate due to multiphonon relaxation; Pt is the energy transfer rate between Eu3+ ions. The distance between Eu2+ ions decreases with the increasing Eu2+ concentration. Thus, the energy transfer rate between Eu2+–Eu2+ and the probability of energy transfer to luminescent killer sites increases.42 In consequence the lifetimes are shortened with increasing Eu2+ concentration.

3.3 The mechanism of reduction Eu3+ → Eu2+ in α-Mg2Al4Si5O18:Eu prepared in air

The reduction of Eu3+ to Eu2+ in α-Mg2Al4Si5O18:Eu in air can be explained with the charge compensation mechanism.8,16 When Eu3+ ions were doped into α-Mg2Al4Si5O18, the Mg2+ ions would be substituted non-equivalently. For the purpose of maintaining charge balance, three Mg2+ ions must be replaced by two Eu3+ ions. Thus, each substitution of every two Eu3+ ion would create one vacancy defect V′′Mg with two negative charges, and two positive defects of EuMg˙ in the structure. Then the vacancy of V′′Mg and the two EuMg˙ defects would act as the donor of electrons and the acceptor of electrons, respectively. Consequently, under the thermal stimulation, the negative charges in vacancy defects of V′′Mg would be transferred into Eu3+ sites and reduce Eu3+ to Eu2+. The whole process of the charge compensation mechanism could be expressed as follows:
 
3Mg2+ + 2Eu3+ → V′′Mg + 2EuMg˙ (6)
 
V′′Mg → V×Mg + 2e (7)
 
2EuMg˙ + 2e → 2Eu×Mg (8)

Moreover, tetrahedral anion group composed by [Si/AlO4] and [AlO4] also played a role of shield for Eu2+ against the oxidation under the annealing process. Fig. 8 exhibits the crystal structures of hexagonal α-Mg2Al4Si5O18.43 The reduced Eu2+ ions substituted the Mg2+ ions in [MgO6] octahedral. The [MgO6] octahedral was surrounded by the tetrahedral framework structure which consists of corner-shared tetrahedral of [Si/AlO4] and [AlO4].44 For these reduced Eu2+ ions are located in the octahedral of 3-D network, it could effectively resist the attack of oxygen to Eu2+ ions and can stabilize Eu2+ ions.


image file: c4ra00452c-f8.tif
Fig. 8 The crystal structures of α-Mg2Al4Si5O18.

4 Conclusions

As a summarization, the blue-emitting α-Mg2Al4Si5O18:xEu phosphors were prepared in air via a high temperature solid-state reaction method. The phosphor exhibited a blue emission band peaked at 463 nm ascribed to the 4f–5d transition of Eu2+. As for α-Mg2Al4Si5O18:xEu2+, the critical quenching concentration of Eu2+ was about 4 mol%, and the corresponding concentration quenching mechanism was verified to be the dipole–dipole interaction. The activation energy ΔE was calculated to be 0.21 eV, which proved the good thermal stability of the sample. The color coordinate was (0.1674, 0.1700), indicating that the α-Mg2Al4Si5O18:Eu phosphor can be regarded as a blue-emitting phosphor for WL-LEDs application. The reduction of Eu3+ to Eu2+ in α-Mg2Al4Si5O18:Eu prepared in air was explained with the charge compensation model and the structures of 3-D networks composed by [Si/AlO4] and [AlO4] tetrahedra are possible for maintaining of the reduction (Eu3+–Eu2+) when samples were prepared in air at high temperature.

Acknowledgements

We thank the National Natural Science Foundation of China through Grant no. 51172216, the Fundamental Research Funds for the Central Universities through Grant no. 2012067 and the Program for New Century Excellent Talents in University of Ministry of Education of China through Grant no. NCET-12-0951.

Notes and references

  1. H. D. Luo, J. Liu, X. Zheng, B. Xu, Y. M. Lu, L. X. Han, K. X. Ren and X. B. Yu, J. Am. Ceram. Soc., 2012, 95, 3582 CrossRef CAS.
  2. J. K. Park, M. A. Lim, C. H. Kim and H. D. Park, Appl. Phys. Lett., 2003, 82, 683 CrossRef CAS.
  3. Z. G. Xia and W. W. Wu, Dalton Trans., 2013, 42, 12989 RSC.
  4. G. Blasse, W. L. Wanmaker, J. W. Vrugt and A. Bril, Philips Res. Rep., 1968, 189, 23 Search PubMed.
  5. S. H. M. Poort, W. Janssen and G. Blasse, J. Alloys Compd., 1997, 93, 260 Search PubMed.
  6. C. H. Kim, I. E. Kwon, C. H. Park, Y. J. Hwang, H. S. Bae, B. Y. Yu, C. H. Pyun and G. Y. Hong, J. Alloys Compd., 2000, 311, 33 CrossRef CAS.
  7. T. Justel, H. Bechtel, W. Mayr and D. U. Wiechert, J. Lumin., 2003, 104, 137 CrossRef CAS.
  8. Z. W. Pei, Q. Su and J. Zhang, J. Alloys Compd., 1993, 198, 51 CrossRef CAS.
  9. S. H. M. Poort and G. Blasse, J. Lumin., 1997, 72, 247 CrossRef.
  10. Q. H. Zeng, T. Z. Zhang and Z. W. Pei, J. Mater. Sci. Technol., 1999, 15, 281 CAS.
  11. Q. H. Zeng, Z. W. Pei, S. B. Wang and Q. Su, J. Alloys Compd., 1998, 275, 238 CrossRef.
  12. H. B. Liang, Q. Su, Y. Tao, T. D. Hu and T. Liu, J. Alloys Compd., 2002, 334, 293 CrossRef CAS.
  13. Q. Su, H. B. Liang, T. D. Hu, Y. Tao and T. Liu, J. Alloys Compd., 2002, 334, 132 CrossRef.
  14. I. Tale, P. Ku lis and V. Kronghauz, J. Lumin., 1979, 20, 343 CrossRef CAS.
  15. U. Madhusoodanan, M. T. Jose and A. R. Lakshmanan, Radiat. Meas., 1999, 30, 65 CrossRef CAS.
  16. M. Y. Peng, Z. W. Pei, G. Y. Hong and Q. Su, Chem. Phys. Lett., 2003, 371, 1 CrossRef CAS.
  17. M. Y. Peng, Z. W. Pei, G. Y. Hong and Q. Su, J. Mater. Chem., 2003, 13, 1202 RSC.
  18. Z. H. Lian, J. Wang, Y. H. Lv, S. B. Wang and Q. Su, J. Alloys Compd., 2007, 430, 257 CrossRef CAS.
  19. A. N. Winchell and H. Winchell, The microscopic characters of artificial inorganic solid substances: optical properties of artificial minerals, Academic Press, New York, 1964 Search PubMed.
  20. V. L. Stolyarova, S. I. Lopatin and O. B. Fabrichnaya, Russ. J. Gen. Chem., 2011, 10, 2051 CrossRef.
  21. The powder diffraction File, JCPDS – Joint Committee on Powder Diffraction Standards International Centre for Diffraction Data, 1997.
  22. M. G. M. U. Ismail, H. Tsunatori and Z. Nakai, J. Am. Ceram. Soc., 1990, 73, 537 CrossRef CAS.
  23. S. Kumar, K. K. Singh and P. Ramachandrarao, J. Mater. Sci. Lett., 2000, 19, 1263 CrossRef CAS.
  24. S. Ianoşev, I. Lazău, C. Păcurariu and A. Avramescu, Process. Appl. Ceram., 2008, 2, 39 CrossRef.
  25. B. Piriou, Y. F. Chen and S. Vilminot, Eur. J. Solid State Inorg. Chem., 1998, 35, 341 CrossRef CAS.
  26. G. P. Thim, H. F. Brito, S. A. Silva, M. A. S. Oliveira and M. C. F. C. Felinto, J. Solid State Chem., 2003, 171, 375 CrossRef CAS.
  27. P. Predecki, J. Haas, J. Faber and R. L. Hitterman, J. Am. Ceram. Soc., 1987, 3, 175 CrossRef.
  28. Z. G. Xia, J. Zhou and Z. Y. Mao, J. Mater. Chem., 2013, 1, 5917 CAS.
  29. Y. Guo, X. Yu, J. Liu and X. Yang, J. Rare Earths, 2010, 28, 34 CrossRef CAS.
  30. S. M. Liu, G. L. Zhao, W. R. Ruan, Z. W. Yao, T. T. Xie, J. Jin, H. Ying, J. X. Wang and Z. Nakai, J. Am. Ceram. Soc., 2008, 91, 2740 CrossRef CAS.
  31. T. L. Zhou, H. R. Wang, F. S. Liu, H. Zhang and Q. L. Liu, J. Electrochem. Soc., 2011, 158, 1671 Search PubMed.
  32. J. B. Lin and D. M. Chen, J. Chin. Soc. Rare Earths, 2001, 19, 498 Search PubMed.
  33. C. Chartier, C. Barthou, P. Benalloul and J. M. Frigerio, J. Lumin., 2005, 111, 147 CrossRef CAS.
  34. D. L. Dexter, J. Chem. Phys., 1953, 21, 836 CrossRef CAS.
  35. G. Blasse, Phys. Lett. A, 1968, 28, 444 CrossRef CAS.
  36. L. Ozawa and P. M. Jaffe, J. Electrochem. Soc., 1971, 118, 1678 CrossRef CAS.
  37. R. J. Xie and N. Hirosaki, Appl. Phys. Lett., 2007, 90, 191101 CrossRef.
  38. Z. G. Xia, R. S. Liu, K. W. Huang and V. Droid, J. Mater. Chem., 2012, 22, 15183 RSC.
  39. W. J. Yang, L. Luo, T. M. Chen and N. S. Wang, Chem. Mater., 2005, 17, 3883 CrossRef CAS.
  40. D. Wang and N. Kodama, J. Solid State Chem., 2009, 182, 2219 CrossRef CAS.
  41. B. Henderson and G. F. Imbusch, Optical Spectroscopy of Inorganic Solids, Clarendon, Oxford, 1989, p. 151 Search PubMed.
  42. D. Y. Wang, C. H. Huang, Y. C. Wu and T. M. Chen, J. Mater. Chem., 2011, 21, 10818 RSC.
  43. B. Peplinski, R. Müller, J. Wenzel, R. Sojref and D. Schultze, Mater. Sci. Forum, 2000, 321, 150 CrossRef.
  44. Z. W. Lu, L. Q. Weng, S. H. Song, P. X. Zhang, Q. Q. Hou and X. Z. Ren, J. Sol-Gel Sci. Technol., 2012, 62, 160 CrossRef CAS.

This journal is © The Royal Society of Chemistry 2014
Click here to see how this site uses Cookies. View our privacy policy here.