A probe for ratiometric near-infrared fluorescence and colorimetric hydrogen sulfide detection and imaging in live cells†
Debabrata Maitya,
Anand Raja,
Pralok K. Samantab,
D. Karthigeyanc,
Tapas K. Kunduc,
Swapan K. Patib and
T. Govindaraju*a
aBioorganic Chemistry Laboratory, New Chemistry Unit, Jawaharlal Nehru Centre for Advanced Scientific Research, Jakkur P.O., Bangalore-560064, India. E-mail: tgraju@jncasr.ac.in; Fax: +91-80-22082627
bTheoretical Sciences Unit, Jawaharlal Nehru Centre for Advanced Scientific Research, Jakkur P.O., Bangalore-560064, India
cMolecular Biology and Genetics Unit, Jawaharlal Nehru Centre for Advanced Scientific Research, Jakkur P.O., Bangalore-560064, India
First published on 10th February 2014
Abstract
A ratiometric, near-infrared (NIR), fluorescence and colorimetric probe DNPOCy for hydrogen sulfide (H2S) has been developed. The chemical basis for the operation of the probe is thiolysis of a dinitrophenyl ether, which liberates a cyanine dye chromophore. The probe exhibits a rapid response and high sensitivity to H2S in pure aqueous media, in the near infrared optical window. DNPOCy is highly selective for H2S over other biologically relevant species including biothiols. This probe can be conveniently used for monitoring H2S without the interference from pH dependent effects of physiological media. The practical utility of the probe was demonstrated by its application to the detection of H2S in live cells.
Introduction
Along with nitric oxide and carbon monoxide, hydrogen sulfide (H2S) is an important endogenous gasotransmitter.1 Although being toxic, H2S at very low concentrations plays an essential role in many biological processes. Three enzymes, namely cystathionine-β-synthase, cystathionine-γ-lyase, and 3-mercaptopyruvate sulfur transferase, catalyze the production of H2S from cysteine or its derivatives in various organs and tissues.1,2 In humans, altered levels of H2S have been correlated with Down syndrome, Alzheimer's and chronic kidney disease, liver cirrhosis, and diabetes.3–7 Therefore, it is crucial to understand the chemistry and to be able to monitor concentrations of H2S in biological systems.In recent years, several fluorescence probes have been devised for in vitro as well as in vivo detection of H2S.8–18 Although functional, these probes suffer from several important drawbacks. For example, most of the reported probes detect only high concentrations of H2S. However, the concentrations of this analyte in blood is in the 10–100 μM range and even lower (submicromolar range) in living cells. Furthermore, nearly all of the current probes detect H2S in fluorescence off–on manner, which is not ideal for quantitative analysis as compared to those that use ratiometric based approaches. In addition, some of the reported probes detect H2S only in aqueous–organic mixtures, and many are plagued by serious limitations associated with high energy absorption and emission, and long response times (20 min to 2 h).
NIR dyes have a highly unique advantage in tracking molecular events in vivo because light in this wavelength region more deeply penetrates into tissues than does that in the UV and visible regions. Therefore, a need exists for highly selective probes that are able to detect low concentrations of H2S in a purely aqueous medium and that utilize ratiometric fluorescence in the NIR wavelength region.
In earlier efforts, we and others designed cyanine based probes in which a latent electron donating phenolate moiety is conjugated with two electron acceptor quaternary ammonium moieties.19–24 In our previous report, DNBSCy was designed to react with thiol, by protecting the phenolate donor moiety in the probe with a trigger group (2,4-dinitrobenzenesulfonyl: DNBS).20 Thiols such as glutathione (GSH) promoted the removal of trigger group to generate Cy-quinone chromophore in which donor (phenolate) and two acceptors (quaternary ammonium groups) form a conjugated π-system backbone that is isoelectronic with the well-known cyanine dyes such as Cy7.
A similar approach has been employed in the current investigation to construct a H2S selective NIR probe. Although we realized that selection of a trigger group that would be selective for H2S in the presence of other biological thiols would not be straightforward, we envisaged that the lower pKa (6.8) and smaller size of H2S would make it more a more potent nucleophile than thiols such as cysteine (Cys) and GSH. This nucleophilicity difference in conjunction with thiolysis of dinitrophenyl (DNP) ethers has been used advantageously in the past to design probes for H2S.25–30
Result and discussion
We prepared the reaction-based, masked heptamethine cyanine type probe DNPOCy (Scheme 1), which contains a DNP protected phenol as a H2S responsive trigger (Scheme 1). The latent phenolate moiety in DNPOCy is conjugated with two quaternary ammonium groups, which together form a cyanine type probe. We anticipated that HS− species would participate in a nucleophilic aromatic substitution reaction with DNPOCy leading to the generation of phenolate ion. This anion will reversibly form the NIR emitting Cy-quinone dye (Scheme 1).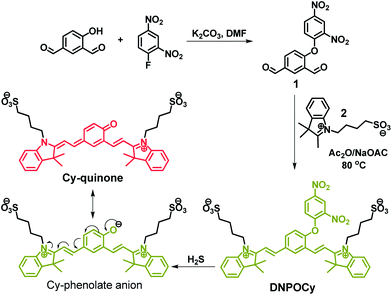 | ||
| Scheme 1 Synthesis of DNPOCy and its reaction with H2S. DNPOCy: greenish-yellow fluorescence (λem = 555 nm); Cy-quinone: NIR red fluorescence (λem = 695 nm). λex = 510 nm. | ||
DNPOCy was synthesized by using the straightforward two-step route outlined in Scheme 1, involving a key aromatic substitution reaction of 1-fluoro-2,4-dinitrobenzene with 4-hydroxy-1,3-benzenedicarboxaldehyde under basic conditions to install the 2,4-dinitrophenyl ether moiety in 1. DNPOCy was then obtained through condensation of the bisaldehyde functionalized ether 1 with 2 equivalents of indolium-3-butylsulfonate (2). All compounds in this synthetic route were characterized by using NMR spectroscopy, mass spectrometry and elemental analysis.
The UV-visible spectrum of DNPOCy in PBS buffer (pH = 7.4) contains an absorption band located at ca. 400 nm with an extinction coefficient (ε) of 3.9 × 10⁴ M−1 cm−1 (Fig. S1, ESI†). The high energy of this transition is a consequence of the reduced π-electron conjugation caused by the presence of the protected phenolate group. As predicted, the absorption spectrum undergoes a dramatic change when DNPOCy is incubated with 20 μM of NaSH (common source of H2S).
The absorbance at 400 nm decreases while two new absorption bands appear at 475 nm (ε = 3.8 × 10⁴ M−1 cm−1) and 583 nm (ε = 4.3 × 10⁴ M−1 cm−1), which exactly match those in the spectrum of Cy-quinone. Concurrently, the color of the solution changes from greenish yellow to blue. These results indicate that DNPOCy serves as a “naked-eye” probe for H2S. Concentration dependent titration study showed that in the presence of 10 μM DNPOCy, a decrease in absorbance at 400 nm and an increase in absorbance at 475 and 583 nm take place simultaneously and reach respective minimum and maximum values at a NaSH concentration of 20.0 μM (Fig. S2, ESI†).
The results of fluorescence spectroscopy studies show that DNPOCy in PBS buffer (pH = 7.4) emits with a maximum at ca. 555 nm upon excitation at 510 nm (Fig. 1). Addition of 20 μM NaSH to a solution of DNPOCy in this buffer causes a simultaneous decrease in the intensity of the fluorescence band at 555 nm and an increase in an emission band at ca. 695 nm. This remarkably large change (ca. 140 nm) is a highly desirable feature of a ratiometric type fluorescence probe because it assists in increasing the signal-to-noise ratio. Indeed, the ratio of fluorescence intensities at 695 and 555 nm (I695/I555) was observed to increase linearly with increasing HS− concentrations in the range of 0–30 μM (Fig. 2). The results of this varying concentration investigation reveal that minimum 1 μM concentration of H2S can be readily detected using the new probe.
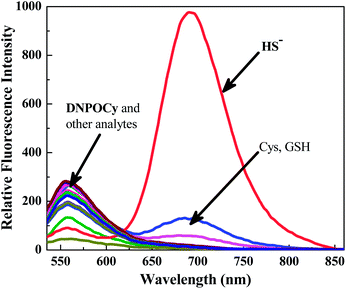 | ||
| Fig. 1 Fluorescence responses (λex = 510 nm) of DNPOCy (10 μM, in PBS buffer, pH = 7.4) 2 min following mixing with different analytes. | ||
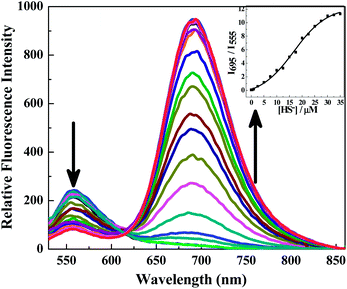 | ||
| Fig. 2 Ratiometric fluorescence responses (λex = 510 nm) of DNPOCy (10 μM, in PBS buffer, pH = 7.4) to increasing concentrations of HS− from 0 to 30 μM after 2 min of mixing. | ||
It is significant that similar color and fluorescence changes do not occur when 1 mM concentrations of various anions (Cl−, Br−, I−, AcO−, N3−, CN−, CO32−, NO2−) and metal cations (K+, Mg2+, Ca2+, Zn2+), and 5 equivalents of the reactive oxygen species H2O2, OCl− and reducing agents ascorbic acid, S2O32−, SO32− are added to solutions of DNPOCy in PBS buffer (Fig. 1 and S1, ESI†) Moreover, addition of 1 mM GSH or Cys to DNPOCy promotes only minimal color and fluorescence changes. Importantly, solutions containing DNPOCy along with either GSH or Cys undergo significant ratiometric responses upon addition of NaSH (Fig. S3, ESI†). The combined results demonstrate that DNPOCy displays a high selectivity for H2S over other biologically relevant species including biothiols and that its response to NaSH is not interfered with by other thiols. Because DNPOCy reacts efficiently with H2S in the biologically relevant pH range of 6.5–8.5 to form the NIR emitting Cy-quinone dye (Fig. S4, ESI†), this probe is very convenient for monitoring H2S without interference from the pH dependent effects of physiological media.
The HS− induced transformation of DNPOCy to Cy-quinone was confirmed by using mass spectrometry (Fig. S6, ESI†). Analysis of the mass spectrum of the product mixture shows that peaks at m/z = 705 (C38H43N2O7S2 + H+) corresponding to Cy-quinone and at m/z = 224.0 (C6H4N2O4S + Na+ + H+) corresponding to the 2,4-dinitrothiophenol are generated when HS− is added to DNPOCy.
Theoretical study
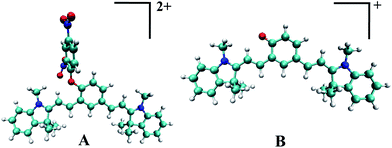
A theoretical study was carried out for the microscopic understanding of the expected excitation and emission spectra as described above. In our calculation the structure of DNPOCy and Cy-quinone were simplified with the model compound A and B in which alkyl sulfonate side chains were replaced by methyl groups. Optimized ground state structures of A and B (Fig. 3) were determined using ab initio density functional theory (DFT) calculations and their excitation and emission properties were calculated using time-dependent density functional theory (TDDFT) as implemented in Gaussian 09 package (for reference see the ESI†). For DFT and TDDFT calculations, a B3LYP31–33 exchange and correlation functional with 6-31g(d) basis set was used. By using optimized ground state (S0) geometries and TDDFT calculations, the excitation energies and oscillator strengths corresponding to lowest singlet excited states of A and B states were determined (Table 1). Maxima in the emission spectrum of A, calculated using optimized first excited state (S1) geometries and TDDFT calculations, were found to be 458 nm and 503 nm, respectively. In addition, the excitation and emission maxima for B were determined to be the same as those reported earlier.21 In agreement with the experimental results, A has higher energy absorption and emission transitions than does B owing to a larger HOMO–LUMO gap in the former (2.96 eV) compared to the latter (2.30 eV) (Fig. S10, ESI†). Importantly, the results of calculations with A and B match the experimental finding in that they show that DNPOCy should emit in the visible region while Cy-quinone should fluoresce in the NIR region.| Compound | Excitation energy (nm) S0 → S1 | Oscillator strength (excitation) | Emission energy (nm) S1 → S0 | Oscillator strength (emission) |
|---|---|---|---|---|
| A | 458.55 | 0.71 | 503.72 | 1.53 |
| B | 562.81 | 1.53 | 629.08 | 1.02 |
Live cell imaging
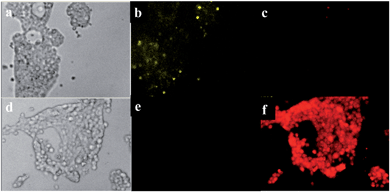
Finally, the use of DNPOCy in conjunction with fluorescence microscopy to track H2S ratiometrically inside living cells was explored (Fig. 4). For this purpose, HEK293T cells were incubated with 10 μM of DNPOCy. The cytoplasm of the cells was observed to display green fluorescence. However, treatment of the DNPOCy loaded cells with HS− (20 μM) followed by incubation for 30 min resulted in a change in color of the light emitted from the cytoplasm from green to red. These results indicate that DNPOCy is cell membrane permeable and that it can be employed as a ratiometric fluorescence imaging agent for the detection of H2S in live cells.Conclusion
The investigation described above has led to the development of a highly sensitive ratiometric NIR fluorescence and colorimetric probe, DNPOCy, for H2S. DNPOCy reacts rapidly with H2S in an aqueous medium to release the blue cyanine dye, Cy-quinone, which displays NIR emission. The results of theoretical calculations corroborate the experimentally observed changes in the emission properties associated with the H2S promoted reaction. Furthermore, this effort demonstrates that DNPOCy serves as a non-invasive probe for ratiometric fluorescence imaging of H2S, in living cells. These findings should motivate the development of new ratiometric NIR fluorescence probes for other biologically important small molecules.Experimental section
Materials and instruments
All the solvents and reagents were obtained from Sigma-Aldrich and used as received unless otherwise mentioned. 1H and 13C NMR were recorded on a Bruker AV-400 spectrometer with chemical shifts reported as ppm (in DMSO-d6, tetramethylsilane as internal standard). Mass spectra were obtained on Shimadzu 2020 LC-MS. Elemental analysis was carried out on Thermo Scientific FLASH 2000 Organic Element Analyzer. UV/Vis spectra were recorded on a Perkin Elmer Lambda 900 spectrophotometer and fluorescence spectra were recorded on a Perkin Elmer LS 55 spectrophotometer. High-resolution mass spectra were obtained on UHD Accurate-Mass Q-TOF LC/MS.Live cell imaging experiments
HEK293 cells were seeded in coverslip bottom dishes and allowed to grow till 60% confluency. Subsequently, the monolayers were treated with 10 μM of DNPOCy for 2 h. Post treatment the monolayers were washed twice with 1× PBS and then imaging was performed with Axioscope (Carl Zeiss) Meta fluorescent microscope in the yellow/CFP/540 nm and red/RFP/630 nm filter. The same culture dishes were further incubated in the presence of 20 μM of NaSH for 30 min and then the images were captured after washing with 1× PBS using fluorescent microscope as mentioned earlier.Acknowledgements
We thank Prof. C. N. R. Rao, FRS for constant support, JNCASR and CSIR [02(0128)/13/EMR-II], India for a research grant, and awarding SRF to D. M., D. K. and P. K. S.Notes and references
- E. Blackstone, M. Morrison and M. B. Roth, Science, 2005, 308, 518 CrossRef CAS PubMed.
- V. S. Lin and C. J. Chang, Curr. Opin. Chem. Biol., 2012, 16, 595 CrossRef CAS PubMed.
- K. Eto, T. Asada, K. Arima, T. Makifuchi and H. Kimura, Biochem. Biophys. Res. Commun., 2002, 293, 1485 CrossRef CAS.
- P. Kamoun, M.-C. Belardinelli, A. Chabli, K. Lallouchi and B. Chadefaux-Vekemans, Am. J. Med. Genet., Part A, 2003, 116, 310 CrossRef PubMed.
- W. Yang, G. Yang, X. Jia, L. Wu and R. Wang, J. Physiol., 2005, 569, 519 CrossRef CAS PubMed.
- S. Fiorucci, E. Antonelli, A. Mencarelli, S. Orlandi, B. Renga, G. Rizzo, E. Distrutti, V. Shah and A. Morelli, Hepatology, 2005, 42, 539 CrossRef CAS PubMed.
- Y. Kaneko, Y. Kimura, H. Kimura and I. Niki, Diabetes, 2006, 55, 1391 CrossRef CAS PubMed.
- A. R. Lippert, E. J. New and C. J. Chang, J. Am. Chem. Soc., 2011, 133, 10078 CrossRef CAS PubMed.
- H. Peng, Y. Cheng, C. Dai, A. L. King, B. L. Predmore, D. J. Lefer and B. Wang, Angew. Chem., Int. Ed., 2011, 50, 9672 CrossRef CAS PubMed.
- C. Liu, J. Pan, S. Li, Y. Zhao, L. Y. Wu, C. E. Berkman, A. R. Whorton and M. Xian, Angew. Chem., Int. Ed., 2011, 50, 10327 CrossRef CAS PubMed.
- K. Sasakura, K. Hanaoka, N. Shibuya, Y. Mikami, Y. Kimura, T. Komatsu, T. Ueno, T. Terai, H. Kimura and T. Nagano, J. Am. Chem. Soc., 2011, 133, 18003 CrossRef CAS PubMed.
- Y. Qian, J. Karpus, O. Kabil, S.-Y. Zhang, H.-L. Zhu, R. Banerjee, J. Zhao and C. He, Nat. Commun., 2011, 11, 495 Search PubMed.
- F. Yu, P. Li, P. Song, B. Wang, J. Zhao and K. Han, Chem. Commun., 2012, 48, 2852 RSC.
- C. Liu, B. Peng, S. Li, C.-M. Park, A. R. Whorton and M. Xian, Org. Lett., 2012, 14, 2184 CrossRef CAS PubMed.
- L. A. Montoya and M. D. Pluth, Chem. Commun., 2012, 48, 4767 RSC.
- S. Chen, Z.-J. Chen, W. Ren and H.-W. Ai, J. Am. Chem. Soc., 2012, 134, 9589 CrossRef CAS PubMed.
- W. Xuan, R. Pan, Y. Cao, K. Liu and W. Wang, Chem. Commun., 2012, 48, 10669 RSC.
- K. Zheng, W. Lin and L. Tan, Org. Biomol. Chem., 2012, 10, 9683 CAS.
- N. Karton-Lifshin, E. Segal, L. Omer, M. Portnoy, R. Satchi-Fainaro and D. Shabat, J. Am. Chem. Soc., 2011, 133, 10960 CrossRef CAS PubMed.
- D. Maity and T. Govindaraju, Org. Biomol. Chem., 2013, 11, 2098 CAS.
- N. Karton-Lifshin, L. Albertazzi, M. Bendikov, P. S. Baran and D. Shabat, J. Am. Chem. Soc., 2012, 134, 20412 CrossRef CAS PubMed.
- J. Han, M. S. Han and C.-H. Tung, Mol. BioSyst., 2013, 9, 3001 RSC.
- Y. Shi, S. Zhang and X. Zhang, Analyst, 2013, 138, 1952 RSC.
- O. Redy-Keisar, E. Kisin-Finfer, S. Ferber, R. Satchi-Fainaro and D. Shabat, Nat. Protoc., 2014, 1, 27 Search PubMed.
- Y. Chen, C. Zhu, Z. Yang, J. Chen, Y. He, Y. Jiao, W. He, L. Qiu, J. Cen and Z. Guo, Angew. Chem., Int. Ed., 2013, 52, 1688 CrossRef CAS PubMed.
- S. K. Bae, C. H. Heo, D. J. Choi, D. Sen, E.-H. Joe, B. R. Cho and H. M. Kim, J. Am. Chem. Soc., 2013, 135, 9915 CrossRef CAS PubMed.
- L. A. Montoya, T. F. Pearce, R. J. Hansen, L. N. Zakharov and M. D. Pluth, J. Org. Chem., 2013, 78, 6550 CrossRef CAS PubMed.
- J. Liu, Y.-Q. Sun, J. Zhang, T. Yang, J. Cao, L. Zhang and W. Guo, Chem.–Eur. J., 2013, 19, 4717 CrossRef CAS PubMed.
- X. Cao, W. Lin, K. Zheng and L. He, Chem. Commun., 2012, 48, 10529 RSC.
- T. Liu, Z. Xu, D. Spring and R. J. Cui, Org. Lett., 2013, 15, 2310 CrossRef CAS PubMed.
- C. T. Lee, W. T. Yang and R. G. Parr, Phys. Rev. B: Condens. Matter Mater. Phys., 1988, 37, 785 CrossRef CAS.
- B. Miehlich, A. Savin, H. Stoll and H. Preuss, Chem. Phys. Lett., 1989, 157, 200 CrossRef CAS.
- A. D. Becke, J. Chem. Phys., 1993, 98, 5648 CrossRef CAS PubMed.
Footnote |
| † Electronic supplementary information (ESI) available: Characterization, additional absorption, fluorescence pH and theoretical data, HPLC and mass analysis, and spectroscopic data. See DOI: 10.1039/c4ra00401a |
| This journal is © The Royal Society of Chemistry 2014 |

