DOI:
10.1039/C4RA00348A
(Paper)
RSC Adv., 2014,
4, 15740-15748
Melting temperatures deduced from molar volumes: a consequence of the combination of enthalpy/entropy compensation with linear cohesive free-energy densities†
Received
13th January 2014
, Accepted 18th March 2014
First published on 31st March 2014
Abstract
Enthalpy/entropy compensation is a general issue of intermolecular binding processes when the interaction between the partners can be roughly modelled with a single harmonic potential. Whereas linear H/S correlations are wished for by experimentalists, and often graphically justified, no inflexible law of thermodynamics supports the latter statement. On the contrary, the non-directional Ford's approach suggests logarithmic H/S relationships, which can be linearized only over narrow enthalpy/entropy ranges. Predictions covering larger domains require mathematical mapping obeying specific boundary conditions which are not compatible with linear plots. The analysis of solvent-free melting processes operating in six different classes of organic and inorganic materials shows that reciprocal Hill plots are acceptable functions for correlating melting enthalpies and entropies. The combination of H/S compensation with the observed linear dependence of the cohesive free energy densities with respect to the melting temperature eventually provides an unprecedented interdependence between melting temperatures and molar volumes. This procedure is exploited for the prediction of melting temperatures in substituted cyanobiphenyls.
Introduction
A rational control and programming of the various contributions to the changes in standard thermodynamic free energy ΔG0asso, enthalpy ΔH0asso and entropy ΔS0asso of association accompanying the binding process depicted in eqn (1) is at the heart of self-assemblies occurring in biology,1 in physics2 and in chemistry3 (‖ refers to the activities of various partners).| |
 | (1) |
Beyond the theoretically justified Gibbs free energy relationship (eqn (1), right-hand side),4 the simple modelling of the interaction operating between the partners in the [AB] pair by using a harmonic potential (i.e. a spring) suggests that the stronger the binding energy (measured as the potential well depth umin ∝ ΔH0asso), the larger its force constant κ (measured as its mean vibrational frequency  where mr is the reduced mass of the harmonic oscillator).5 Consequently, enthalpy and entropy changes are usually correlated for a simple intermolecular binding event with a propensity for compensation, i.e. ΔS0asso and ΔH0asso concomitantly decrease or increase.6 Recurrent, but empirical observations collected from series of association processes investigated in biology, in physics and in chemistry show that minor structural perturbations of the two partners lead to apparent linear correlations (eqn (2), left-hand side). The slope α of the ΔHi versus ΔSi plot has Kelvin units and is often referred to as the compensation temperature Tcomp, i.e. the temperature at which all association processes i within a homogeneous series display the same compensation free energy change ΔGcomp = γ (eqn (2), center). Its re-writing at the right-hand side of eqn (2) is reminiscent of the Gibbs relationship, which may explain the rather common belief in the statement that linear enthalpy/entropy compensation corresponds to a ‘fourth law’ of thermodynamics.6,7
| | |
ΔHi = αΔSi + γ = TcompΔSi + ΔGcomp ⇒ ΔGcomp = ΔHi − TcompΔSi
| (2) |
Theoretical approaches based on statistical thermodynamics include both attempts to refute the relevance of enthalpy–entropy correlation,8 as well as to establish its signature as the result of (i) minor perturbations of equilibrium constants,9 (ii) partition functions governed by a Gaussian density of states6b or (iii) underlying hidden thermodynamic processes.6c In 2005, Ford derived a non-quantum justification (see next section) claiming that enthalpy/entropy compensation (Tcomp > 0 in eqn (2)) occurs when the minimum host–guest separation r0 in the [AB]i pairs remains constant within a series of intermolecular binding events.10 However, the linearity proposed in eqn (2) does not result from Ford's model,6d and alternative physical justifications for parabolic5a,11 or rectangular-hyperbolic12 correlation for H/S compensation have been proposed. In this context, Liu and Guo documented that the general emergence of linear H/S compensation is often the consequence of statistical and mathematical artefacts arising from the data analysis.6a The dimerization process depicted in Fig. 1a illustrates this statement since the convincing linear relationship found for H/S compensation (Fig. 1b) is significantly discredited when one considers the alternative, but equivalent van't Hoff plots which should cross at a common 〈Tcomp; ΔGcomp〉 couple (red rectangle in Fig. 1c).13
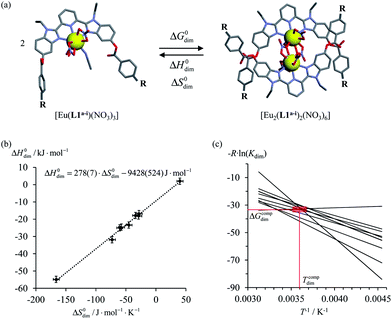 |
| | Fig. 1 (a) Schematic dimerization of complexes [Eu(L1a−i)(NO3)3] occurring in dichloromethane, (b) associated “linear” ΔH0dim vs. ΔS0dim plots and (c) individual van't Hoff ΔGdim/T vs. T−1 plots for nine different R substituents.13 | |
Since complexation processes occurring in dilute solutions are complicated by unavoidable solvation changes,11,14 which may induce additional H/S compensation phenomenon,15 we resorted to the melting of solids into isotropic liquid conducted in absence of solvents or of additives for getting a rough estimation of the strength of the intermolecular interactions occurring in a solid.16 These processes can be idealized as reversible nth order chemical reactions, in which n identical monomeric units A associate into fully assembled entities An (eqn (3)).17
| |
 | (3) |
At the melting temperature T = Tm, the solid–liquid phase equilibrium implies that ΔGasso = ΔGm = 0 and Tm = ΔH0m/ΔS0m = ΔH0asso/ΔS0asso = ΔHm/ΔSm when one reasonably assumes that the melting enthalpies ΔHm and entropies ΔSm operating at the melting temperatures are satisfyingly estimated by those defined in the standard conditions (i.e. ΔHm ≈ ΔH0m and ΔSm ≈ ΔS0m).17 Expressed at a common reference temperature T0, each melting process is further characterized by its specific standard free energy change ΔG0m = ΔH0m − T0ΔS0m ≈ ΔHm − T0ΔSm, which is further used to compute the standard cohesive free energy density CFED = ΔG0m/Vmol (Vmol is the molar volume),18 a parameter estimating the average cohesive forces operating in the solid.19 Interestingly, CFED were found to be linearly correlated with the melting temperatures for series of association/dissociation processes obeying H/S compensation (Fig. 2a),17 a phenomenon at the origin of the use of molar volumes for predicting the melting temperatures of linear alkanes (Fig. 2b).17 However, the exclusive consideration of linear H/S correlations limits this predictive model to the exploration of narrow domains of melting temperatures.17
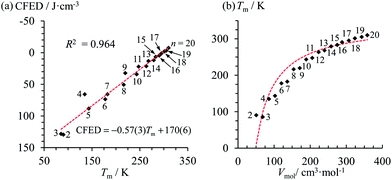 |
| | Fig. 2 Plots of (a) the cohesive free energy densities (CFED) versus the melting temperature (Tm) and (b) the melting temperature (Tm) versus the molar volumes (Vmol) for saturated linear hydrocarbons CnH2n+2 (n = 2–20). The dotted red traces show the theoretical curves. Adapted from ref. 17. | |
Theoretical background
Following the formalism of molecular association proposed by Luo and Sharp,20 the equilibrium constant KA,Basso associated with the simple binding event shown in eqn (1) can be written as eqn (4), where cθ is the standard concentration of the reference state (fixed to 1 M in this contribution),21 H(r, Ω) is a bonding function depending on the separation (r) and orientation (Ω) of the two partners in the [AB] pair (H(r, Ω) = 1 when the complex [AB] exists and H(r, Ω) = 0 otherwise), β = (kbT)−1 stands for the thermal factor and ω(r, Ω) is the potential mean force between A and B.10| |
 | (4) |
Solving eqn (4) within the frame of the van't Hoff isotherm for a non-directional harmonic potential ω(r, Ω) = uA,Bmin + (κA,B/2)r2 operating between A and B, whereby uA,Bmin is the minimum potential energy and κA,B is the force constant, leads to eqn (5) and (6), where NAv is Avogadro number.10
| |
 | (5) |
| |
 | (6) |
Interestingly, the enthalpy change ΔHA,Basso mainly depends on the magnitude of the interaction energy uA,Bmin, while the entropy change ΔSA,Basso is controlled by the force constant κA,B, the latter term being an estimation of the capacity of the bound system to gain residual degrees of freedom. The development of the harmonic potential at the minimum of a standard Lennard-Jones potential VL-J shows that the absolute minimum energy of the attractive well depth corresponds to uA,Bmin when the equilibrium A⋯B separation amounts to 21/6r0 (r0 is the critical intermolecular A⋯B distance at which the interaction potential is zero: VL-J(r = r0) = 0, see Fig. S1 in the ESI†).6d Consequently, the total energy of the harmonic oscillator for the special motion amplitude (21/6r0 − r0) exactly corresponds to the well depth uA,Bmin and eqn (7) results.6d
| |
 | (7) |
For a minor structural perturbation affecting a series of A and B partners, the minimum contact distance r0 is constant within the resulting [AB] pairs and Ford's model (eqn (7), right-hand side) predicts that the force constants κA,B (which affects the entropy changes, eqn (6)) are linearly correlated with the potential well depths uA,Bmin (which measures the enthalpy change, eqn (5)). Since the coefficient f = 2/(1 − 21/6)2(r0)2 is positive, a larger cohesive energy between A and B in the [AB] pair (i.e. uA,Bmin and ΔHA,Basso become more negative) produces an increase in the force constant κA,B, hence in the mean vibrational frequency in the deeper potential.6d,10 Since ΔSA,Basso/NAv ∝ −3/2![[thin space (1/6-em)]](https://www.rsc.org/images/entities/char_2009.gif) ln[κA,B] in eqn (6), larger κA,B induces more negative association entropies and H/S compensation occurs. This model is nothing but the Einstein model for crystals,16,18b,22 from which Lindemann postulated that the melting of a solid occurs when the amplitude of the atomic thermal vibrations reaches some critical fraction of the equilibrium lattice spacing.23 Introducing eqn (7) into eqn (5) provides a simple correlation between the enthalpy change of the association process and the force constant in the bound state (eqn (8); R = kbNAv is the ideal gas constant). Further introduction into eqn (6) gives the searched (logarithmic) dependence between ΔHA,Basso and ΔSA,Basso (eqn (9)).6d
ln[κA,B] in eqn (6), larger κA,B induces more negative association entropies and H/S compensation occurs. This model is nothing but the Einstein model for crystals,16,18b,22 from which Lindemann postulated that the melting of a solid occurs when the amplitude of the atomic thermal vibrations reaches some critical fraction of the equilibrium lattice spacing.23 Introducing eqn (7) into eqn (5) provides a simple correlation between the enthalpy change of the association process and the force constant in the bound state (eqn (8); R = kbNAv is the ideal gas constant). Further introduction into eqn (6) gives the searched (logarithmic) dependence between ΔHA,Basso and ΔSA,Basso (eqn (9)).6d
| |
 | (8) |
| |
 | (9) |
Its application to the melting of the An assembly shown in eqn (3) requires ΔHm = −ΔHasso and ΔSm = −ΔSasso, and eqn (10) eventually results
| |
 | (10) |
Applied to the melting of a series of similar compounds,17 the force constant κA,B can be approximated by a first-order Taylor series around its average magnitude κA,B0, and  in eqn (10) can be replaced with
  , where ΔHm,0 is the average melting enthalpy in the series.6d However, the rapid divergence of the logarithmic function from a linear approximation restricts the use of linear H/S compensation within this model to a narrow thermodynamic range of melting processes. In this contribution, we propose to improve the predictive capacity of the latter thermodynamic model via a thorough investigation of the melting processes occurring in metals, in various organic compounds and in inorganic oxides.
Results and discussion
Modelling H/S compensation
Thanks to Yaws' efforts for gathering melting enthalpies and entropies (Fig. 3),24 we were able to select six families of compounds, linear alkanes (Table S1†), linear alkanoic acids (Table S2†), organosilanes (Table S3†), lanthanide metals (Table S4†), transition metals (Table S5†) and transition metal oxides (Table S6†), for which (i) the internal cohesion forces result from various types of intermolecular interactions (permanent and/or induced electric multipolar, H-bonds, covalency) and (ii) the melting temperatures span a broad domain. Assuming the justified approximation that ΔHm and ΔSm are essentially constant over a reasonable temperature range around a reference temperature T0 taken as the average melting temperature within each series (Tables S1–S6 in the ESI†),17 the experimental ΔSm versus ΔHm plots of the six individual series were fitted with Ford's model by tuning f in eqn (10), but only a poor match results (magenta trace in Fig. 4 for linear alkanes and in Fig. S2–S6 for the five other series in the ESI†).
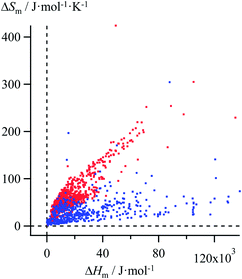 |
| | Fig. 3 Plot of melting entropies ΔSm versus melting enthalpies ΔHm for 764 randomly selected organic compounds (red markers) and 230 inorganic compounds (blue markers).24 | |
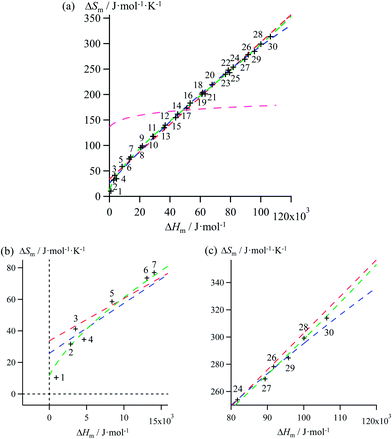 |
| | Fig. 4 (a) Full representation, (b) low enthalpy inset and (c) high enthalpy inset for plots of melting entropies ΔSm versus melting enthalpies ΔHm in linear alkanes CnH2n+2 (n = 1–30) and fitted unconstrained correlations using (i) Ford's approach (eqn (10), magenta trace), (ii) a linear H/S function (red trace), (iii) a parabolic H/S function (blue trace) or (iv) a reciprocal Hill plot (green trace). | |
Mathematically speaking, the fitting process is logically improved by the stepwise consideration of additional tuneable parameters according to the following order: Ford's model (eqn (10), one tuneable parameter, magenta traces) < linear fits (ΔSm = a + bΔHm, two tuneable parameters, red traces) < parabolic fits (ΔSm = a + bΔHm + c(ΔHm)2, three tuneable parameters, blue traces) < reciprocal Hill fits (ΔSm = a[(ΔHm − b)/(ΔHm + c)]d, four tuneable parameters, green traces; Fig. 4 and S2–S6 and Tables 1 and S7–S11)†. The use of linear and parabolic fits is reminiscent of the use of first-order, respectively second-order Taylor polynomials for approaching eqn (10).17 Higher-order Taylor series are precluded by the well-known Runge's phenomenon, which strongly limits the approximation of logarithmic mapping by using power polynomials of increasing orders.25 On the contrary, the use of a Hill function has no mathematical justification for fitting logarithmic plots, but its stability over a large enthalpy range appeared to be a considerable advantage for fitting H/S compensation (vide infra). A simple look at Fig. 3 indicates that ΔSm → 0 when ΔHm → 0 for melting processes recorded at normal pressure (in other words, the melting temperature Tm = ΔHm/ΔSm does not diverge for ΔSm → 0),26 a boundary condition which is not satisfied by the fitting traces collected in Fig. 4 and S2–S6 (ESI†). Including the latter constraint into H/S compensation results in the loss of one degree of freedom by fixing one parameter during the fitting process (Tables 1 and S7–S11,† column 1). Consequently, Ford's approach lacks of acceptable correlation (magenta traces in Fig. 5 and S7–S11,† no tuneable parameter), while linear approximations (red traces in Fig. 5 and S7–S11,† one tuneable parameter, ΔSm = bΔHm) are dismissed because only a single melting temperature Tm = b−1 is tolerated along the complete series of compounds.
Table 1 Entropy–enthalpy correlations fitted for linear alkanes CnH2n+2 (n = 1–30)a
| Function |
f/m−2 |
a |
b |
c |
d |
| Units used for polynomial fits: a/J mol−1 K−1, b/K−1 and c/J−1 mol K−1. Units used for reciprocal Hill fits: a/J mol−1 K−1, b and c in J mol−1. |
| Unconstrained |
| Eqn (10) |
6(7) × 105 |
— |
— |
— |
— |
| ΔSm = a + bΔHm |
— |
33(2) |
2.69(4) × 10−3 |
— |
— |
| ΔSm = a + bΔHm + c(ΔHm)2 |
— |
26(2) |
3.2(1) × 10−3 |
−5(1) × 10−9 |
— |
| ΔSm = a[(ΔHm − b)/(c − ΔHm)]d |
— |
4.9(8) × 102 |
−7(8) × 102 |
3.3(5) × 105 |
6.2(3) × 10−1 |
| |
| Constrained: ΔSm → 0 when ΔHm → 0 |
| Eqn (10) |
11.39 |
— |
— |
— |
— |
| ΔSm = a + bΔHm |
— |
0 |
3.17(6) × 10−3 |
— |
— |
| ΔSm = a + bΔHm + c(ΔHm)2 |
— |
0 |
4.2(2) × 10−3 |
−1.3(2) × 10−8 |
— |
| ΔSm = a[(ΔHm − b)/(c − ΔHm)]d |
— |
4.5(4) × 102 |
0 |
3.0(3) × 105 |
5.9(2) × 10−1 |
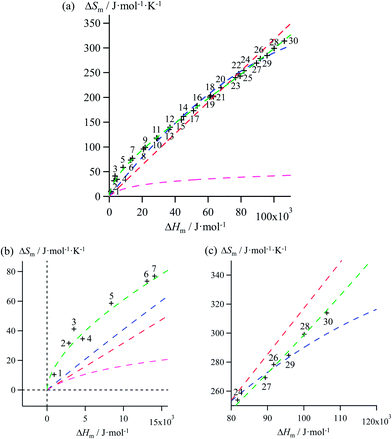 |
| | Fig. 5 (a) Full representation, (b) low enthalpy inset and (c) high enthalpy inset for plots of melting entropies ΔSm versus melting enthalpies ΔHm in linear alkanes CnH2n+2 (n = 1–30) and fitted constrained correlations including ΔSm → 0 when ΔHm → 0 and using (i) Ford's approach (eqn (10), magenta trace), (ii) a linear H/S function (red trace), (iii) a parabolic H/S function (blue trace) or (iv) a reciprocal Hill plot (green trace). | |
Therefore, among the four mathematical functions selected for extending the logarithmic H/S dependence suggested by the simple Ford's model, only parabolic (blue traces, two tuneable parameters) and Hill (green traces, three tuneable parameters) plots provide satisfying fitted traces compatible with the inclusion of the extra boundary condition ΔSm → 0 when ΔHm → 0 (Fig. 5 and S7–S11, Tables 1 and S7–S11, ESI†).6a
Cohesive free energy densities and three-dimensional ΔHm, ΔSm, Vmol plots
Taking Trouton's rule into account for the vaporization of liquids,27 Hildebrand introduced the concept of cohesion energy density CED = (ΔHv − RT)/Vmol for estimating the average cohesive forces operating within liquids and for predicting their vaporization temperatures (ΔHv is the vaporization enthalpy).19 In absence of valuable alternative to Trouton's rule fixing the melting entropy in solids,18 we have resorted to standard melting Gibbs free energy ΔG0m = ΔHm − T0ΔSm computed at a reference temperature T0 for estimating the standard cohesive free energy densities CFED = ΔG0m/Vmol along each homogeneous series of compounds (Tables S1–S6, ESI†). We are aware that the melting enthalpies (ΔHm) and entropies (ΔSm) are indeed collected at different temperatures for each compound (i.e. at Tm) but their dependence on temperature is limited,17 and the choice of a reference temperature T0 around the center of each series obeying H/S compensation is thus acceptable for computing ΔG0m. The experimental linear correlations observed between CFED and the associated melting temperatures Tm in Fig. 6 provide eqn (11), which interconnects ΔHm, ΔSm and Vmol within each series (note that Tm = ΔHm/ΔSm)| |
 | (11) |
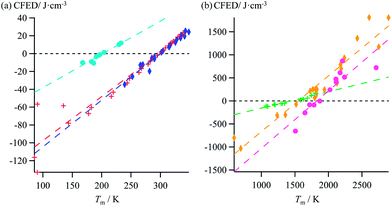 |
| | Fig. 6 Plots of standard cohesion free energy densities (CFED) versus the melting temperature (Tm) for (a) linear alkanes (red trace), linear alkanoic acids (dark blue trace) and organosilanes (light blue trace), and (b) lanthanide metals (green trace), transition metals (orange trace) and transition metal oxides (magenta trace). | |
Taken separately, eqn (11) is of limited interest for tuning melting temperatures by molecular design since only the molar volume Vmol can be easily computed for unknown compounds,28 while satisfying estimations and/or modelling of melting entropies or enthalpies are difficult.29 However, the consideration of H/S compensations operating in each series (Fig. 5 and S7–S11, ESI†) provides a correlation ΔSm = gi(ΔHm) which can be introduced into eqn (11) to give eqn (12) when one reminds that Tm = ΔHm/ΔSm = ΔHm/gi(ΔHm) (gi represents either a parabolic or a reciprocal Hill function).
| | |
gi(ΔHm)[ΔHm − T0gi(ΔHm) − Vmolμ] − λVmolΔHm = 0
| (12) |
For quadratic fits, ΔSm = gquadra(ΔHm) = bΔHm + c(ΔHm)2 and eqn (12) corresponds to a polynomial, which can be solved to give an estimation of the melting enthalpy ΔHm as soon as the molar volumes Vmol of a target compound belonging to the series is at hand. The associated melting entropy ΔSm immediately results from H/S correlation. The same procedure holds when using reciprocal Hill fits characterized by ΔSm = gHill(ΔHm) = a[ΔHm/(ΔHm + c)]d. The quality of the correlations can be estimated in the three-dimensional Vmol, ΔHm, ΔSm plots for each series (Fig. 7 and S12–S16, ESI†).
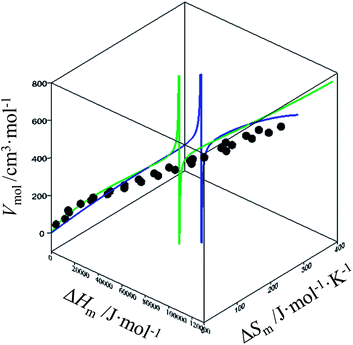 |
| | Fig. 7 Three-dimensional Vmol, ΔHm, ΔSm plot for linear alkanes fitted with a parabolic H/S function (blue trace) or a reciprocal Hill plots (green trace). An asymptotic behaviour is expected to occur when the melting temperature approaches the selected reference temperature T0 = 298.15 K. | |
As an ultimate step, the combination of melting enthalpies and entropies into the melting temperatures Tm = ΔHm/ΔSm reduces the dimension of the correlation shown in Fig. 7 to give an easy-manageable Tm versus Vmol plot (Fig. 8 and S17–S21, ESI†). The careful inspection of the latter two-dimensional plots indicate that, for any series under investigation, reciprocal Hill functions provide the best fits.
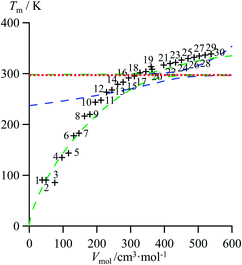 |
| | Fig. 8 Correlations between molar volumes Vmol and melting temperatures Tm for linear alkanes CnH2n+2 (n = 1–30) fitted using a parabolic H/S function (blue trace) or a reciprocal Hill plots (green trace). The horizontal dotted red trace corresponds to the asymptotical behaviour occurring when the melting temperature approaches the selected reference temperature T0 = 298.15 K. | |
Combination of H/S compensation with linear cohesive free energy densities (CFED) for predicting the melting temperatures of substituted lipophilic cyanobiphenyls
Lipophilic cyanobiphenyls with variable lengths (n-CB) and substitutions (12Mem-CB) have been considered as precursors for inducing liquid crystalline mesophases (Fig. 9a, Table S12, ESI†).17 Both constrained quadratic and reciprocal Hill correlations satisfyingly model H/S compensation along the cyanobiphenyl series (Fig. 9b), which further displays a linear CFED versus Tm plot according to eqn (11) (Fig. 9c). The three-dimensional Vmol, ΔHm, ΔSm plot fitted with eqn (12) confirms the comparable quality of quadratic (blue trace) or Hill (green trace) functions (Fig. 9d). However, the trends predicted beyond the range of available experimental data significantly differ for the quadratic (blue trace) and Hill (green trace) plots, a feature highlighted in the reduced two-dimensional Tm versus Vmol plot (Fig. 10).30
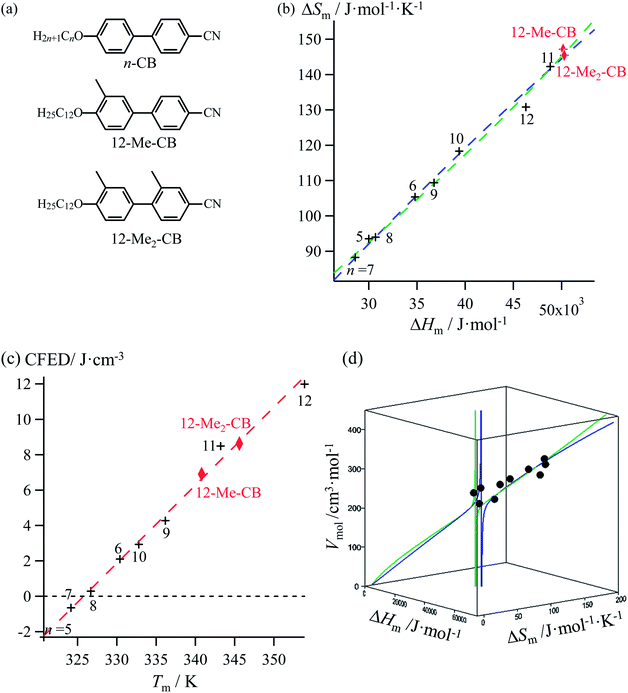 |
| | Fig. 9 (a) Chemical structures of substituted cyanobiphenyls with associated plots corresponding to (b) melting entropy versus melting enthalpy changes, (c) cohesion free energy densities (CFED) versus the melting temperature (Tm) and (d) three-dimensional Vmol, versus ΔHm and ΔSm fitted with a parabolic H/S function (blue trace) or a reciprocal Hill function (green trace). Reference temperature T0 = 325.92 K. | |
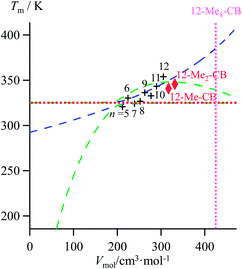 |
| | Fig. 10 Correlations between molar volumes Vmol and melting temperatures Tm for substituted lipophilic cyanobiphenyls fitted using a parabolic H/S function (blue trace) or a reciprocal Hill plots (green trace). The horizontal dotted red trace corresponds to the asymptotical behaviour occurring when the melting temperature approaches the selected reference temperature T0 = 325.95 K. The vertical dotted magenta trace shows the predictions obtained for the permethylated cyanobiphenyl 12-Me8-CB. | |
The ultimate step of our model offers the opportunity to predict the melting temperature for the unknown permethylated 4′-(dodecyloxy)-4-cyanobiphenyl compound (12-Me8-CB), for which a molecular volume of 688.5 Å3, hence a molar volume of Vmol = NAv × 688.5 × 10−24 = 414.2 cm3 mol−1 can be estimated.17,28 Depending on the choice of the fitting curve used for modelling H/S compensation, an increase (quadratic fit) or a stagnation (Hill fit) of the melting temperature is expected, and one can therefore predicts Tm (12-Me8-CB) = 380.5 K based on the quadratic fit and 340.7 K based on the Hill fit (Fig. 10). Since the experimental number of methyl groups bound to the cyanobiphenyl core in 12-Mem-CB is currently limited to m = 2,17 no definitive preference between quadratic and Hill predictions can be set. However, the stagnation of the melting temperature detected upon successive methylation (Tm (12-CB) ≥ Tm (12-Me-CB) ≈ Tm (12-Me2-CB) in Fig. 10) has been confirmed by the systematic preparation of all the possible regioisomers of 12-Me-CB (4 isomers, average melting temperature Tm (monomethyl-CB) = 326(11) K), and those of 12-Me2-CB (4 isomers with one methyl group connected to each aromatic group, average melting temperature Tm (dimethyl-CB) = 327(16) K).17 This trend represents a strong support in favor of the Hill plot as the best predictive tool within this novel series, in line with the previous analysis of linear alkane and alkanoic acids, organosilanes, lanthanide metals, transition metals and transition metal oxides.
Conclusion
The non-directional Ford's approach uses a single harmonic potential with a unique minimum contact distance for catching any intermolecular interaction. It predicts that, for a series of binding reactions involving structurally similar partners, the thermodynamic of association/dissociation is dominated by H/S compensation and logarithmic ΔS versus ΔH dependences are expected. Applied to the melting processes occurring in six (arbitrarily selected) sets of chemical compounds, this rough model justifies the emergence of H/S compensation, but it fails in reproducing accurate trends because the modelling of the intermolecular interactions operating in solid with the help of a single harmonic potential is a too big oversimplification. Increasing the number of degrees of freedom for approaching H/S correlations restores satisfying fits when using linear or quadratic polynomials, or reciprocal Hill functions. The inclusion of the boundary condition ΔSm → 0 when ΔHm → 0 recuses linear H/S correlations and only quadratic or Hill plots are able to give satisfying ΔSm versus ΔHm fits. Standard empirical analysis of enthalpy/entropy compensation within the frame of this simple binding thermodynamics stops at this point, and no predictive tool is at hand for estimating the strength of intermolecular interactions and for programming melting temperatures. The additional concept of standard cohesive free energy density (CFED = ΔG0m/Vmol) and its observed linear correlation with the melting temperatures (eqn (11)) introduces an unprecedented relationship between the molar volume, Vmol, a parameter accessible to supramolecular chemists and the correlated melting enthalpies and entropies. For the six different series of compounds selected in this contribution, i.e. linear alkanes, linear alkanoic acids, organosilanes, lanthanide metals, transition metals and transition metal oxides, the ultimate reduced Tm versus Vmol plots satisfyingly reproduce the experimental data. We notice that the use of reciprocal Hill plots provide the best fits for H/S correlations in melting processes, and its application for rationalizing melting temperatures recently determined for substituted cyanobiphenyls provides reasonable predictions for currently unknown compounds in the series.
Experimental
The mathematical analyses were performed by using Igor Pro® (WaveMetrics Inc.) and Excel® (Microsoft) softwares.
Acknowledgements
Financial support from the Swiss National Science Foundation is gratefully acknowledged.
References and notes
-
(a) M. Mammen, S.-K. Choi and G. M. Whitesides, Angew. Chem., Int. Ed., 1998, 37, 2754–2794 CrossRef;
(b) A. Mulder, J. Huskens and D. N. Reinhoudt, Org. Biomol. Chem., 2004, 2, 3409–3424 RSC;
(c) M. T. Rodgers and P. B. Armentrout, Acc. Chem. Res., 2004, 37, 989–998 CrossRef CAS PubMed; V. M. Krishnamurthy, B. R. Bohall, V. Semetey and G. M. Whitesides, J. Am. Chem. Soc., 2006, 128, 5802–5812 Search PubMed.
-
(a) L. Cademartiri, K. J. M. Bishop, P. W. Snyder and G. A. Ozin, Philos. Trans. R. Soc., A, 2012, 370, 2824–2847 CrossRef CAS PubMed;
(b) C.-A. Palma, M. Cecchini and P. Samori, Chem. Soc. Rev., 2012, 41, 3713–3730 RSC;
(c) J. Li, P. Nowak and O. Sijbren, J. Am. Chem. Soc., 2013, 135, 9222–9239 CrossRef CAS PubMed.
-
(a) J. D. Badjic, A. Nelson, S. J. Cantrill, W. B. Turnbull and J. F. Stoddart, Acc. Chem. Res., 2005, 38, 723–732 CrossRef CAS PubMed;
(b) H.-J. Schneider, Angew. Chem., Int. Ed., 2009, 48, 3924–3977 CrossRef CAS PubMed;
(c) C. Piguet, Chem. Commun., 2010, 46, 6209–6231 RSC;
(d) R. Chakrabarty, P. S. Mukherjee and P. J. Stang, Chem. Rev., 2011, 111, 6810–6918 CrossRef CAS PubMed.
- T. Engel and P. Reid, Physical Chemistry, Pearson Benjamin Cummings, San Francisco, 2006, pp. 113–122 Search PubMed.
-
(a) M. S. Searle, M. S. Westwell and D. H. Williams, J. Chem. Soc., Perkin Trans. 2, 1995, 141–151 RSC;
(b) C. Neal, A. Starace and M. Jarrold, Phys. Rev. B: Condens. Matter Mater. Phys., 2007, 76, 054113 CrossRef.
-
(a) L. Liu and Q.-X. Guo, Chem. Rev., 2001, 101, 673–695 CrossRef CAS PubMed;
(b) K. Sharp, Protein Sci., 2001, 10, 661–667 CrossRef CAS PubMed;
(c) E. B. Starikov and B. Norden, J. Phys. Chem. B, 2007, 111, 14431–14435 CrossRef CAS PubMed;
(d) C. Piguet, Dalton Trans., 2011, 40, 8059–8071 RSC.
-
(a) J. E. Leffler, J. Org. Chem., 1955, 20, 1202–1231 CrossRef CAS;
(b) D. H. Williams, E. Stephens, D. P. O'Brien and M. Zhou, Angew. Chem., Int. Ed., 2004, 43, 6596–6616 CrossRef CAS PubMed;
(c) D. H. Leung, R. G. Bergman and K. N. Raymond, J. Am. Chem. Soc., 2008, 130, 2798–2805 CrossRef CAS PubMed.
-
(a) R. Lumry, Methods Enzymol., 1995, 259, 628–720 CAS;
(b) A. Cornish-Bowden, J. Biosci., 2002, 27, 121–126 CrossRef PubMed.
- K. F. Freed, J. Phys. Chem. B, 2011, 115, 1689–1692 CrossRef CAS PubMed.
-
(a) D. M. Ford, J. Am. Chem. Soc., 2005, 127, 16167–16170 CrossRef CAS PubMed;
(b) D. M. Ford, Adsorption, 2005, 11, 271–277 CrossRef.
- V. S. Shaikh, S. S. Terdale, A. Ahamad, G. R. Gupta, D. H. Dagade, D. G. Hundiwale and K. J. Patil, J. Phys. Chem. B, 2013, 117, 16249–16259 CrossRef CAS PubMed.
- E. B. Starikov and B. Norden, J. Phys. Chem. B, 2009, 113, 4698–4707 CrossRef CAS PubMed.
- T. B. Jensen, E. Terazzi, K. Buchwalder, L. Guénée, H. Nozary, K. Schenk, B. Heinrich, B. Donnio, D. Guillon and C. Piguet, Inorg. Chem., 2010, 49, 8601–8619 CrossRef CAS PubMed.
-
(a) B. M. Castellano and D. K. Eggers, J. Phys. Chem. B, 2013, 117, 8180–8188 CrossRef CAS PubMed;
(b) E. Terazzi, A. Zaïm, B. Bocquet, J. Varin, L. Guénée, T. Dutronc, J.-F. Lemonnier, S. Floquet, E. Cadot, B. Heinrich, B. Donnio and C. Piguet, Eur. J. Inorg. Chem., 2013, 3323–3333 CrossRef CAS.
-
(a) E. Fisicaro, C. Compari and A. Braibanti, Phys. Chem. Chem. Phys., 2004, 6, 4156–4166 RSC;
(b) J. M. Ward, N. M. Gorenstein, J. Tian, S. F. Martin and C. B. Post, J. Am. Chem. Soc., 2010, 132, 11058–11070 CrossRef CAS PubMed;
(c) B. Breiten, M. R. Lockett, W. Sherman, S. Fujita, M. Al-Sayah, H. Lange, C. M. Bowers, A. Heroux, G. Krilov and G. M. Whitesides, J. Am. Chem. Soc., 2013, 135, 15579–15584 CrossRef CAS PubMed.
- S. Zamith, F. Chirot and J.-M. L'Hermite, Europhys. Lett., 2010, 92, 13004 CrossRef.
- T. Dutronc, E. Terazzi, L. Guénée, K.-L. Buchwalder, A. Spoerri, D. Emery, J. Mareda, S. Floquet and C. Piguet, Chem.–Eur. J., 2013, 19, 8447–8456 CrossRef CAS PubMed.
- Since Richard's rule only holds for metals, the entropies of melting for organic compounds cannot be taken as constant, and the CFED parameter is thus derived from the free energy change
(a) G. P. Tiwari, Met. Sci., 1978, 12, 317–320 CrossRef CAS;
(b) M. E. Glicksman, Principle of Solidification, Springer, New York, 2011, p. 22 Search PubMed.
-
(a) M. Dunkel, J. Phys. Chem., 1928, A138, 42–54 Search PubMed;
(b) J. H. Hildebrand and R. L. Scott, The Solubility of Nonelectrolytes, Reinhold Pub Group, New York, 3rd edn, 1950 Search PubMed;
(c) R. F. Fedors, Polym. Eng. Sci., 1974, 14, 147–154 CrossRef CAS;
(d) A. F. M. Barton, Handbook of Solubility Parameters and Other Cohesion Parameters, CRC Press, 2nd edn, 1991, p. 127 Search PubMed.
- H. B. Luo and K. Sharp, Proc. Natl. Acad. Sci. U. S. A., 2002, 99, 10399–10404 CrossRef CAS PubMed.
- D. Munro, Chem. Br., 1977, 13, 100–105 CAS.
-
(a) A. Einstein, Ann. Phys., 1907, 22, 180–190 Search PubMed;
(b) D. W. Rogers, Einstein's other Theory, the Plank–Bose–Einstein Theory of Heat Capacity, Princeton University Press, New Jersey, 2005 Search PubMed.
- F. A. Lindemann, Phys. Z., 1910, 11, 609–612 CAS.
- C. L. Yaws, Yaws Handbook of Thermodynamics and Physical Properties of Chemical Compounds, Knovel-Elsevier, Norwich New York, 2003 Search PubMed.
- C. Runge, Zeitschrift für Mathematik und Physik, 1901, 46, 224–243 Search PubMed.
- Under critical conditions of pressure, a continuous transition from crystal to melt displaying ΔSm = 0 and ΔVm = 0 whilst ΔHm ≠ 0 is theoretically justified. However, no experimental demonstration of this prediction is currently available because of the extreme pressure conditions required for the most promising candidates A. R. Ubbelohde, Melting and Crystal Structures, Clarendon Press, Oxford, 1965, pp. 19–24 Search PubMed.
- Trouton's rule states that the entropy of vaporization for any liquid is almost the same value, about 85–88 J K−1 mol−1. Consequently, the vaporization temperature entirely depends on the vaporization enthalpy. F. T. Trouton, London, Edinburgh Dublin Philos. Mag. J. Sci., 1884, 18, 54–57 CrossRef.
- The molar volumes Vmol = NAv × VConnolly × 10−24 in cm3 mol−1 are deduced from the Connolly
volumes expressed in Å3. VConnolly are obtained from the building of the Connolly surfaces around the molecular structures of the compounds observed in their crystal structures (when available) or in their gas-phase structures modelled by semi-empirical PM3 method
(a) M. L. Connolly, Science, 1983, 221, 709–713 CAS;
(b) M. L. Connolly, J. Appl. Crystallogr., 1983, 16, 548–558 CrossRef CAS;
(c) J. J. P. Stewart, J. Comput. Chem., 1989, 10, 209–220 CrossRef CAS;
(d) J. J. P. Stewart, J. Comput. Chem., 1989, 10, 221–264 CrossRef CAS.
-
(a) A. R. Katritzky, U. Maran, M. Karelson and V. S. Lobanov, J. Chem. Inf. Comput. Sci., 1997, 37, 913–919 CrossRef CAS , and references therein;
(b) Y. Tsuchiya, H. Hasegawa and T. Iwatsubo, J. Chem. Phys., 2001, 114, 2484–2488 CrossRef CAS;
(c) Y. Tsuchiya, H. Hasegawa and T. Iwatsubo, Jpn. J. Appl. Phys., Part 1, 2003, 42, 6508–6511 CrossRef CAS.
- For any cyanobiphenyl located close to the asymptote (i.e. possessing molar volumes in the 200–260 cm3 mol−1 range), a simple change of the reference temperature provides its unambiguous location on either part of the fitting curve (Fig. S22, ESI†).
Footnote |
| † Electronic supplementary information (ESI) available. See DOI: 10.1039/c4ra00348a |
|
| This journal is © The Royal Society of Chemistry 2014 |
Click here to see how this site uses Cookies. View our privacy policy here.  Open Access Article
 where mr is the reduced mass of the harmonic oscillator).5 Consequently, enthalpy and entropy changes are usually correlated for a simple intermolecular binding event with a propensity for compensation, i.e. ΔS0asso and ΔH0asso concomitantly decrease or increase.6 Recurrent, but empirical observations collected from series of association processes investigated in biology, in physics and in chemistry show that minor structural perturbations of the two partners lead to apparent linear correlations (eqn (2), left-hand side). The slope α of the ΔHi versus ΔSi plot has Kelvin units and is often referred to as the compensation temperature Tcomp, i.e. the temperature at which all association processes i within a homogeneous series display the same compensation free energy change ΔGcomp = γ (eqn (2), center). Its re-writing at the right-hand side of eqn (2) is reminiscent of the Gibbs relationship, which may explain the rather common belief in the statement that linear enthalpy/entropy compensation corresponds to a ‘fourth law’ of thermodynamics.6,7


![[thin space (1/6-em)]](https://www.rsc.org/images/entities/char_2009.gif) ln[κA,B] in eqn (6), larger κA,B induces more negative association entropies and H/S compensation occurs. This model is nothing but the Einstein model for crystals,16,18b,22 from which Lindemann postulated that the melting of a solid occurs when the amplitude of the atomic thermal vibrations reaches some critical fraction of the equilibrium lattice spacing.23 Introducing eqn (7) into eqn (5) provides a simple correlation between the enthalpy change of the association process and the force constant in the bound state (eqn (8); R = kbNAv is the ideal gas constant). Further introduction into eqn (6) gives the searched (logarithmic) dependence between ΔHA,Basso and ΔSA,Basso (eqn (9)).6d
ln[κA,B] in eqn (6), larger κA,B induces more negative association entropies and H/S compensation occurs. This model is nothing but the Einstein model for crystals,16,18b,22 from which Lindemann postulated that the melting of a solid occurs when the amplitude of the atomic thermal vibrations reaches some critical fraction of the equilibrium lattice spacing.23 Introducing eqn (7) into eqn (5) provides a simple correlation between the enthalpy change of the association process and the force constant in the bound state (eqn (8); R = kbNAv is the ideal gas constant). Further introduction into eqn (6) gives the searched (logarithmic) dependence between ΔHA,Basso and ΔSA,Basso (eqn (9)).6d


 in eqn (10) can be replaced with
  , where ΔHm,0 is the average melting enthalpy in the series.6d However, the rapid divergence of the logarithmic function from a linear approximation restricts the use of linear H/S compensation within this model to a narrow thermodynamic range of melting processes. In this contribution, we propose to improve the predictive capacity of the latter thermodynamic model via a thorough investigation of the melting processes occurring in metals, in various organic compounds and in inorganic oxides.


