DOI:
10.1039/C4RA00215F
(Paper)
RSC Adv., 2014,
4, 15458-15465
A bienzyme-immobilized highly efficient niobium oxide nanorod platform for biomedical application
Received
9th January 2014
, Accepted 5th February 2014
First published on 7th February 2014
Abstract
Electrophoretically deposited niobium oxide nanorods have been utilized to fabricate a high performance biosensor for specific cholesterol detection. The orthorhombic structure of the Nb2O5 platform has resulted in the stable and excellent characteristics of the fabricated biosensor. This biosensor has been able to detect cholesterol selectively in a wide detection range [25–500 mg dl−1] with a sensitivity of 0.267 μA/mg dl−1 cm−2 , has a re-usability of 10 times and stability for 6 months, due to the immobilization of the bienzyme onto the matrix, assisted by the intrusion in the Nb2O5 nanorods. The low Michaelis–Menten constant (0.07 mg dl−1) for the biosensor indicates a higher affinity of the bienzyme towards cholesterol. The sensor has also been validated with clinical samples.
1. Introduction
Development of miniaturized clinical diagnostic devices has been considered one of the biggest milestones of nanostructured materials.1,2 Recently, one dimensional (1-D) nanostructured metal oxides have gained much attention in the development of nanosized devices due to their tunable size known as quantum size confinement.3,4 In particular, metal oxide nanorods are widely used in the development of electrochemical biosensors due to the channeling effect leading to improved electron transfer properties.5–8 The nanorods offer large area scaffolds for the functionalization of biomolecules and can act as mediators which introduce a conduction channel for electron transport from the redox enzyme to the current collector.9 Many researchers have explored 1-D metal oxides of nickel, zinc, iron, niobium etc. for biosensor development.10,11 Thus, nanorods having conducing electron transfer and catalytic properties could be an efficient platform for clinical diagnostic applications.
Niobium oxide (Nb2O5) is known to be an n-type semiconducting material and has significant potential for various applications in electrochromism, gas sensing and field emission displays etc.12–14 Among the various polymorphs of niobium oxide, the orthorhombic form (T-Nb2O5) is a thermodynamically stable phase with high catalytic and electrochemical activity, biocompatibility and surface reactivity properties due to its intrinsic defects.15,16 In addition, the highly crystalline structure of Nb2O5 could be considered to improve charge transfer properties towards biosensing applications. In this context, the large amount of oxygen vacancies present in T-Nb2O5 may help in the proper immobilization of biomolecules. In the fabrication of an electrochemical biosensor, the electrical contact of redox enzymes with the electrodes is an important step. In this context, direct electrical communication between enzymes and active centres are blocked since these active centres are surrounded by thick insulating protein shells.17
Nb2O5 is known to overcome this problem due to its intrinsic electrochemical properties and can promote direct electron transfer from redox proteins even when the active centers are distant from the electrode surface.18 In addition, the catalytic properties of nanoparticles may perhaps influence and enhance the electrochemical sensing behaviour. You et al. have reported the role of catalytic platinum nanoparticles in a highly sensitive H2O2 sensor, while Xu et al. have described the significance of the catalytic properties of copper oxide nanoparticles in an enhanced current for electrochemical detection of amikacin.19,20 Choi et al. have developed a cost-effective and reliable device based on nanoporous niobium oxide for the label-free detection of DNA hybridization events.21 Xu et al. have used ordered mesoporous Nb2O5 as a supporting material for cytochrome-c immobilization.18 Lee et al. have fabricated a highly sensitive immunosensor based on a nanoporous Nb2O5 electrode.22 Thus, the intrinsic electrochemical and catalytic properties of Nb2O5 in combination with the excellent properties of 1D nanomaterials provides considerable scope to construct an electrochemical biosensor with improved sensing parameters.
To the best of our knowledge, we are reporting the fabrication of a biosensor based on niobium oxide nanorods for cholesterol biosensing for the first time. Fabrication of a niobium oxide nanorod based cholesterol biosensor for clinical diagnostics may provide advantages relating to the open structures in the biocompatible rods, that may act as a host for enzyme entrapment and stable attachment of the bioanalyte. Proper trapping of the enzyme in the space available on the Nb2O5 nanorod film gives increased stabilization which may enhance the stability and sensitivity of the fabricated biosensor.
Therefore, in the present manuscript, we report the results relating to the fabrication of an electrophoretically deposited Nb2O5 nanorod based biosensor that has been used to directly detect the total cholesterol level in human serum samples. The physiological level of cholesterol in healthy adults should be less than 200 mg dl−1. A high blood cholesterol level (>240 mg dl−1) is associated with atherosclerosis and causes coronary heart diseases and heart attacks, while low blood cholesterol (<80 mg dl−1) is linked with hyperthyroidism and cerebral thrombosis.23,24
2. Materials and methods
2.1 Reagents
Cholesterol oxidase (ChOx), cholesterol esterase (ChEt), cholesteryl oleate and cetyl trimethyl ammonium bromide (CTAB) were procured from Sigma-Aldrich (USA). Anhydrous niobium(V) chloride was procured from Alfa Aesar (UK). Indium tin oxide (ITO) coated glass substrates were obtained from Blazers, UK.
2.2 Fabrication of Nb2O5 nanorod based film
Niobium penta-oxide nanorods (Nb2O5NR) were prepared by the sol–gel method using CTAB as the surfactant. 5 g of niobium chloride (NbCl5) was dissolved in 10 ml of ethanol, and a clear yellow solution was obtained after stirring at room temperature. 2 ml of CTAB (0.2 M) surfactant was added drop wise into the above prepared solution, followed by an ammonia solution at pH 12.0 to get the white precipitate of (Nb2O5·nH2O). The obtained (Nb2O5·nH2O) precipitate was washed several times, initially with deionized water, followed by ethyl alcohol to reduce agglomeration and remove the soluble impurities. The separation of the liquid and solid phase was done by centrifugation at 4000 rpm for 5 min and the resultant (Nb2O5·nH2O) powder was dried at 80 °C for 12 h. The existence of different polymorphs of niobium oxide depends on the calcination temperature and the following eqn (1).25| |
 | (1) |
The (Nb2O5·nH2O) was calcinated at 750 °C for 6 h to form T-Nb2O5 nanorods, which was further confirmed using X-ray diffraction studies. Further, Nb2O5 nanorods were deposited onto ITO coated glass substrates using electrophoretic deposition (EPD). The EPD of niobium oxide nanorods (Nb2O5NR) was carried out by applying a constant anodic potential of 45 V for 1 min in the colloidal suspension of Nb2O5 nanorods in acetonitrile.
2.3 Immobilization of ChEt–ChOx
For the immobilization, 10 μl of a prepared mixture of ChEt and ChOx (ratio 1![[thin space (1/6-em)]](https://www.rsc.org/images/entities/char_2009.gif) :
:![[thin space (1/6-em)]](https://www.rsc.org/images/entities/char_2009.gif) 1, 1.0 mg ml−1, in a phosphate buffer, 50 mM, pH 7.0) was uniformly spread and kept in a humid chamber for 6 h [Fig. 1].
1, 1.0 mg ml−1, in a phosphate buffer, 50 mM, pH 7.0) was uniformly spread and kept in a humid chamber for 6 h [Fig. 1].
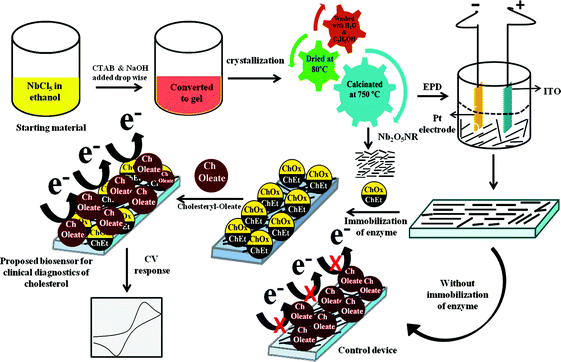 |
| | Fig. 1 Schematic representation of the fabrication of the Nb2O5 nanorod based biosensor for cholesterol detection. | |
3. Characterization
The Nb2O5NR film was characterized using an X-ray diffractometer (XRD, Model Max-2200 diffractometer, Rigaku). Scanning electron microscopy (SEM, LEO 440), Fourier transform infrared spectroscopy (FT-IR, Model 2000, Perkin-Elmer) and high resolution transmission electron microscopy (HR-TEM, JEOL JEM-2000 EX) were used to investigate the structure and morphology of the Nb2O5NR/ITO film and the ChEt–ChOx/Nb2O5NR/ITO film. Electrochemical characterization was carried out using an Autolab Potentiostat/Galvanostat (Eco Chemie, AUT-84275) in a phosphate buffer (50 mM, pH 7.0, 0.9% NaCl) containing (5 mM) [Fe(CN)6]3−/4− as a redox species, using platinum as the counter electrode and Ag/AgCl as the reference electrode.
4. Results and discussion
4.1 X-ray diffraction (XRD) studies
The XRD pattern of Nb2O5NR reveals the orthorhombic structure of Nb2O5. The different diffraction planes (001), (180), (200), (181), (201), (002) were observed at 2θ positions 22.5°, 28.3°, 28.9°, 36.4° 36.9° and 45.9° respectively, as shown in the pattern in Fig. 2(A). The results indicate that the orthorhombic structure of Nb2O5 is highly crystalline in nature. The maximum intensities were observed at the (001) and (180) planes. The intensity ratio of the (001) and (180) planes is calculated as 1.06, which is higher than that of bulk Nb2O5 [JCPDS 27-1003], indicating that nanorods grow preferentially along the (001) direction. The average crystallite size for the (001) and (180) planes are calculated as 25 nm and 13 nm, respectively, using the Debye–Schereer equation.26
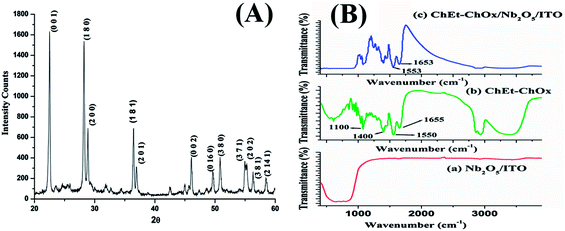 |
| | Fig. 2 (A) XRD pattern of Nb2O5 nanorods. (B) FT-IR spectrum of the Nb2O5NR/ITO film (curve a), FT-IR spectrum of the enzyme ChEt–ChOx in KBr (curve b) and FTIR spectrum of the ChEt–ChOx/Nb2O5NR/ITO bioelectrode (curve c). | |
4.2 Fourier transform infrared spectroscopy (FT-IR) studies
Fig. 2(B) shows FT-IR spectra of the electrophoretically deposited Nb2O5NR/ITO film (curve a), the 1![[thin space (1/6-em)]](https://www.rsc.org/images/entities/char_2009.gif) :
:![[thin space (1/6-em)]](https://www.rsc.org/images/entities/char_2009.gif) 1 mixture of cholesterol oxidase and cholesterol esterase in KBr (curve b) and the ChEt–ChOx/Nb2O5NR/ITO bioelectrode film (curve c). In curve a, the FTIR spectrum shows stretching bands in the region from 650 to 900 cm−1, corresponding to the Nb–O stretching and Nb–O–Nb bridging.27 The FTIR spectrum of ChEt–ChOx (curve b) indicates peaks at 1550 and 1655 cm−1 due to the amide bonds present in the enzymes. The peak at 1655 cm−1 is due to the C
1 mixture of cholesterol oxidase and cholesterol esterase in KBr (curve b) and the ChEt–ChOx/Nb2O5NR/ITO bioelectrode film (curve c). In curve a, the FTIR spectrum shows stretching bands in the region from 650 to 900 cm−1, corresponding to the Nb–O stretching and Nb–O–Nb bridging.27 The FTIR spectrum of ChEt–ChOx (curve b) indicates peaks at 1550 and 1655 cm−1 due to the amide bonds present in the enzymes. The peak at 1655 cm−1 is due to the C![[double bond, length as m-dash]](https://www.rsc.org/images/entities/char_e001.gif) O stretching (amide I band), whereas the peak at 1550 cm−1 originates from the N–H bending (amide II band). The peaks seen at 1400 and 1100 cm−1 correspond to the asymmetric and symmetric bending vibrations of the C–H groups. The broad peaks in the range of 3200–3500 cm−1 are due to the N–H stretching.28 In curve c, the FTIR spectrum of ChEt–ChOx/Nb2O5NR/ITO show all the characteristic peaks of the bienzyme which are clearly visible, indicating the immobilization of the enzyme mixture onto the Nb2O5NR/ITO film.29
O stretching (amide I band), whereas the peak at 1550 cm−1 originates from the N–H bending (amide II band). The peaks seen at 1400 and 1100 cm−1 correspond to the asymmetric and symmetric bending vibrations of the C–H groups. The broad peaks in the range of 3200–3500 cm−1 are due to the N–H stretching.28 In curve c, the FTIR spectrum of ChEt–ChOx/Nb2O5NR/ITO show all the characteristic peaks of the bienzyme which are clearly visible, indicating the immobilization of the enzyme mixture onto the Nb2O5NR/ITO film.29
4.3 Scanning electron microscopy (SEM) studies
The SEM image [Fig. 3(A)] indicates the nanorod morphology of Nb2O5 aggregated on the ITO surface due to electrophoretic deposition under a high potential. It can be seen that these nanorods orient themselves to form films. Further, there are significant open structures in the Nb2O5NR film which may act as hosts for the absorption and further sensing of guest enzymes. After the immobilization of ChEt–ChOx, the SEM investigations indicated the uniform bienzyme coating on Nb2O5 film surface because of its three-dimensional structure [Fig. 3(B)]. Again, the image of the ChEt–ChOx/Nb2O5NR/ITO film exhibits the homogeneous distribution of the Nb2O5 nanorods with the bienzyme which is relatively smooth and crack free. Further, the energy dispersive X-ray (EDX) spectroscopy analysis was carried out for the elemental analysis of the fabricated films. The peaks corresponding to niobium and oxygen can be observed indicating the deposition of Nb2O5 onto the ITO substrate [Fig. 3 (C)]. The presence of other elements (Sn, Si and In) is attributed to the surface of the glassy ITO electrode. The EDX spectrum of the ChEt–ChOx/Nb2O5NR/ITO film shows additional peaks for phosphorous and sodium due to the bienzyme interaction with the nanorods indicating immobilization [Fig. 3 (D)].
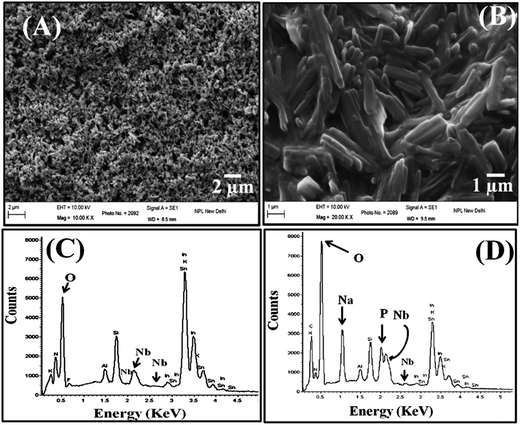 |
| | Fig. 3 (A) Scanning electron microscopy images of the Nb2O5NR/ITO film. (B) Scanning electron microscopy image of the ChEt–ChOx/Nb2O5NR/ITO bioelectrode. (C) Energy dispersive X-ray spectrum of the Nb2O5NR/ITO film. (D) Energy dispersive X-ray spectrum of the ChEt–ChOx/Nb2O5NR/ITO bioelectrodes. | |
4.4 High resolution transmission electron microscopy (HR-TEM) studies
The HR-TEM studies were conducted to investigate the shape and size of the synthesized Nb2O5 nanorods dispersed in acetonitrile. The image shows an overview of randomly oriented Nb2O5 nanorods [Fig. 4(A)]. It can be observed that the Nb2O5 nanorods have a low aspect ratio (∼3), with a diameter of 75 nm and an average length of 200 nm, indicating the formation of structures having the morphology of nanorods. An individual Nb2O5 nanorod is shown in the inset and the end of the nanorods appear as conical tips. The atomic scale image shows the Nb2O5 nanorods are highly crystalline in nature [Fig. 4(B)]. Clearly visualized lattice fringes of the planes (001) and (180) can be seen to be overlapped. The lattice spacing has been estimated as 0.39 nm and 0.32 nm for the (hkl) value of (001) and (180), respectively. The intensity of the (001) plane is higher compared to the (180) plane, indicating the preferred crystallization of nanorods is along the (001) direction. These results are in strong agreement with the XRD studies.
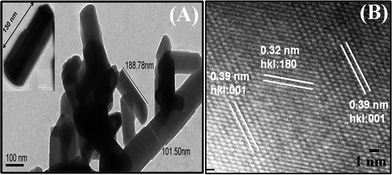 |
| | Fig. 4 (A) Transmission electron microscopy image of Nb2O5 nanorods. (B) High resolution transmission electron microscopy image of Nb2O5 nanorods. | |
4.5 Cyclic voltammetry characterization studies
The cyclic voltammetry (CV) studies of the Nb2O5NR/ITO electrode and the ChEt–ChOx/Nb2O5NR/ITO bioelectrode have been investigated in PBS containing [Fe(CN)6]3−/4− in the range of −0.5 V to +0.7 V, at a scan rate of 50 mV s−1 [Fig. 5(A)]. The results of CV studies indicate that the magnitude of the current (0.79 mA, curve b) of the Nb2O5NR/ITO electrode is enhanced as compared to that of bare ITO (0.72 mA, curve a). The presence of Nb2O5NR on the ITO surface may help to mediate redox species Fe2+/3+ towards the electrode from the bulk solution facilitating the electrochemical current. Further, the improved orientation of Nb2O5 nanorods on the ITO surface can also play an important role in the enhancement of the current. The intrinsic electrochemical and catalytic properties of Nb2O5 may also be responsible for the enhanced current.30,31 In addition, it has been observed that the peak-to-peak potential of the Nb2O5NR/ITO electrode shifts towards the higher side compared to the ITO electrode. After the immobilization of the bienzyme (ChEt–ChOx) onto the Nb2O5NR/ITO electrode, the magnitude of the current is found to decrease (curve c), due to the insulating nature of the bienzyme which obstructs the acceleration of electron transfer between the enzyme active sites and the electrode.
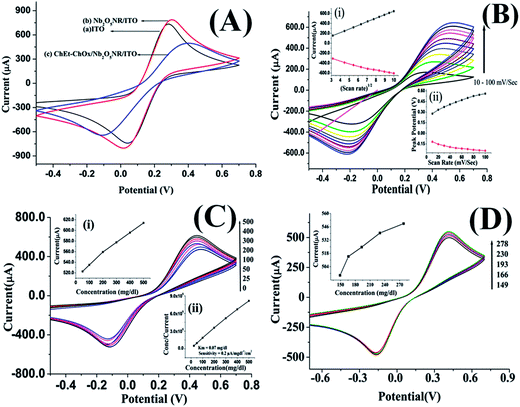 |
| | Fig. 5 (A) CV studies of bare ITO, Nb2O5NR/ITO and ChEt–ChOx/Nb2O5NR/ITO bioelectrode. (B) Cyclic voltammetric response studies of ChEt–ChOx/Nb2O5NR/ITO as a function of scan rate. (C) Electrochemical response of the ChEt–ChOx/Nb2O5NR/ITO bioelectrode at different concentrations (25–500 mg dl−1) of cholesteryl oleate in phosphate buffer. Inset (i) linearity between current and concentration. Inset (ii) Hanes–Woolf plot between substrate concentration and concentration/current. (D) Electrochemical response of the ChEt–ChOx/Nb2O5NR/ITO bioelectrode at different concentrations of available clinical samples. Inset linearity between current and clinical sample concentrations. | |
The CV studies were performed for the ChEt–ChOx/Nb2O5NR/ITO bioelectrodes as a function of scan rate ranging from 10–100 mV s−1 [Fig. 5(B)]. The magnitude of both anodic and cathodic currents increased linearly and the corresponding peaks shifted towards the positive and negative potential respectively with the varying scan rate, indicating a uniform facile charge transfer [eqn (2) and (3)]. The proportional increase in the anodic and cathodic peak potential as a function of scan rate obeys eqn (4) and (5) indicating the electrochemical reaction is diffusion controlled [Fig. 5(B), inset (i) & (ii)].
| |
 | (2) |
| |
 | (3) |
| |
 | (4) |
| |
 | (5) |
The charge associated with the adsorption/desorption of an adsorbate gives an indication of the number of surface catalyst atoms present in the electrode. The electrical charge (Q) is defined as the integral of cell current (I) with respect to time (t) [Q = ∫Idt]. The adsorption charge associated with a known adsorbate on the electrode surface (Qm) and the charge associated with monolayer coverage of the said adsorbate (Qad), can be related to the electrochemical surface area, Aec (cm2) = Qad/Qm. The concentration of electroactive bienzyme associated with the Nb2O5NR surface was determined by integrating the anodic peak according to eqn (6)
| |
 | (6) |
where
Γ is number of mol cm
−2,
Q is the charge obtained by integrating the anodic peak,
n is number of electrons involved in reaction
(1) and
F is Faraday's constant. It has been found that the surface concentration of the ChEt–ChOx/Nb
2O
5NR/ITO bioelectrode is 7.6 × 10
−8 mol cm
−2. The diffusion coefficient (or diffusivity) of the electrolyte containing Fe
3+/2+ ions from the CV response, with respect to the scan rate, has been estimated using
eqn (7).
| |
ip/ν1/2 = slope = (269![[thin space (1/6-em)]](https://www.rsc.org/images/entities/char_2009.gif) 000)n3/2AD1/2C 000)n3/2AD1/2C
| (7) |
where
ip = redox peak current (A),
n = number of electrons transferred in the redox event (1),
A = electrochemical electrode area (cm
2),
D = diffusion coefficient (cm
2 s
−1),
C = concentration of redox species (mol cm
−3),
ν = scan rate (mV s
−1). The higher diffusivity 1.44 × 10
−13 cm
3 s
−1 of the ions for the ChEt–ChOx/Nb
2O
5NR/ITO bioelectrode may be responsible for the fast response times.
4.6 Electrochemical response studies
The electrochemical response studies of ChEt–ChOx/Nb2O5NR/ITO bioelectrode were conducted as a function of cholesteryl oleate concentration (25–500 mg dl−1) [Fig. 5(C)]. It has been observed that the current signal increases with the increasing concentration of cholesteryl oleate, in the range of 25–500 mg dl−1. The electron generation mechanism can easily be explained using the biochemical reaction. Initially, the cholesteryl oleate is hydrolyzed in the presence of ChEt and produces the cholesterol (or 3β-hydroxysteroids) and fatty acid. Since ChOx is a favin adenine dinucleotide (FAD) containing enzymes, that catalyses the oxidation and the isomerization of 3β-hydroxysteroids resulted in the final products of Δ4-3-ketosteroid and hydrogen peroxide and, at an applied potential of 0.4 V, H2O2 produces water and electrons.32 These electrons are directly accepted by the Nb2O5NR and the intrinsic electrochemical and catalytic properties that provide a rapid platform for the transport of electrons lead to the enhanced sensitivity and response time.
The sensitivity of the ChEt–ChOx/Nb2O5NR/ITO bioelectrode is found to be 0.267 μA/mg dl−1 cm−2, with a linear regression coefficient of (R2) 0.998. In addition, the intrinsic electrochemical and catalytic properties of Nb2O5 may contribute significantly in the enhanced sensitivity of ChEt–ChOx/Nb2O5NR/ITO.17,18 The response time of the ChEt–ChOx/Nb2O5NR/ITO biosensor was found to be as less than 10 s [data not shown]. The fast response may be due to the nanorod formation of Nb2O5 that enforces the charge separation and thereby ensures that faster transport results in a longer diffusion length. The detection limit is found to be 39.0 mg dl−1. Further, the Michaelis–Menten constant (Km) for this bioelectrode is calculated as 0.002 mM (0.07 mg dl−1) using a Hanes–Woolf plot, indicating excellent affinity towards cholesterol [Fig. 5(C), inset (ii)]. The performance of this biosensor for cholesterol detection has been compared with the reported literature as shown in Table 1 and the comparison clearly shows the lower Km in the present work, indicating a better enzyme–analyte affinity using niobium oxide nanorods [Table 1].
Table 1 Comparison table for performance characteristics of metal oxide based cholesterol biosensors
| Working electrode |
Detection range (mg dl−1) |
Sensitivity (μA/mg dl−1 cm−2) |
Km value (mg dl−1) |
Cost (based on element availability) |
Response time (s) |
Shelf-life (days) |
Ref. |
| Nano CeO2 |
10–400 mg dl−1 |
2 μA/mg dl−1 cm−2 |
76 mg dl−1 |
Expensive (rare earth metal) |
15 s |
— |
29 |
| Nano Fe3O4 |
50–200 mg dl−1 |
— |
17 mg dl−1 |
Inexpensive |
— |
15 days |
33 |
| Nano ZnO2 |
25–400 mg dl−1 |
— |
80 mg dl−1 |
Inexpensive |
15 s |
75 days |
34 |
| Nano NiO |
10–400 mg dl−1 |
0.808 μA/mg dl−1 cm−2 |
25.52 mg dl−1 |
Inexpensive |
15 s |
70 days |
35 |
| Nano CoO |
4.2–50 μM |
0.043 μA μM−1 |
18.94 mg dl−1 |
Inexpensive |
15 s |
— |
36 |
| Nano Tm2O3 |
8–400 mg dl−1 |
0.9245 μA/mg dl−1 cm−2 |
— |
Expensive (rare earth metal) |
40 s |
— |
37 |
| Nano Nb2O5NR |
25–500 mg dl−1 |
0.267 μA/mg dl−1 cm−2 |
0.07 mg dl−1 |
Inexpensive |
<10 s |
>180 days |
Present work |
4.7 Clinical sample analysis
The response studies of the ChEt–ChOx/Nb2O5NR/ITO bioelectrode were carried out in clinical samples with varying cholesterol concentrations. Serum samples from patients along with clinical data of cholesterol levels were collected from North Delhi Pathology Clinic, New Delhi (India). In comparison to the standard cholesterol concentration, it has been observed that the ChEt–ChOx/Nb2O5NR/ITO bioelectrode shows a minute difference of 4.3–8.9% during cholesterol detection in clinical serum samples [Fig. 5(D)]. The concentration versus current response studies with clinical patient samples shows a nearly linear response, indicating great potential towards the development of point of care diagnostics. Thus, these results indicate that this novel biosensor has the potential to detect cholesterol directly in human serum samples.
4.8 Stability and reproducibility studies
The storage stability of the bioelectrode was monitored by measuring the cholesterol concentration at regular time intervals. It was found that the bioelectrode retains about 90% of its activity even after 6 months when stored in refrigerated conditions [Fig. 6]. The proposed ChEt–ChOx/Nb2O5NR/ITO bioelectrode shows good reproducibility for different working electrodes fabricated through a similar procedure with a cholesterol concentration of 100 mg dl−1. For a reproducibility test, we considered eight different bioelectrodes with constant sensor surface areas and it was found that this bioelectrode shows negligible variation in the current response, as evidenced by a relative standard deviation (RSD) of 0.80% (mean value = 539.5 μA). The low RSD of this fabricated ChEt–ChOx/Nb2O5NR/ITO biosensor indicates good precision [Fig. 7].
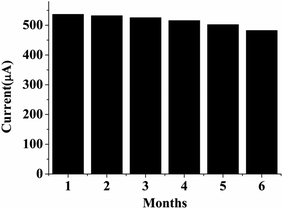 |
| | Fig. 6 Stability studies of ChEt–ChOx/Nb2O5NR/ITO bioelectrodes. | |
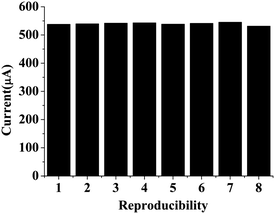 |
| | Fig. 7 Reproducibility studies of ChEt–ChOx/Nb2O5NR/ITO bioelectrodes. | |
4.9 Selectivity studies
The selectivity of the ChEt–ChOx/Nb2O5NR/ITO bioelectrode for specific cholesterol detection was investigated by measuring the response characteristics to a mixture of cholesterol of (200 mg dl−1) and interferents such as glucose, lactic acid, ascorbic acid, urea, uric acid and paracetamol in a 1![[thin space (1/6-em)]](https://www.rsc.org/images/entities/char_2009.gif) :
:![[thin space (1/6-em)]](https://www.rsc.org/images/entities/char_2009.gif) 1 ratio. The concentration of these interferants was taken as 10 times higher than the concentration of the cholesterol. The change in the response current was found to be negligible; it was found to be in the range 0.44 to 2.2% in the presence of potential interferents at a concentration 10 times more than that of cholesterol. Our results indicate that there was almost negligible change in the current response in presence of interferents indicating that the bioelectrode is highly specific for cholesterol detection [Fig. 8]. The bioelectrode was also found to be reusable for more than 10 times. The performance of the biosensor has been compared with the reported literature and the comparison indicates that the sensor shows improved stability which can be attributed to the stable immobilization of the bienzyme onto the niobium oxide nanorods [Table 1].
1 ratio. The concentration of these interferants was taken as 10 times higher than the concentration of the cholesterol. The change in the response current was found to be negligible; it was found to be in the range 0.44 to 2.2% in the presence of potential interferents at a concentration 10 times more than that of cholesterol. Our results indicate that there was almost negligible change in the current response in presence of interferents indicating that the bioelectrode is highly specific for cholesterol detection [Fig. 8]. The bioelectrode was also found to be reusable for more than 10 times. The performance of the biosensor has been compared with the reported literature and the comparison indicates that the sensor shows improved stability which can be attributed to the stable immobilization of the bienzyme onto the niobium oxide nanorods [Table 1].
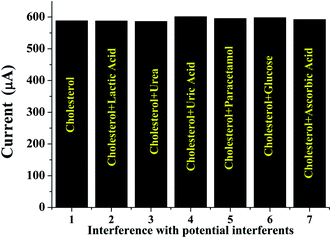 |
| | Fig. 8 Specificity studies of ChEt–ChOx/Nb2O5NR/ITO bioelectrode in the presence of different bioanalytes. | |
5. Conclusions
We have demonstrated the fabrication of a biosensor based on electrophoretically deposited niobium oxide nanorods for the detection of total cholesterol directly from human serum samples. It was observed that these nanorods have the potential to bind the bienzyme directly, for target analyte detection from serum samples. The biosensor was found to be sensitive in a wide detection range (25–500 mg dl−1) with a stability of more than 6 months. This approach may find applications in the sensitive detection of other analytes such as glucose, urea, uric acid, paracetamol and has implications in the development of point of care diagnostics.
Acknowledgements
We are thankful to Prof. R. C. Budhani, Director, CSIR-NPL, India for providing facilities to carry out this work. We thank Prof. B. D. Malhotra, Delhi Technological University and Md. Azahar Ali, CSIR-NPL for useful discussions. We thank Dr. Rakesh Sharma, North Delhi Pathology Clinic for providing the clinical patient samples and standard data of cholesterol in patients. Financial support received from Department of Science and Technology (GAP-081132) is gratefully acknowledged.
References
- P. K. Jain, X. Huang, H. Ivan, M. El-Sayed and A. El-Sayed, Acc. Chem. Res., 2008, 41, 1578 CrossRef CAS PubMed.
- D. A. Giljohann and C. A. Mirkin, Nature, 2009, 462, 461 CrossRef CAS PubMed.
- Y. Xia, P. Yung, Y. Sun, Y. Wu, B. Mayers, B. Gates, Y. Yin, F. Kim and H. Yan, Adv. Mater., 2003, 15, 353 CrossRef CAS.
- Z. L. Wang, Adv. Mater., 2000, 12, 1295 CrossRef CAS.
- J. Hu, T. W. Odom and C. M. Lieber, Acc. Chem. Res., 1999, 20, 435 CrossRef.
- H. Wang, Z. Lu, D. Qian, Y. Liand and W. Zhang, Nanotechnology, 2007, 18, 15616 Search PubMed.
- G. Wang, D. Chen, H. Zhang, J. Z. Zhang and J. Li, J. Phys. Chem. C, 2008, 112, 8850 CAS.
- G. Gruner, Anal. Bioanal. Chem., 2006, 384, 322 CrossRef CAS PubMed.
- J. Liu, Y. Li, X. Huang and Z. Zhu, Nanoscale Res. Lett., 2010, 5, 1177 CrossRef CAS PubMed.
- Md. A. Ali, P. R. Solanki, M. K. Patel, H. Dhayani, V. V. Agrawal, R. John and B. D. Malhotra, Nanoscale, 2013, 5, 2883 RSC.
- F. Zhang, X. Wang, S. Ai, Z. Sun, Q. Wan, Z. Zhu, Y. Xian, L. Jin and K. Yamamoto, Anal. Chim. Acta, 2004, 2, 519 Search PubMed.
- Y. D. Wang, L. F. Yang, Z. L. Zhou, Y. F. Li and X. H. Wu, Mater. Lett., 2001, 49, 277 CrossRef CAS.
- P. Carniti, A. Gervasini and M. Marzo, J. Phys. Chem. C, 2008, 112, 14064 CAS.
- S. H. Mujawar, A. I. Inamdar, S. B. Patil and P. S. Patil, Solid State Ionics, 2006, 177, 3333 CrossRef CAS.
- Y. Zhao, X. Zhou, L. Ye and S. C. E. Tsang, Nano Rev., 2012, 3, 17631 CAS.
- Y. Zhou, Z. Qiu, M. Lu, A. Zhang and Q. Ma, J. Lumin., 2008, 128, 1369 CrossRef CAS.
- X. Luo, A. Morrin, A. J. Killard and M. R. Smyth, Electroanalysis, 2006, 18, 319 CrossRef CAS.
- X. Xu, B. Tian, J. Kong, S. Zhang, B. Liu and D. Zhao, Adv. Mater., 2003, 15, 1932 CrossRef CAS.
- T. You, O. Niwa, M. Tomita and S. Hirono, Anal. Chem., 2003, 75, 2080 CrossRef CAS PubMed.
- J. Z. Xu, J. J. Zhu, H. Wang and H. Y. Chen, Anal. Lett., 2003, 36, 2723 CrossRef CAS.
- J. Choi, J. H. Lim, S. Rho, D. Jahng, J. Lee and K. Kim, Talanta, 2008, 74, 1056 CrossRef CAS PubMed.
- C. S. Lee, D. Kwon, J. E. Yoo, B. G. Lee, J. Choi and B. H. Chung, Sensors, 2010, 10, 5160 CrossRef CAS PubMed.
- L. Pollegioni, L. Piubelli and G. Molla, FEBS J., 2009, 276, 6857 CrossRef CAS PubMed.
- L. Puglielli, A. L. Friedlich, K. D. R. Setchell, S. Nagano, C. Opazo, R. A. Cherny, K. J. Barnham, J. D. Wade, S. Melov and D. M. Kovacs, J. Clin. Invest., 2005, 115, 2556 CrossRef CAS PubMed.
- R. Brayner and F. B. Verduraz, Phys. Chem. Chem. Phys., 2003, 5, 1457 RSC.
- U. Holzwarth and N. Gibson, Nat. Nanotechnol., 2011, 6, 534 CrossRef CAS PubMed.
- H. Y. Y. Ko, M. Mizuhata, A. Kajinami and S. Deki, J. Mater. Chem., 2002, 12, 1495 RSC.
- P. Solanki, A. Kaushik, A. Ansari and B. D. Malhotra, Appl. Phys. Lett., 2009, 94, 14390 CrossRef.
- A. A. Ansari, A. Kaushik, P. R. Solanki and B. D. Malhotra, Electrochem. Commun., 2008, 10, 1246 CrossRef CAS.
- J. Z. Xu, J. J. Zhu, H. Wang and H. Y. Chen, Anal. Lett., 2003, 36, 2723 CrossRef CAS.
- J. Choi, J. H. Lim, S. Rho, D. Jahng, J. Lee and K. Kim, Talanta, 2008, 74, 1056 CrossRef CAS PubMed.
- S. K. Arya, M. Datta and B. D. Malhotra, Biosens. Bioelectron., 2008, 23, 1083 CrossRef CAS PubMed.
- G. K. Kouassi, J. Irudayaraj and G. McCarty, J. Nanotechnol., 2005, 3, 1477 Search PubMed.
- S. P. Singh, S. K. Arya, P. Pandey, B. D. Malhotra, S. Saha, K. Sreenivas and V. Gupta, Appl. Phys. Lett., 2007, 91, 63901 CrossRef.
- J. Singh, P. Kalita, M. K. Singh and B. D. Malhotra, Appl. Phys. Lett., 2011, 98, 123702 CrossRef.
- A. Salimi, R. Hallaj and S. Soltanian, Electroanalysis, 2009, 21, 2693 CrossRef CAS.
- J. Singh, A. Roychoudhary, M. Srivastava, P. R. Solanki, D. W. Lee, S. H. Lee and B. D. Malhotra, Nanoscale, 2014, 6, 1195 RSC.
|
| This journal is © The Royal Society of Chemistry 2014 |
Click here to see how this site uses Cookies. View our privacy policy here. 
![[thin space (1/6-em)]](https://www.rsc.org/images/entities/char_2009.gif) :
:![[thin space (1/6-em)]](https://www.rsc.org/images/entities/char_2009.gif) 1, 1.0 mg ml−1, in a phosphate buffer, 50 mM, pH 7.0) was uniformly spread and kept in a humid chamber for 6 h [Fig. 1].
1, 1.0 mg ml−1, in a phosphate buffer, 50 mM, pH 7.0) was uniformly spread and kept in a humid chamber for 6 h [Fig. 1].

![[thin space (1/6-em)]](https://www.rsc.org/images/entities/char_2009.gif) :
:![[thin space (1/6-em)]](https://www.rsc.org/images/entities/char_2009.gif) 1 mixture of cholesterol oxidase and cholesterol esterase in KBr (curve b) and the ChEt–ChOx/Nb2O5NR/ITO bioelectrode film (curve c). In curve a, the FTIR spectrum shows stretching bands in the region from 650 to 900 cm−1, corresponding to the Nb–O stretching and Nb–O–Nb bridging.27 The FTIR spectrum of ChEt–ChOx (curve b) indicates peaks at 1550 and 1655 cm−1 due to the amide bonds present in the enzymes. The peak at 1655 cm−1 is due to the C
1 mixture of cholesterol oxidase and cholesterol esterase in KBr (curve b) and the ChEt–ChOx/Nb2O5NR/ITO bioelectrode film (curve c). In curve a, the FTIR spectrum shows stretching bands in the region from 650 to 900 cm−1, corresponding to the Nb–O stretching and Nb–O–Nb bridging.27 The FTIR spectrum of ChEt–ChOx (curve b) indicates peaks at 1550 and 1655 cm−1 due to the amide bonds present in the enzymes. The peak at 1655 cm−1 is due to the C![[double bond, length as m-dash]](https://www.rsc.org/images/entities/char_e001.gif) O stretching (amide I band), whereas the peak at 1550 cm−1 originates from the N–H bending (amide II band). The peaks seen at 1400 and 1100 cm−1 correspond to the asymmetric and symmetric bending vibrations of the C–H groups. The broad peaks in the range of 3200–3500 cm−1 are due to the N–H stretching.28 In curve c, the FTIR spectrum of ChEt–ChOx/Nb2O5NR/ITO show all the characteristic peaks of the bienzyme which are clearly visible, indicating the immobilization of the enzyme mixture onto the Nb2O5NR/ITO film.29
O stretching (amide I band), whereas the peak at 1550 cm−1 originates from the N–H bending (amide II band). The peaks seen at 1400 and 1100 cm−1 correspond to the asymmetric and symmetric bending vibrations of the C–H groups. The broad peaks in the range of 3200–3500 cm−1 are due to the N–H stretching.28 In curve c, the FTIR spectrum of ChEt–ChOx/Nb2O5NR/ITO show all the characteristic peaks of the bienzyme which are clearly visible, indicating the immobilization of the enzyme mixture onto the Nb2O5NR/ITO film.29


![[thin space (1/6-em)]](https://www.rsc.org/images/entities/char_2009.gif) 000)n3/2AD1/2C
000)n3/2AD1/2C
![[thin space (1/6-em)]](https://www.rsc.org/images/entities/char_2009.gif) :
:![[thin space (1/6-em)]](https://www.rsc.org/images/entities/char_2009.gif) 1 ratio. The concentration of these interferants was taken as 10 times higher than the concentration of the cholesterol. The change in the response current was found to be negligible; it was found to be in the range 0.44 to 2.2% in the presence of potential interferents at a concentration 10 times more than that of cholesterol. Our results indicate that there was almost negligible change in the current response in presence of interferents indicating that the bioelectrode is highly specific for cholesterol detection [Fig. 8]. The bioelectrode was also found to be reusable for more than 10 times. The performance of the biosensor has been compared with the reported literature and the comparison indicates that the sensor shows improved stability which can be attributed to the stable immobilization of the bienzyme onto the niobium oxide nanorods [Table 1].
1 ratio. The concentration of these interferants was taken as 10 times higher than the concentration of the cholesterol. The change in the response current was found to be negligible; it was found to be in the range 0.44 to 2.2% in the presence of potential interferents at a concentration 10 times more than that of cholesterol. Our results indicate that there was almost negligible change in the current response in presence of interferents indicating that the bioelectrode is highly specific for cholesterol detection [Fig. 8]. The bioelectrode was also found to be reusable for more than 10 times. The performance of the biosensor has been compared with the reported literature and the comparison indicates that the sensor shows improved stability which can be attributed to the stable immobilization of the bienzyme onto the niobium oxide nanorods [Table 1].


