Rick Arneil D. Aranconab,
Sandra H. T. Linc,
Grace Chena,
Carol Sze Ki Lina,
Jianping Laide,
Guobao Xud and
Rafael Luque*bc
aSchool of Energy and Environment, City University of Hong Kong, Shatin, Hong Kong
bDepartamento de QuimicaOrganica, Universidad de Cordoba, Campus Universitario de Rabanales, Edificio Marie Curie (C3), E-14014, Cordoba, Spain
cDepartment of Chemical and Biomolecular Engineering (CBME), Hong Kong University of Science and Technology, Clear Water Bay, Kowloon, Hong Kong. E-mail: rafaluque@ust.hk
dState Key Laboratory of Electroanalytical Chemistry, Changchun Institute of Applied Chemistry, Chinese Academy of Sciences, 5625 Renmin Street, 13022, Changchun, China
eUniversity of the Chinese Academy of Sciences, Chinese Academy of Sciences, No. 19A Yuquanlu, Beijing 100049, China
First published on 25th March 2014
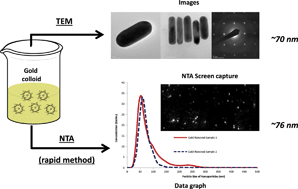
Gold colloidal nanomaterials have been synthesized using different methodologies and characterized by a novel nanoparticle tracking analysis (NTA) technique as compared to conventional Transmission Electron Microscopy (TEM) characterisation. Results prove that NTA is a highly useful, simple, efficient and rapid characterisation tool for Au nanoparticles and nanorods, providing a highly reliable and fast alternative to traditional characterisation techniques. This approach provides a very simple way of studying nanoparticles and some of their properties. Studies on the stabilizing/capping effect of a variety of biomass-derived compounds also show different possibilities for the use of polysaccharide to stabilise colloidal Au solutions.
A range of stabilizing agents derived from renewable resources (e.g. sugars) have been previously reported9–11 and proved to have excellent stabilizing properties for certain types of nanoparticles (e.g. silver). Our group has also recently reported the use of biomass-derived stabilizing/capping agents for the preparation of Ag colloidal nanoparticles.12
In terms of nanomaterial analysis and characterisation, several conventional techniques are generally employed to understand the surface properties, molecular structure, sizes and shapes of nanoentities. These methods include Transmission and Scanning Electron Microscopies (TEM and SEM), X-Ray Diffraction (XRD), Dynamic Light Scattering (DLS), etc. Importantly, most of them need an elaborate and time-consuming methodology for sample preparation and characterisation. Because of this, a simple, efficient and rapid alternative analysis able to provide a series of quick and reliable results in a very short period of time could be highly beneficial. Nanoparticle Tracking Analysis (NTA) developed by the company Nanosight has been shown to image a variety of diverse nanoparticles through efficient light scattering.12 Equipped with a CMOS (Complementary Metal Oxide Silicon) camera, the software is able to detect colloidal nanoentities moving under Brownian motion and produce a size distribution. Basically, the instrument captures an image of a solution exposed to a laser of a specific wavelength and then records the flow of these particles in solution and subsequently averages the distances travelled by the particles. The software is then able to relate diffusion with size based on the Stokes–Einstein relation using the diffusion coefficient derived from the average distances, solution temperature, and viscosity.13
Taking NTA as an interesting alternative to conventional characterisation techniques and in our continuing efforts to provide stabilizing agent alternatives, we report herein the use of similar renewable-derived agents for the stabilisation of colloidal solutions of gold nanomaterials. We demonstrate here that sugar/polysaccharides such as agar and glucose can be effective stabilizing/capping agents for gold colloidal solutions.
Sample 1. Au NRs with length/diameter: 87 nm/32 nm (as measured by DLS), 0.48 mM HAuCl4, 37.2 mM CTAB, 9.9 mM sodium oleate, 96.9 μM AgNO3, 58.1 mM HCl, 0.29 mM ascorbic acid, 0.97 μM NaBH4.
Sample 2. Au NRs with length/diameter: 79 nm/25 nm (as measured by DLS), 0.48 mM HAuCl4, 37.2 mM CTAB, 9.9 mM sodium oleate, 96.9 μM AgNO3, 58.1 mM HCl, 0.48 mM ascorbic acid, 0.97 μM NaBH4.
Sample 3. Au NRs with length/diameter: 76 nm/13 nm (as measured by DLS), 0.48 mM HAuCl4, 37.2 mM CTAB, 9.9 mM sodium oleate, 96.9 μM AgNO3, 86.8 mM HCl, 0.15 mM ascorbic acid, 0.97 μM NaBH4.
![]() | ||
Fig. 1 NTA measurements for particle size distribution of different Au colloidal solutions in the presence of a variety of stabilizing agents. |
![]() | ||
Fig. 2 Time evolution of particle size distribution of Au–glucose–citrate systems as measured by NTA. |
Particle size (nm) – NTA | |||
---|---|---|---|
Mode (maximum) | Mean (average) | Av. article size (nm) – TEM | |
Au solution | — | 233 | Over 200 nm |
Au + glucose | 73 | 84 | 85–90 |
Au + glucose + citrate | 56 | 76 | 70 |
Au + glucose + citrate (30 min) | 119 | 144 | 140 |
Au + agar | 35 | 50 | 50 |
Au + syrup | — | 184 | 150–200 |
Citrates, previously reported as weak reducing14,15 and stabilizing agent16 (also found to play an important role in the stabilization of Ag colloidal solutions),12 was subsequently added to evaluate a potential synergistic effect with the other capping agents (e.g. agar and glucose). Interestingly, while no significant effects were observed when it was added to Au–agar or to the Au–syrup solutions (results not shown), a remarkable synergistic effect was observed when the solution of sodium citrate was added to the Au + glucose mixture (Table 1, Fig. 2).
The AuNP sizes were observed to decrease following the addition of citrate (from 84 nm average particle size to 76 nm). The evolution of NP sizes was also followed with time as shown in Fig. 2 for the Au–glucose–citrate system. In all cases, the addition of mild capping agents was not sufficient to provide a long term stabilisation of colloidal gold nanoparticles with high surface energies. NP aggregation was found to follow a time-dependent pattern (Fig. 2); broader and larger polydispersed nanoparticles were observed through time. The phenomenon could be visualised with the unaided eye as a gradual change of colour of the colloidal gold solution from bright yellow to dark brown to almost black (via dark yellow, light green to light brown).
The distribution curves from NTA analysis clearly suggest the formation of polydispersed nanoparticles in the solution. In order to validate the accuracy of the data which were obtained very quickly (only taking a few minutes from sample preparation to analysis), identical experiments were conducted and the solutions were submitted for Transmission Emission Microscopy (TEM). Representative TEM images of the investigated systems depicted in Fig. 3 show a very good agreement with the results obtained by NTA. Au NPs in stabilized colloidal solutions were found to be highly crystalline (C, F, I of Fig. 3, electron diffraction patterns) and sizes were observed to be in good agreement with those of NTA (Table 1). Due to the relatively high surface energy of gold, aggregation is unavoidable with time, which the formation of larger nanoparticles when visualised under TEM (Fig. 3D–G). Considering such rapid aggregation of gold nanoparticles, sizes measured between TEM and NTA are not quite far-off from each other, making the NTA an excellent technique for quick screening of nanoparticles in colloidal solutions.
Interestingly, the lines and regular patterns on the Au NPs in ED were remarkably changed after the addition of the capping agents, possibly indicating a change in the internal structure of the nanoparticle.17,18
The ability of the agar to avoid Au NP aggregation may be attributed to its potential to effectively coat the surface of the nanoparticle and significantly reduce its surface energy.4,12 As reported by Shan et al.,19 a chitosan polysaccharide does not only have the ability to interact with the surface but can also serve as a reducing agent. We believe that the observed NP stabilization in the case of agar is mainly due to a combination of a reduction in surface energy of the colloidal Au NPs and a mild reduction of Au3+ to Au species.4,12 These results are also in good agreement with the observed synergistic effect of the addition of citrate to the Au–glucose system, with glucose playing the role of a capping agent and citrate as both a stabilising and mild reducing agent.14–16
Results obtained from the biorefinery-derived syrup were, however, remarkably different from previously reported Ag-stabilised nanoparticles using similar capping agents.12 The syrup was found to be more efficient in stabilising Ag nanoparticles (as compared to sugars and related capping agents) with respect to the almost negligible capping/stabilising effect observed with Au nanoentities. A similar effect was observed for most capping agents utilized in our previous work with Ag colloidal NPs, which led to smaller and not so polydispersed Ag NP sizes.12 In the case of the hemicellulosic syrup, low quantities of polydispersed colloidal particles could be observed in the systems (Fig. 4). We believe that the significant differences in terms of surface energies between Au and Ag colloidal nanoentities account for the different behaviour in the two colloidal systems based on measured experimental data for surface energies available for both metals (1.25 and 1.5 J m−2 for Ag and Au, respectively).20
![]() | ||
Fig. 4 TEM images of (A) colloidal Au in a syrup solution; (B) Ag colloidal nanoparticles stabilised by the biorefinery derived syrup.12 |
In fact, experiments with a significantly larger surface energy metal (Fe, 2.5 J m−2)20 were unable to provide any stabilisation/capping in Fe-containing solutions.
Upon investigation of the capping abilities of various polyol compounds on Au colloidal solutions, we were prompted to study the reliability of the NTA by comparing its results with TEM.
Particle size (nm) – NTA | Average particle size (nm) – TEM | DLS | ||
---|---|---|---|---|
Mode (maximum) | Mean (average) | |||
Au NRs sample 1 | 52 | 82 | 80 × 20 | 76 × 13 |
Au NRs sample 2 | 59 | 69 | 85 × 30 | 79 × 25 |
Au NRs sample 3 | 65 | 85 | 90 × 40 | 87 × 32 |
![]() | ||
Fig. 6 TEM micrographs of Au NRs (samples 2 and 3); lower right image shows the EDX pattern of the Au NRs. The Electron Diffraction (ED) pattern shows a well-structured fcc cubic Au phase. |
Being quite sceptical about the possibility of NTA to provide reliable data due to different dimensions (width and length) of Au NRs. Results obtained after comparison of NTA and TEM demonstrate the good agreement (even better as compared to colloidal Au NP systems) between both analytical techniques and the relatively good accuracy of employing NTA for nanoparticles in colloidal solutions. Au NRs exhibited a perfect crystalline fcc cubic structure (as depicted in the ED pattern of a representative sample, Fig. 6D).
Footnote |
† Electronic supplementary information (ESI) available. See DOI: 10.1039/c4ra00208c |
This journal is © The Royal Society of Chemistry 2014 |