Celastrol-modified TiO2 nanoparticles: effects of celastrol on the particle size and visible-light photocatalytic activity

Caihua Chena, Quanwen Liu*a, Shanmin Gao*ab, Kai Lia, Hui Xua, Zaizhu Loub, Baibiao Huangb and Ying Daib
aCollege of Chemistry & Materials Science, Ludong University, Yantai, 264025, China. E-mail: gaosm@ustc.edu
bState Key Laboratory of Crystal Materials, Shandong University, Jinan, 250100, China

Received 8th January 2014 , Accepted 18th February 2014

First published on 18th February 2014


Abstract

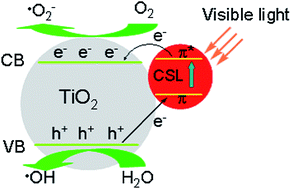
In this study, celastrol (CSL), a triterpene compound which is derived from the Chinese medicinal plant Tripterygium wilfordii, was used to synthesize CSL-modified TiO2 nanoparticles by a hydrothermal treatment method. The nanoparticles phase, morphology, surface structures, as well as the visible-light photocatalytic activities were studied. The modification of CSL does not alter the crystalline structure of the TiO2 but can prevent TiO2 from further aggregating and provides photosynthesis pigments as an in situ dye-sensitizing source. Compared to pure TiO2, the resulting CSL-modified TiO2 nanoparticles exhibit enhanced visible-light photocatalytic activity and showed an excellent cyclic stability in the decomposition of methylene blue (MB). In addition, the photocatalytic degradations of MB were all demonstrated to follow a first-order kinetic model. The enlarged specific surface area and CSL-modified surface improved the visible-light photocatalytic activity of nanoparticles.

1. Introduction

Anatase TiO2 is an excellent photocatalyst, because it is effective, photostable, reusable, inexpensive and non-toxic.1 Generally, in the TiO2-catalyzed photo-oxidation process, the photoexcited electrons in the conduction band (CB) of TiO2 (−4.2 eV vs. vacuum) can be readily captured by O2 to form superoxide anions (O2) as well as other oxygen species, while the holes in the valence band (VB, −7.4 eV vs. vacuum) reside below the highest occupied molecular orbitals (HOMO) of most organic pollutants, allowing aggressive oxidizing (ripping electrons off) of the organic pollutants.2 However, because of its large band gap of 3.2 eV, only a small UV fraction of solar light, about 4%, can be utilized to generate electron–hole pairs. To extend the light response of TiO2 to the visible region, many modification methods, such as metal ion and non-metal doping,3 noble metal deposition,4 Ti3+ self-doping,5 composite semiconductors,6 and surface dye sensitization have been reported.7,8

Some studies have showed that surface dye sensitization or modification by conductive polymers can be used to improve its photocatalytic activity by absorbing visible light and subsequently transferring photogenerated electrons from excited sensitizer molecules to the conduction band of TiO2.9–11 In addition, it was found that certain organic species could be modified on the surface of TiO2 and showed higher photocatalytic activity.12–14 For example, Yu et al. prepared trifluoroacetic acid (TFA) modified TiO2 hollow microspheres by one-pot hydrothermal treatment of Ti(SO4)2 in the presence of TFA at 180 °C for 12 h.15 Cropek et al. found that surface modification of TiO2 with arginine changed the surface charge and resulted in enhanced reduction of 4-nitrophenol.16 Feng et al. investigated the preparation of phthalic acid modified TiO2 and found that the adsorption of phthalic acid onto the surface of TiO2 nanoparticles resulted in the formation of a surface-modified complex. The recombination of charge carriers was effectively suppressed due to the modification of phthalic acid on the surface of TiO2.17

Recently, Shi et al. reported that surface-sensitized TiO2 with quercetin can result in inhibition of Helminthosporium maydis under visible light irradiation.18 Quercetin, a kind of flavonoids extracted from natural plants, on the one hand, has a catechol moiety that can coordinate with surface sites of TiO2 nanoparticles to form a charge-transfer complex, which can enhance the rate constant of electron transfer from adsorbed species to TiO2 semiconductor. On the other hand, the dye can act as surface photosensitizer because of the presence of the π-conjugated system in quercetin molecular structure and hyper chromic groups (–OH) on its chromone moiety, making the TiO2 absorb and respond to visible light.

Celastrol (CSL) is an orange-coloured triterpene compound containing an acidic group on one end and a phenolic quinone at the other end, which is derived from the Chinese medicinal plant Tripterygium wilfordii. In China, this plant has a long history of use in traditional medicine for treating fever and joint pain. It has attracted great attention for its potent anti-inflammatory effects, anticancer effects and antioxidation.19 Evidence has been obtained that the dienone–phenol moiety and the anionic carboxyl group of CSL are both required for efficient antiperoxidative action. The phenol directly scavenges radicals while the latter contributes a negative surface charge to the cell membrane.20 Wang et al. investigated the photodynamic treatment of TiO2 nanofibers combined with CSL for HepG2 proliferation in vitro.21 Their results indicated that the nanocomposites between TiO2 nanofibers and CSL could enhance the cytotoxicity of CSL for HepG2 cells and cut down the drug consumption so as to reduce the side-effect of the related drug.

In this paper, the TiO2 nanoparticles modified by a small amount of CSL were prepared and the visible light photocatalytic activities of it were investigated. To the best of our knowledge, no work has been done on the photocatalytic activity of CSL-modified TiO2 nanoparticles under visible light irradiation. On the one hand, CSL can affect the size and shape of the TiO2 nanoparticles. On the other hand, the CSL-modified TiO2 absorbed more photons under visible light irradiation. A possible mechanism for MB dyes photodegradation by using CSL-modified TiO2 nanoparticles was also preliminarily discussed. The dramatic enhancement in photocatalytic activity under visible light irradiation was explained on the basis of the synergetic effects of enhanced adsorption of the CSL and improved efficiency on separation of photo-generated carriers.

2. Materials and method

2.1 Synthesis

The CSL was extract from Tripterygium wilfordii by our own. Its structure is given in Scheme 1. Other chemicals used in this study were reagent-grade and deionized water was used in all experiments. A typical procedure for preparing the CSL-modified TiO2 nanoparticles is described as following. First, 6.0 g tetrabutyl orthotitanate (Ti(OC4H9)4, TBOT) was dissolved in 20 mL absolute ethyl alcohol, and the solution was stirred for 10 min at ambient temperature to achieve homogeneity. 0.03 g CSL was dissolved in 20 mL absolute ethyl alcohol, and the CSL solution was added drop-wise into the TBOT solution with continuous stirring for 15 min at room temperature. Then, 100 mL distilled water were added to the mixture solution of CSL and TBOT, which leads to a red-brown precipitate of floccules immediately. During hydrolysis, the liquid was kept under continuous vigorous stirring and the resulting suspension was continuously stirred for an additional 1 h at room temperature. The precipitate was filtered out and washed repeatedly with deionized water and absolute ethanol. Then the precipitate was treated at 180 °C for 24 h by hydrothermal method. Finally, the precipitate was filtered out and washed by deionized water and absolute ethanol for multiple times and dried in an oven at 80 °C for 4 h. For comparison, pure TiO2 powder was also prepared without the addition of the CSL.
image file: c4ra00179f-s1.tif
Scheme 1 Structure of celastrol.

2.2 Characterization

The phases of the final products were identified using X-ray diffractometer (XRD) (Rigaku D/max-2500VPC) with Ni-filtered Cu Kα radiation at a scanning rate of 0.02° s−1 from 20° to 80°. The morphology of the samples was observed with a Hitachi model H800 transmission electron microscope (TEM) using an accelerating voltage of 150 kV. Ultraviolet-visible (UV-vis) diffuse reflection spectra (DRS) were recorded on a Shimadzu UV-2550 UV-vis spectrophotometer in the range 200–800 nm at room temperature. Fourier transform infrared (FTIR) spectra were recorded from KBr pellets in a Nicolet Nexus 670 spectrophotometer. The photoluminescence (PL) spectra were measured at room temperature with a Perkin Elmer LS 55 Fluorescence Spectrometer, using pulsed xenon discharge lamps as excitation sources.

2.3 Photocatalytic measurement

The photocatalytic activity of the as-prepared CSL-modified TiO2 nanoparticles was evaluated by measuring the decomposition rate of MB solution at room temperature. For comparison, the same measurements were also performed on the pure CSL and TiO2. The temperature of the photocatalytic reaction was maintained at room temperature. The visible light was obtained from a 300 W Xe lamp (PLS-SXE300, Beijing Trusttech Co. Ltd.) with a UVCUT400 model filter (transparent for λ > 400 nm). For a typical photocatalytic experiment, a total of 0.06 g sample was added to 100 mL MB aqueous solution (5.0 × 10⁻⁴ mol L−1) in a custom-made quartz reactor. The concentration of MB was monitored by UV-vis spectroscopy with maximum absorption at ∼660 nm during the entire experiment. After 5 min or 10 min intervals during visible light illumination, about 3 mL aliquots were taken out and centrifuged to remove the trace particles. The absorbance of the centrifuged solution was measured in the range 500–800 nm using a UV-vis spectrophotometer (Shimadzu UV-2550). To determine the extent of mineralization during photocatalysis, total organic carbon (TOC) of centrifuged suspension samples were measured via a Shimadzu TOC-VCSH analyzer equipped with a Shimadzu ASI-V auto sampler device.

3. Results and discussion

3.1 Characterization of samples

XRD and Raman spectroscopy were used to investigate the changes of structure and crystallite sizes of the CSL-modified TiO2 nanoparticles obtained at different CSL amounts. Fig. 1(a) shows the XRD patterns of the samples obtained at various CSL amounts. All samples showed an anatase TiO2 phase, indicating that the crystallization of the samples is achieved and that only anatase phase can be obtained. Moreover, CSL-modified TiO2 nanoparticles do not cause any change in peak positions compared with pure TiO2. However, the intensity of the main peak of modified catalyst is slightly lower than that of pure TiO2, which shows that the addition of CSL affect the size of the TiO2 nanoparticles. The Raman spectroscopy results of pure TiO2 and CSL-modified TiO2 nanoparticles indicated the decrease in the average size and crystallization of the as-prepared CSL-modified TiO2 nanoparticles (experimental results are shown in the ESI, Fig. S1).
image file: c4ra00179f-f1.tif
Fig. 1 (a) XRD patterns of pure TiO2 and CSL-modified TiO2 nanoparticles. (b), (c) and (d) TEM images of the pure TiO2, 0.5 wt% and 2.0 wt% CSL-modified TiO2, respectively.

The average crystallite sizes of pure TiO2 and CSL-modified TiO2 nanoparticles were determined from the anatase peak (101) by using the Debye–Scherrer formula given by:

 
image file: c4ra00179f-t1.tif(3.1)
where d is the particle sizes, λ is the wave length of the X-ray radiation (0.15406 nm), K is the shape coefficient (K = 0.94), θ is the diffraction angle and β is the full width at half maximum (FWHM) of the selected diffraction peak. The average crystallite sizes of the samples are 20.6 nm, 8.3 nm and 6.2 nm for pure TiO2, 0.5 wt% and 2.0 wt% CSL-modified TiO2, respectively. This trend is also in consistence with TEM observation.

The typical microstructure of the samples was characterized by TEM and the results are shown in Fig. 1(b)–(d). The average particle size of pure TiO2 is estimated to be 25 nm with a wide particle size distribution and the morphology of particles is irregular (Fig. 1(b)). When CSL was used as modifier, the morphology and size of newly-formed particles changed, as shown in Fig. 1(c) and (d). With the increase of the CSL amount, the morphology of the particles grows regular and the size becomes smaller. This further illustrates that the addition of CSL can affect the morphology and particle size of TiO2. The smaller of the particles size, the greater of the surface area, then the better of the photocatalytic performance.22 Light efficiency can also be enhanced due to the increased specific surface area and multiple scattering.23 The specific surface area (SA) of the samples were estimated by the formula given by:

 
image file: c4ra00179f-t2.tif(3.2)
where d is the particle size and ρ is the density of the bulk TiO2 (ρ = 3.9 g cm−3). The surface area are 74.7 m2 g−1, 185.4 m2 g−1 and 248.1 m2 g−1, for pure TiO2, 0.5 wt% and 2 wt% CSL-modified TiO2 nanoparticles, respectively. The results are consistent with the test results by nitrogen adsorption–desorption isotherm measurements (experimental results are shown in the ESI, Fig. S2).

FT-IR spectra are used to identify the surface functional groups of the samples. Fig. 2 shows the FT-IR spectra of pure TiO2, CSL and the CSL-modified TiO2 nanoparticles in the wavenumbers range from 500 cm−1 to 4000 cm−1. The broad bands near 3452 cm−1 and the sharp band peaking at 1400 cm−1 appeared in all of the four spectra are respectively ascribed to the stretching and bending modes of the surface hydroxyl groups.24 The bands at 1130 cm−1 and the broad absorption peak from 800 cm−1 to 500 cm−1, with maximum absorption at 620 cm−1, is ascribed to the asymmetric stretching, symmetric stretching, and the bending modes of Ti–O–Ti, respectively.25 The peak observed at 1670 cm−1 is assigned to the deformation vibration for H–O–H bonds, which is normally recognized as an important factor affecting photocatalytic activity.26


image file: c4ra00179f-f2.tif
Fig. 2 FT-IR spectra of pure TiO2, pure CSL, 0.5 wt% and 2.0 wt% CSL-modified TiO2 nanoparticles.

The peak widths of the O–H stretching in CSL-modified samples are notably narrower than that of pure TiO2. Typically, narrow peak indicates an enhanced intermolecular interaction among the functional groups. For example, narrow peak width of C–H stretch reflects greater packing density, thus leading to less mobility of alkyl chains in a self-assembled monolayer.27 So, this phenomenon can also be applied to the interaction among surface hydroxyl groups. Since the surface hydroxyl groups play an important role in the photocatalytic process, with increase the amounts of surface hydroxyl groups by mixing with CSL, which can suppress electron–hole recombination and increase the photocatalytic efficiency.28

As shown in Fig. 2, a few broad and weak absorption bands between 3000 cm−1 and 1000 cm−1 appear in our CSL-modified TiO2 samples. Undoubtedly, the differences of the FT-IR spectra between the pure TiO2 and CSL-modified TiO2 samples are related to the introduction of CSL source. The peaks from 2960 to 2850 cm−1 correspond to the C–H stretching mode of –CH, –CH2 and –CH3 bond.29 The peaks observed at 1200–1180 cm−1 were characteristic of C–O asymmetric and symmetric vibrations. The peaks at 1650–1500 cm−1 are attributed to the C[double bond, length as m-dash]C stretching vibration on the benzene ring, while the absorption peaks at 1450 to 1420 cm−1 were attributed to the in-of-plane bending vibration of C–H bonds. Bands at 1120 to 860 cm−1 were ascribed to the out-of-plane bending vibration of [double bond, length as m-dash]C–H bond.30

From the IR spectra, one can see that the pure CSL have two vibration peaks at about 870 cm−1 and 1445 cm−1 (Fig. 2d), which belong to the bending vibration of –OH bond. The two peaks did not appear at the CSL-modified TiO2 (Fig. 2b and c), suggesting that CSL was bound to the surface of TiO2 via the carboxyl group and most likely the binding was a bidentate which was similar to other TiO2 chelating agents such as ascorbic acid.25

3.2 Optical properties and photocatalytic activity

CSL belongs to triterpenoids compound and contains resonance structure. The maximum absorption wavelength of it is 425 nm, which indicates that CSL shows strong absorption in visible light region. Hence, CSL may be as a photosensitizer for TiO2. Fig. 3a collects the UV-Vis diffuse reflectance spectra of the prepared CSL-modified TiO2, the pure TiO2 and CSL. Inset is the photos of pure CSL and 0.5% CSL-modified TiO2 samples. It is obvious that CSL has high absorption peak at about 425 nm. The strong absorption peak at 425 nm is caused by the π → π* transition. In comparison to the pure TiO2, the spectra of the CSL-modified TiO2 samples exhibit a stronger broad absorption band between 400 and 700 nm. The absorption intensity of CSL-modified TiO2 samples in the visible light region increases with the increase of the CSL amount. This further indicates that there is interaction between CSL and TiO2 and our method is effective to extend the absorption of TiO2 to visible light range. The absorption in the visible-light region implies that the prepared CSL-modified TiO2 samples can be activated by visible light and that more electrons and holes can be photogenerated and participated in the desired photocatalytic reactions.
image file: c4ra00179f-f3.tif
Fig. 3 (a) UV-vis spectra of pure TiO2, pure CSL, 0.5% and 2% CSL-modified TiO2 nanoparticles. Inset is the photos of pure CSL and 0.5% CSL-modified TiO2 samples. (b) Photodegradation of MB aqueous solutions by using pure TiO2, pure CSL and CSL-modified TiO2 samples as photocatalysts under visible light irradiation in neutral suspension.

MB is a brightly colored blue cationic thiazine dye and is often used as a test model pollutant in semiconductor photocatalysis. Fig. 3b shows the photodegradation ability on MB solutions of pure TiO2, CSL and CSL-modified TiO2 nanoparticles. The results show that under the illumination of visible light, the MB solutions containing the CSL-modified TiO2 samples underwent significant degradation and became nearly transparent within 40 min. It should be noted that the 2.0% CSL-modified TiO2 sample exhibits the best photocatalytic activity. In contrast, pure TiO2 and CSL almost do not decompose MB under visible light irradiation.

The photocatalytic activity of the powders can be quantitatively evaluated by comparing their apparent reaction rate constants. Most of the photocatalytic oxidation of organic pollutants in aqueous suspensions follows the classical Langmuir–Hinshelwood kinetic model,31 the photocatalytic process of MB can be expressed as the following apparent pseudo-first-order kinetics equation:32

 
image file: c4ra00179f-t3.tif(3.3)
where Ct is the concentration of aqueous MB at reaction time t, C0 is the initial MB concentration, kapp is the apparent pseudo-first-order rate constant, and t is the reaction time. According to the experimental results, the variations in ln(C0/C) as a function of the irradiation time are given in Fig. 4a. All the curves can be fitted roughly to a straight line. Thus, the photocatalytic degradation reaction is assumed to follow first-order kinetics. The rate constants of the 0.5 wt%, 2 wt% CSL-modified TiO2 and pure TiO2 nanoparticles are 0.038, 0.056 and 0.0013, respectively. Its are 29.23 and 43.08 times higher than that of pure TiO2. Therefore, the CSL-modified TiO2 nanoparticles exhibit strong photocatalytic activity for MB decomposition under visible-light irradiation.


image file: c4ra00179f-f4.tif
Fig. 4 (a) Variation in the normalized ln(C0/C) as a function of visible-light irradiation time. (b) Recycling test result by using the 2 wt% CSL-modified TiO2 sample under the same conditions.

The stability of a photocatalyst is highly important for its application. The cyclic stability test under the same conditions, i.e., the initially concentration of MB is 5.0 × 10⁻⁴ mol L−1, of 2 wt% CSL-modified TiO2 nanoparticles was also examined and shows excellent photocatalytic activity in degrading MB solution, as shown in Fig. 4b. No significant decrease in its photocatalytic oxidation activity is observed after being used 10 times, which makes it very promising for practical application.

To eliminate the possibility that the enhanced photocatalytic activity of CSL-modified TiO2 samples mainly results from their enhanced physisorption alone, the FTIR spectra of the 2 wt% CSL-modified TiO2 sample have been recorded before and after the photodegradation of MB. Fig. 5a is the IR result that mix MB and 2 wt% CSL-modified TiO2 sample and stirred in the dark for 30 min, then centrifuged and drying. Fig. 5b is the IR result of 2 wt% CSL-modified TiO2 nanoparticles after degradation. Comparative (a) and (b) shows that, in the dark with stirring, the MB molecules adsorption on the catalyst surface. After the photocatalytic reaction, the complicated vibrational modes of MB disappear (Fig. 5b). As illustrated in Fig. 5b and 2c, the FTIR spectra of pure 2 wt% CSL-modified TiO2 sample before (Fig. 2c) and after degradation (Fig. 5a) show no significant discrepancy. In contrast, the FTIR spectrum of MB (Fig. 5b) shows more complicated vibrational modes due to the organic molecule. The distinct FTIR spectrum of CSL-modified TiO2 nanoparticles before and after degradation and that of the pure methylene blue strongly suggests that the degradation is due to the photocatalytic degradation instead of any physisorption of methylene blue on the catalyst.


image file: c4ra00179f-f5.tif
Fig. 5 FTIR spectra of (a) 2 wt% CSL-modified TiO2 nanoparticles mix with MB before degradation, (b) 2 wt% CSL-modified TiO2 nanoparticles mix with MB after degradation and (c) pure methylene blue.

Complete mineralization is very important for organic pollutants photocatalysis.33 The decomposition of the MB molecule and subsequent mineralization leading to water and carbon dioxide could be visualized by the decrease in total organic carbon (TOC) during the photocatalytic process. To assess the extent of mineralization during the photocatalytic degradation of MB, TOC was monitored as shown in Fig. 6. It showed TOC decreases during photocatalytic degradation of MB. Nearly 88% TOC removal was achieved after 70 min irradiation.


image file: c4ra00179f-f6.tif
Fig. 6 Total organic carbon (TOC) removals during photocatalysis.

3.3 Proposed mechanism for the enhanced photocatalytic activity

Generally, surface modifiers can affect the TiO2 characteristics by three ways: (1) by inhibiting charge recombination; (2) by exploring the wavelength response range; (3) by changing the selectivity or yield of a particular product.34 The PL emission has been widely used to explore the efficiency of charge carrier trapping, migration, and recombination in order to understand the fate of electron–hole pairs in semiconductor particles. The higher intensity of PL spectra reflects the higher rate of recombination.35 Fig. 7a shows the room temperature PL spectra for pure TiO2, CSL and CSL-modified TiO2 samples excited by UV light at 380 nm. As shown in these spectra, the positions of the emission bands are similar and the PL intensity of the CSL-modified TiO2 is relatively lower than that of pure TiO2. Since the PL emission is a result of recombination of excited electrons and holes, the lower PL intensity may indicate the lower recombination rate of electron–holes under the light irradiation.36 The PL results indicate that the photo-induced electron can transfer between CSL and TiO2. When CSL is excited by light, the electron generated by the π → π* transition can be transferred to the conduction band of TiO2, and the electrons at the TiO2 valence band can also be transferred to the CSL. This will effectively promote the separation of electron–hole pairs, thereby enhancing the photocatalytic properties. In other words, the CSL-modified TiO2 suppresses the recombination process, leading to a weak recombination of the electron–hole pairs and a high photocatalytic activity. However, for excitation with visible light at 425 nm, the CSL-modified TiO2 samples exhibit much better PL effect than pure TiO2 (Fig. 7b). The weaker of PL in pure TiO2 is due to the insufficient energy of the visible photons that is lower than the band gap of pure TiO2. In contrast, for the CSL-modified TiO2 samples, the CSL modification allows absorption in the visible region to produce photoelectrons and holes.
image file: c4ra00179f-f7.tif
Fig. 7 PL spectra of pure TiO2, CSL and the CSL-modified TiO2 nanoparticles under UV-380 nm (a) and visible light 425 nm (b).

The effects of main active radical species (h+ and ˙O2) suspected to be involved in the photocatalytic process were investigated under visible light using a quantity of appropriate species quenchers (experimental results are shown in the ESI, Fig. S3). From the results, one can conclude that the ˙O2 radicals and h+ almost played the same role for MB degradation. Based on the results of PL and photocatalytic tests, the photocatalytic mechanism under visible light irradiation can be suggested as follows. As shown in Fig. 8, when the CSL-modified TiO2 nanoparticles are irradiated by using visible light, CSL absorbs visible light to induce electron transition. The excited-state electrons are transported from π-orbital to π*-orbital. The excited-state electrons could be injected into the d-orbital (conductive band, CB) of TiO2 readily and transferred to the nanoparticles surface to react with dissolved oxygen to generate superoxide radicals (˙O2) (Fig. 8(1)), which then become highly oxidative hydroxyl radicals (˙OH) through a series of oxidation reactions (Fig. 8(2) and (3)). At the same time, a positive charged hole (h+) might be formed by electron migrating from TiO2 valence band (VB) to CSL π-orbital, which can react with OH, H2O or H2O2 to generate hydroxyl radicals (˙OH) (Fig. 8(4)). The superoxide radical ion ˙O2 and hydroxyl radical ˙OH are responsible for the degradation of organic compounds.8,30 Therefore, in contrast to bare TiO2 nanoparticles, the higher photocatalytic activity of this system is due to the rapid charge separation and slow charge recombination. The superoxides attack MB and then completely photocatalyze oxidation cleavage of C[double bond, length as m-dash]N, C[double bond, length as m-dash]S, C–N and C–S bond. The smaller pieces are further completely oxidized to CO2, H2O, NOx and SO42− by ˙O2, ˙OH or few ˙HO2 radicals (Fig. 8(5)).


image file: c4ra00179f-f8.tif
Fig. 8 The diagram of visible absorption and photocatalytic mechanism in the presence of CSL-modified TiO2 nanoparticles.

4. Conclusion

In summary, celastrol (CSL), a triterpene derived from the Chinese medicinal plant Tripterygium wilfordii, was used to modify TiO2 nanoparticles by the hydrothermal method. The resulting CSL-modified TiO2 nanoparticles shows enhanced visible light-driven photocatalytic oxidation on MB. The high visible-light-driven photocatalytic activity of CSL-modified TiO2 nanoparticles is ascribed to the synergetic effects of enhanced absorption of the CSL and increased efficiency in separation of photo-generated charge carriers. The as-prepared CSL-modified TiO2 nanoparticles will show potential applications in various fields including photocatalysis, electrochemistry, biomedical field and so on. In addition, because the CSL have good biological activity and have been found to inhibit the proliferation of a variety of cancer cells and induce leukemic cell death, the introduction of CSL into the photosensitizer TiO2 nanoparticles can optimize the use of traditional Chinese medicine (TCM) and realize its potential application for the multi-mode therapy of cancers. Further studies results will be summarized in our next study.

Acknowledgements

This work was supported by the Key Project of Natural Science Foundation of Shandong Province (ZR2013EMZ001), the Natural Science Foundation of Shandong Province (ZR2012BM021, ZR2011BQ01), the National Basic Research Program of China (973 Program, no. 2013CB632401) and the Project of Shandong Province Higher Educational Science and Technology Program (J10LF02, J12LA01, J11LB03).

References

  1. (a) A. Kubacka, M. Fernández-García and G. Colón, Chem. Rev., 2012, 112, 1555–1614 CrossRef CAS PubMed; (b) P. V. Kamat, J. Phys. Chem. C, 2012, 116, 11849–11851 CrossRef CAS.
  2. (a) A. Testino, I. R. Bellobono, V. Buscaglia, C. Canevali, M. D. Arienzo, S. Polizzi, R. Scotti and F. Morazzoni, J. Am. Chem. Soc., 2007, 129, 3564–3575 CrossRef CAS PubMed; (b) J. Zhang, Q. Xu, Z. C. Feng, M. J. Li and C. Li, Angew. Chem., Int. Ed., 2008, 47, 1766–1769 CrossRef CAS PubMed.
  3. (a) B. Qi, Y. Yu, X. Q. He, L. Z. Wu, X. F. Duan and J. F. Zhi, Mater. Chem. Phys., 2012, 135, 549–553 CrossRef CAS PubMed; (b) P. Xu, T. Xu, J. Lu, S. M. Gao, N. S. Hosmane, B. B. Huang, Y. Dai and Y. B. Wang, Energy Environ. Sci., 2010, 3, 1128–1134 RSC.
  4. (a) S. T. Kochuveedu, D. P. Kim and D. H. Kim, J. Phys. Chem. C, 2012, 116, 2500–2506 CrossRef CAS; (b) H. Liu, X. Dong, G. Li, X. Su and Z. Zhu, Appl. Surf. Sci., 2013, 271, 276–283 CrossRef CAS PubMed.
  5. (a) F. Zuo, K. Bozhilov, R. J. Dillon, L. Wang, P. Smith, X. Zhao, C. Bardeen and P. Y. Feng, Angew. Chem., 2012, 124, 6327–6330 CrossRef; (b) M. Liu, X. Q. Qiu, M. Miyauchi and K. Hashimoto, Chem. Mater., 2011, 23, 5282–5286 CrossRef CAS; (c) X. Liu, L. R. Grabstanowicz, S. M. Gao, H. Xu, Z. Z. Lou, W. J. Wang, B. B. Huang, Y. Dai and T. Xu, Nanoscale, 2013, 5, 1870–1875 RSC.
  6. Y. C. Chen, Y. C. Pu and Y. J. Hsu, J. Phys. Chem. C, 2012, 116, 2967–2975 CAS.
  7. X. Li and W. H. Leng, J. Phys. Chem. C, 2013, 117, 750–762 CAS.
  8. J. H. Huang, M. A. Ibrahem and C. W. Chu, RSC Adv., 2013, 3, 26438–26442 RSC.
  9. X. H. Zhang, L. J. Yu, C. S. Zhuang, T. Y. Peng, R. J. Li and G. Li, RSC Adv., 2013, 3, 14363–14370 RSC.
  10. Y. D. Tu, Z. Zhou, R. J. Yan, Y. P. Gan, W. Z. Huang, X. X. Weng, H. Huang, W. K. Zhang and X. Y. Tao, RSC Adv., 2012, 2, 10585–10591 RSC.
  11. X. W. Li, R. G. Song, Y. Jiang, C. Wang and D. Jiang, Appl. Surf. Sci., 2013, 276, 761–768 CrossRef CAS PubMed.
  12. W. W. Zou, J. L. Zhang and F. Chen, Mater. Lett., 2010, 64, 1710–1712 CrossRef CAS PubMed.
  13. K. Lv, J. C. Hu, X. H. Li and M. Li, J. Mol. Catal. A: Chem., 2012, 356, 78–84 CrossRef CAS PubMed.
  14. R. T. Thomas and N. Sandhyarani, RSC Adv., 2013, 3, 14080–14087 RSC.
  15. J. G. Yu and L. Shi, J. Mol. Catal. A: Chem., 2010, 326, 8–14 CrossRef CAS PubMed.
  16. W. Y. Ahn, S. A. Sheeley, T. Rajh and D. M. Cropek, Appl. Catal., B, 2007, 74, 103–110 CrossRef CAS PubMed.
  17. H. L. Liu, Y. Zhou, H. Y. Huang and Y. Y. Feng, Desalination, 2011, 278, 434–437 CrossRef CAS PubMed.
  18. D. F. Qiu, K. C. Liu, Z. J. Jiao, Q. Z. Huang, H. Z. Shi and M. Li, Mater. Lett., 2013, 97, 21–23 CrossRef CAS PubMed.
  19. (a) S. Sreeramulu, S. L. Gande, M. Göbel and H. Schwalbe, Angew. Chem., Int. Ed., 2009, 48, 5853–5855 CrossRef CAS PubMed; (b) H. R. Seo, W. D. Seo, B. J. Pyun, B. W. Lee, Y. B. Jin, K. H. Park, E. K. Seo, Y. J. Lee and Y. S. Lee, Chem.-Biol. Interact., 2011, 193, 34–42 CrossRef CAS PubMed.
  20. H. Morita, Y. Hirasawa, A. Muto, T. Yoshida, S. Sekita and O. Shirota, Bioorg. Med. Chem. Lett., 2008, 18, 1050–1052 CrossRef CAS PubMed.
  21. J. Y. Li, X. M. Wang, H. Jiang, X. H. Lu, Y. D. Zhu and B. A. Chen, Nanoscale, 2011, 3, 3115–3122 RSC.
  22. (a) X. J. Dai, Y. S. Luo, W. D. Zhang and S. Y. Fu, Dalton Trans., 2010, 39, 3426–3432 RSC; (b) Z. Q. Tan, K. Sato, S. Takami, C. Numako, M. Umetsu, K. Soga, M. Nakayama, R. Sasaki, T. Tanaka, C. Ogino, A. Kondo, K. Yamamoto, T. Hashishin and S. Ohara, RSC Adv., 2013, 3, 19268–19271 RSC.
  23. Z. L. He, W. X. Que and Y. C. He, RSC Adv., 2014, 4, 3332–3339 RSC.
  24. K. Takahashi and H. Yui, J. Phys. Chem. C, 2009, 113, 20322–20327 CAS.
  25. C. Y. Song, W. J. Yu, B. Zhao, H. L. Zhang, C. J. Tang, K. Q. Sun, X. C. Wu, L. Dong and Y. Chen, Catal. Commun., 2009, 10, 650–654 CrossRef CAS PubMed.
  26. D. A. Panayotov and J. T. Yates Jr, Chem. Phys. Lett., 2005, 410, 11–17 CrossRef CAS PubMed.
  27. R. Varadaraj, H. Schaffer, J. Bock and P. Valint Jr, Langmuir, 1990, 6, 1372–1376 CrossRef CAS.
  28. Y. Huang, W. K. Ho, S. C. Lee, L. Z. Zhang, G. S. Li and J. C. Yu, Langmuir, 2008, 24, 3510–3516 CrossRef CAS PubMed.
  29. X. Y. Li, Z. R. Zhu, Q. D. Zhao and S. M. Liu, Appl. Surf. Sci., 2011, 257, 4709–4714 CrossRef CAS PubMed.
  30. Y. Ou, J. D. Lin, H. M. Zou and D. W. Liao, J. Mol. Catal. A: Chem., 2005, 241, 59–64 CrossRef CAS PubMed.
  31. C. Wu, H. Chang and J. Chen, J. Hazard. Mater., 2006, 137, 336–343 CrossRef CAS PubMed.
  32. J. G. Yu, G. H. Wang, B. Cheng and M. H. Zhou, Appl. Catal., B, 2007, 69, 171–180 CrossRef CAS PubMed.
  33. (a) J. M. Hermann, Catal. Today, 1999, 53, 115–129 CrossRef; (b) S. Parra, V. Sarria, S. Malato, P. Peringer and C. Pulgarin, Appl. Catal., B, 2000, 27, 153–168 CrossRef CAS.
  34. A. P. Xagas, M. C. Bernard, A. H. L. Goff, N. Spyrellis, Z. Loizos and P. Falaras, J. Photochem. Photobiol., A, 2000, 132, 115–120 CrossRef CAS.
  35. H. F. Cheng, B. B. Huang, Y. Dai, X. Y. Qin and X. Y. Zhang, Langmuir, 2010, 26, 6618–6624 CrossRef CAS PubMed.
  36. C. D. Valentin, G. Pacchioni and A. Selloni, Chem. Mater., 2005, 17, 6656–6665 CrossRef.

Footnote

Electronic supplementary information (ESI) available. See DOI: 10.1039/c4ra00179f

This journal is © The Royal Society of Chemistry 2014
Click here to see how this site uses Cookies. View our privacy policy here.