DOI:
10.1039/C4RA00176A
(Paper)
RSC Adv., 2014,
4, 11673-11679
Lithium-ion storage performance of camphoric carbon wrapped NiS nano/micro-hybrids†
Received
8th January 2014
, Accepted 14th February 2014
First published on 14th February 2014
Abstract
Camphoric carbon wrapped NiS powders have been profitably exploited to fabricate high surface area electrodes for Li storage. The NiS morphology showed a network of interconnected nanoscale units with rod like profiles which terminated into needle-like apexes spanning diameters of about 50–80 nm. These particles were pyrolyzed using a camphoric solution to form a carbon sheath wrapping. These carbon functionalized NiS powders were processed into high-surface-area cathodes for a fully functional coin cell unit. A detailed study was performed to elucidate the effect of carbon content on the performance of these coin cells. BET surface area analysis revealed that these carbon sheathed NiS could exhibit a high surface area of 32 m2 g−1 compared to pristine powders which exhibited surface area values of 20 m2 g−1. From the analysis of relevant electrochemical parameters, an intrinsic correlation between the specific capacity, internal resistance and temperature has been deduced. Relative contributions of capacitive and diffusion-controlled processes underlying these thin-film electrodes have been mathematically modeled. These thin-film electrodes exhibited specific capacity values as high as 500 mA h g−1 as determined from charge discharge curves. The present study shows that this functional material can provide the advantages of simple processing technique, low cost, and scalability.
Introduction
The demand for high energy density rechargeable batteries for portable electronic devices, electric vehicle systems and dispersed-type energy storage systems has been increasing over the last few years.1 To meet this demand a great deal of effort has been made to develop and design high surface area electrodes with good physico-chemical properties.2 Various materials belonging to transition metal oxides/sulfides, metal hydrides, mixed metal oxides and polymeric materials have been explored for fabricating lithium ion batteries.3,4 Among these materials, NiS is considered to be lucrative because of its good rate capability and stability over a wide range of temperature.5,6 The redox performance of NiS is affected by two parameters: (a) interfacial properties related to its morphology and (b) the ionic/electronic conduction.7 It was observed that at high current densities, NiS can lead to poly-sulfides formation in the electrolyte medium resulting in active mass loss8 affecting the specific capacity. A controlled solution to this problem is to provide short diffusion pathways for ions by employing high surface area electrodes having good current collection property leading to enhanced specific capacities.9,10 Current collection property can be improved through incorporation of secondary phases like different forms of carbon onto cathode materials. Previous studies have shown that employing nano-carbonaceous phases like activated carbon (AC),11 carbon nanotubes (CNTs)12 and graphene13 with metal oxides/sulfides could improve the power and energy density values compared to pristine electrodes. For instance, Mahmood et al. showed improved electronic properties for graphene/NiS composite electrodes where the specific capacity was increased to ∼20% as compared to pristine NiS particles.14 To our best knowledge this is the only study where carbonaceous phases like graphene have been exploited for improving the current collection properties of NiS anodes in lithium ion batteries. This study is unique, since graphene was functionalized by anchoring NiS nanoparticles through hydrothermal technique. Although these functional materials can make promising anodes in lithium ion batteries, their use as cathode gets limited because of reduced active participation of NiS. Further, it is difficult to produce large scalable high surface area electrode areas using graphene.15,16 This is mainly because the graphene without proper surfactant tend to agglomerate (causing reduction in the conductivity)17,18 and restricts the intervening pore volume for the electrolyte percolation19,20 which in turn can affect the specific capacity. Although, these issues can be handled during the processing of the electrodes, the major limitations with graphene is the relatively high degree of complexities involved during the bulk synthesis and the cost.21–24 Attempts have been made to derive conducting forms of nanocarbons from natural sources such as coal tar,25,26 rice husk,27,28 bamboo,29,30 coconut shell,31,32 etc. that are low cost and exhibit excellent current collection properties. Camphor is one of the widely available and low cost sources of carbon.33,34 It has been found that carbon nano-beads of 40–60 nm in size can be easily processed by simple pyrolysis of camphor.35,36 Based on this account, the present study demonstrates the exploitation of NiS nano/micro hybrid structures with spike-like terminations, obtained by template free hydrothermal route. These unique structures were subjected to camphorization through pyrolysis to anchor porous aggregated sheaths of carbon onto NiS clusters. High-quality nanostructured electrodes which are capable to exhibit excellent storage capacity and fast electron transfer kinetics have been demonstrated. A detailed electrochemical characterization has been performed to elucidate the correlation between the Li+ storage performances and the intimate structure of the electrode overlays assembled from the newly developed nano/micro-hybrid clusters.
Experimental
All the chemicals used in the present study were of reagent grade obtained from Nice Chemicals, India. Firstly, 0.005 M of nickel sulfate was completely dissolved in a 60 mL (1![[thin space (1/6-em)]](https://www.rsc.org/images/entities/char_2009.gif) :1) solution of isopropanol and distilled water. To the above solution, 0.015 M thiourea and 10 mL of ammonia were added and stirred for 30 min. The above solution was autoclaved in a Teflon lined container at 160 °C for 24 h. The resultant precipitates were washed with distilled water and dried in air at 60 °C.
:1) solution of isopropanol and distilled water. To the above solution, 0.015 M thiourea and 10 mL of ammonia were added and stirred for 30 min. The above solution was autoclaved in a Teflon lined container at 160 °C for 24 h. The resultant precipitates were washed with distilled water and dried in air at 60 °C.
The synthesized powders were dispersed in camphoric solutions prepared by dissolving different weight proportions of camphor dissolved in ethanol. Each of the batches of powders were pyrolyzed in air to obtain the carbon sheathed NiS powders.
The amount of carbon content deposited on each batch of pyrolyzed NiS powders were determined using CHN analysis based on which the samples were designated as NC-1, NC-2 and NC-5. Here N and C represent nickel sulfide and carbon respectively and number indicates the carbon content.
The morphology was analyzed with scanning electron microscopy (SEM-JEOL, Japan) and high resolution transmission electron microscopy (HR-TEM-SAED, Model: JEOL, JEM-2100F). Phase analysis of the obtained powders was done using X-ray diffractometry (XRD, Pert Pro Analytical), Raman spectroscopy (WITEC ALPHA 300 RA) and X-ray photon spectroscopy (XPS, Shimadzu, Japan). Surface area measurement was done using BET analyses (Micromeritics Instrumentation, USA).
The prepared powders were pelletized and fabricated into cathodes in a coin cell unit. Lithium foils were used as anodes. The electrolyte used was 1 M LiTFSI (lithium tris fluoro sulfonimide) in a mixture of (1:1) DME (dimethyl ether) and DOL (dioxolane). Cyclic voltammetry (CV), charge–discharge (at different C-rates) and electrochemical impedance spectroscopy (EIS) studies were performed using an electrochemical workstation (Autolab, Model: Newport) to evaluate the current density (mA g−1), specific capacity (mA h g−1) and internal resistance (Ω) respectively.
Results and discussion
Phase and morphological analysis
Fig. 1(a) & (b) shows the SEM and TEM images displaying the morphology of the camphorized NiS nanospiked clusters subjected to pyrolysis. SEM images did not show the presence of carbon phases possibly due to the phase contrast and nano-size. TEM images (Fig. 1(b)) of these clusters showed carbon sheath like wrapping being formed on the surface. The clusters showed the nanospikes exhibiting a diameter between 50–80 nm. Higher magnifications of this layer seem to show continuous sheet like structure with no distinct boundaries. HR-TEM (Fig. 1(c)) images of the interface showed two distinct phases of crystalline carbon and NiS exhibiting an inter-planar spacings corresponding to (∼0.15 nm) and (∼0.2 nm) respectively. This was confirmed from the XRD (Fig. 2) where peaks corresponding to pure phases of NiS (JCPDS file number 86-2281) (Fig. 2(a(i))) and presence of graphite in NC samples were observed (JCPDS file number 75-2078) (Fig. 2(a(ii))). No secondary phases other than carbon and NiS were recorded. Raman analysis (Fig. 2(b)) of the NC samples revealed that the carbon wraps were graphitic in nature which was confirmed from the presence of higher G peaks.37
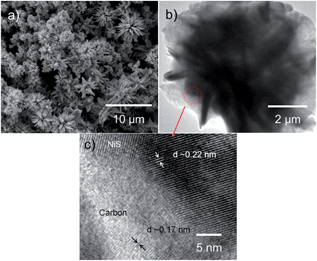 |
| | Fig. 1 (a) SEM, (b) TEM images of camphorized NiS nanospiked clusters subjected to pyrolysis (c) HR-TEM of the interface between the carbon and NiS. | |
 |
| | Fig. 2 (a) XRD of (i) NiS and (ii) NC-2 samples, (b) Raman analysis of NC-2 samples. | |
The possible reaction mechanism resulting in the formation of these nanospiked clusters38,39 can be described using the following reactions
| | |
SC(NH2)2 + 2H2O → H2S + 2NH3 + CO2
| (1) |
| | |
Ni2+ + NH3 → [Ni (NH3)4]2+
| (2) |
| | |
NH3 + H2O → OH− + NH4+
| (3) |
| | |
H2S + 2OH− → S2− + 2H2O
| (4) |
| | |
[Ni(NH3)4]2+ + S2− → NiS + NH3
| (5) |
Thiourea (SC(NH2)2) is pivotal in the formation of the NiS nanospiked clusters acting as a structure directing agent. Thiourea decomposes at a temperatures of 160 °C to produce S2− based anions that react with Ni2+ cations in a slow reaction process to nucleate as NiS particles (reactions (1)–(5)). SC(NH2)2 gets absorbed on facets of these nucleating NiS particles. Meanwhile, Ni2+ in the solution can react with NH4+ to form [Ni(NH3)4]2+ complex. It is anticipated that this complex reacts with the S2− originating from the hydrolysis of SC(NH2)2 on the high surface energy planes facilitating the growth of nanospikes. This hydrothermal reaction between [Ni(NH3)4]2+ and S2− can result in the formation of hierarchical NiS nanospiked clusters. Similar formation mechanisms have been reported for other chalcogenide systems like CuS and WS2. The basic structure of camphor has a hexagonal ring like structure which can easily break into C–H, C![[double bond, length as m-dash]](https://www.rsc.org/images/entities/char_e001.gif) O and/or C–C bonds of pentagonal ring during pyrolysis.35 The pentagonal ring like structure have carbon atoms twisted in the hexagonal ring such that three atoms lie on one plane and the other three lie on separate plane resulting in the nucleation of carbon nanoparticles with a graphitic outer layer which can agglomerate to form a continuous sheath like structure over NiS. The schematic illustration of the formation process of the NC clusters is shown in Fig. 3.
O and/or C–C bonds of pentagonal ring during pyrolysis.35 The pentagonal ring like structure have carbon atoms twisted in the hexagonal ring such that three atoms lie on one plane and the other three lie on separate plane resulting in the nucleation of carbon nanoparticles with a graphitic outer layer which can agglomerate to form a continuous sheath like structure over NiS. The schematic illustration of the formation process of the NC clusters is shown in Fig. 3.
 |
| | Fig. 3 Schematic representation on the formation of nanospiked clusters. | |
Electrochemical behavior
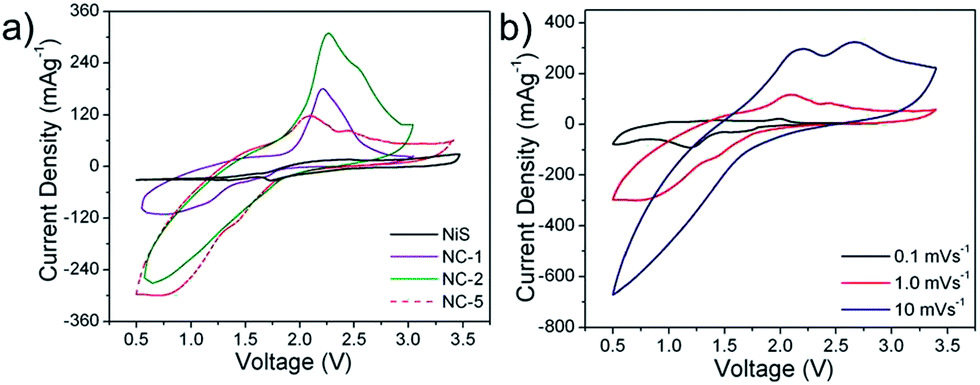
In order to evaluate the electrochemical performance of different NC samples, CV tests at scan rate of 1 mV s−1 were performed in potential range from 0.5–3.5 V (Fig. 4) using a coin cell set up against lithium as anodes in 1 M LiTFSI (lithium tris flouro sulfonimide) based electrolyte in 1:1 DME (dimethyl ether):DOL (dioxolane) solvents.
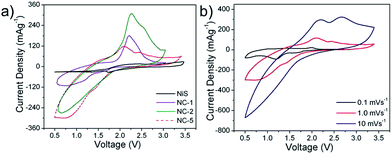 |
| | Fig. 4 (a) CV curves of NiS and NC samples and (b) CV curves of NC-2 electrodes at different scan rates. | |
Influence of carbon content
The content of carbon on NC-1, NC-2, and NC-5 electrodes were determined to be 1.1 ± 1.0, 2.2 ± 1.9, 5.3 ± 3.1 wt% respectively, from the CHN analysis based on which these designations were done. It was observed that the redox activity of these NC electrodes were more prominent in the case of NC-2 as compare to NC-1 and NC-5. These electrodes showed asymmetry in the redox patterns making it tend towards more battery like behavior. Similar asymmetric curves have been reported for NiS systems in LiPF6 based electrolyte systems.40,41 Such an asymmetry can be attributed to a potential difference between the working potentials of the anode and cathode. In a symmetric system such as in a capacitor where both electrodes are similar the additional working potential window tends to zero. That is ΔE1 = −ΔE2 due to the similar charge on positive and negative electrodes and ωβ = ωα; where ωβ and ωα are the work functions of the positive and negative electrode respectively.42,43 The dissociation energy of the electrolyte is also pivotal in determining the potential window. On the other hand, for an asymmetric system such as a battery, the work function difference of both the anode and cathode also plays a role in the operation potential. This work function difference with intermediate reactions can open an operation voltage larger than dissociation energy of the electrolyte, which cause asymmetry (Fig. 4(a)). For all the above electrodes the redox reactions can be represented as:44| | |
2NiS + 4Li+ + 4e− ↔ 2Li2S + 2Ni
| (6) |
It was observed that the current density initially increases when the mass fraction of carbon sheaths increases up to 2 wt% i.e. NC-2 coin cells showed the best performance and beyond this point, further increasing of carbon i.e. NC-5 electrodes exhibited lower redox performance and corresponding current density (Fig. 4(a)). This decrease could be mainly attributed to the reduced NiS content which decreases redox active sites available on the electrode.
The improvement in electrochemical performance of the NiS on anchoring with carbon sheaths on its surface can be attributed to the combined influence of different mechanisms such as increase surface area (see ESI Fig. ESI-1†) and conductivity of the electrode overlay which is predominated by the relative ability of electrons to jump the gap between closely-spaced aggregates (electron tunneling) and by graphitic conduction as observed in other carbon composite systems.45 XPS analysis (Fig. ESI-2†) showed that indeed these anchored carbon sheaths exhibited sp2 hybridization states which may be primarily responsible for its high conductivity.
CV studies showed that the relative mass fraction of carbon is of critical importance because, at low loadings, the average inter-aggregate gap could be large for the carbon sheaths to influence the conductivity of the electrode. As the loading is increased (in case of NC-5), a percolation threshold is possibly reached whereby the conductivity increases rapidly to a limiting value i.e. carbon predominates over NiS. Thus, the further electrochemical characterization were performed on NC-2 electrodes.
Influence of scan rates
CV curves of the NC-2 electrodes were further recorded at different scan rates (Fig. 4(b)). Interestingly, for lower scan rates, a more prominent redox pattern was observed. For each scan rate the CV curves showed similar pattern but it was apparent that the total current increased with increasing scan rate. This can be co-related to the dependence of the diffusion layer thickness at the surface-electrolyte interface (SEI) to the scan rate.46,47 At slower scan rates the diffusion layer will grow much further from the electrode in comparison to a fast scan. Thus the flux to the electrode surface is considerably smaller at slow scan rates. As the current and voltage is proportional to the flux towards the electrode the magnitude of the current and voltage window will be lower at slow scan rates and higher at high rates. Distinct peaks were identified on the CV pattern corresponding to different states of reactions. These intermediate multiple redox stages can be shown with the following reactions (reaction (7)–(9)):44| | |
3NiS + 2Li ↔ 4Ni3S2 + Li2S
| (7) |
| | |
Ni3S2 + 4Li ↔ 3Ni + 2Li2S
| (8) |
The formation of these intermediate multiple stages can be attributed to the release of two or more electrons during the redox process.48 The participation of each electron in a redox reaction can contribute to distinct peaks in CV. Although at higher scan rates, these distinct localized redox centers appear as a uni-redox couple, these peaks seem to deconvolute at lower scan rates.
Faradic and non-faradic contributions
In order to estimate the total faradic (diffusion controlled) and non-faradic (double layer capacitance) contributions from NiS and carbon in NC-2 samples, an empirical model proposed by Wang et al.49,50 was employed. The faradic contribution arises from the charge transfer process in the electrolyte due to the ionic mobility. Since carbon is anchored on to NiS, the possibility of double layer mechanism for charge storage cannot be overruled. Thus it is assumed that the area under the CV curve represents the total charge originating from faradic and non-faradic processes. This can be further explained using the power law:51where ν is the scan rate, and both ‘a’ and ‘b’ are adjustable parameters. The parameter ‘b’ is determined from the slope of the linear plot of logi versus logν (Fig. 5(a)) for all samples). Slope b = 1 for double layer capacitive processes. Thus
 |
| | Fig. 5 (a) Linear plot of logi versus logν, (b) the slopes versus voltage plots, (c) quantitative representation of the capacitive and non-capacitive contributions to the current response. | |
While for the ideal diffusion-controlled faradic process, the slope b = 1/2 and satisfies Cottrell's equation:35
The plot of the slopes versus voltage was done (Fig. 5(b)). It was observed that the slope was ∼0.5 at peak potentials indicating the pre-dominance of the faradic process to overall charge storage. However, the slope value was observed to be ∼1 at other potentials indicating contribution of double layer mechanism. Therefore, the current response ‘i’ at a given potential, V, is the sum of two contributions arising from the double layer and intercalation of Li+.
The scan rate dependence of CV was used to determine quantitatively the capacitive and non-capacitive contributions to the current response following the Cottrell equation52 (Fig. 5(c)). For NC-2 samples, the diffusion controlled faradic processes and capacitive contributions were estimated to be 60–80% and 20–40%, respectively.
Constant current discharge and cycling behavior
The constant current discharging performance of the NC-2 electrodes at different current densities of 75 mA g−1, 15 mA g−1 and 7.5 mA g−1 were obtained (Fig. 6(a)). From the discharge profiles two distinct plateau regions were observed. These plateau regions can be corresponded to the multiple reduction peaks observed during CV (see Fig. 4(b)).
 |
| | Fig. 6 (a) Constant current discharging performance of the NC-2 electrodes at different current densities, (b) constant discharge of the NC-2 electrodes at 1st and 100th cycles and (c) specific capacity vs. cycle number. | |
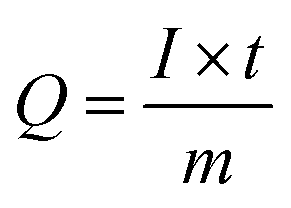
The specific capacity (Q, mA h g−1) was calculated from the following equation:53
| |
 | (iv) |
where
I is the discharge current (mA),
t is the discharge time (h),
m is the mass of the active materials (g).
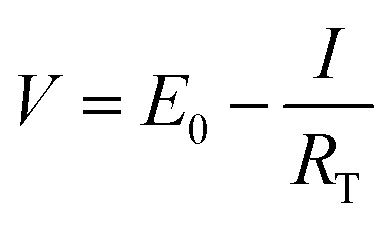
Although the basic patterns of the plots at different discharge current densities remained similar, the voltage plateau at higher current densities was found to be shorter in duration. This decrease in the voltage plateau at higher current density was reflected in the specific capacity values ‘Q’. The ‘Q’ values calculated at 75 mA g−1, 15 mA g−1 and 7.5 mA g−1 were found to be 180 mA h g−1, 280 mA h g−1 and 500 mA h g−1, respectively. This decrease in the ‘Q’ values could be explained on the basis of the following equation:54
| |
 | (v) |
where
E0 is the equilibrium potential,
I the discharge current and
RT is the total internal resistance of the cell. This means that at higher
I, the output voltage ‘
V’ across the cell is reduced, thereby reducing the discharging time which is reflected in the ‘
Q’.
To study the cycling stability of the NC-2 electrodes constant charge discharge were performed out at 15 mA g−1 for 100 cycles from 3.2 V to 0.5 V. The 1st and 100th cycle have been shown in Fig. 6(b). The specific capacity reduced from 290 mA h g−1 to 225 mA h g−1 (∼20%) after the 100th cycle Fig. 6(c). This can be attributed to a multiple factors such as structural stability, electrode dissolution, irreversible by-products (e.g.: polysulfides) and dendrite formation on lithium.55,56
Impedance spectroscopy measurements and equivalent circuit modelling
AC impedance measurements were performed on the coin cells in order to verify the effect of carbon on the electronic conductivity of the NiS electrode. AC impedance spectroscopy was conducted by applying a sine wave of 300 mV amplitude over a frequency range of 100 kHz to 0.1 Hz. The Nyquist plots for the NiS and NC-2 electrodes are shown in Fig. 7. Both spectra comprised of two semicircular regions at high- and medium-frequency ranges and a linear region tilted at ∼45° angle to the real axis at low frequency. The impedence spectra of both electrodes were modelled by the equivalent circuit (Fig. 7 (inset)) using frequency response analyser which corresponded to a second order transient response behaviour. In this equivalent circuit, Rs represents the ohmic resistance of the electrolyte, membrane and electrode, corresponding to the high frequency intercept of the semicircle with the horizontal axis. CSEI and RSEI are the capacitance and the interfacial resistance of the solid-electrolyte interface layer which can be attributed to the reaction between the electrolyte and the surface of the electrode, corresponding to the first semicircular region at high frequency region. This high frequency semicircle is assigned to Li+ diffusion through the SEI layer of the active material. Cdl and Rct are the double layer capacitance and the charge transfer resistance, corresponding to the second semicircular at medium frequency. The second semicircle can be corresponded to charge transfer kinetics, and the impedance connected with Li+ transport in the solid phase appears in the low frequency range. Similar results have been reported in literature previously.57–59 The linear region at ∼45° to the imaginary Z axis at low frequency represents the Warburg impedance (W) and represents the diffusion of Li+ within the bulk anode/electrode.60 From the Nyquist plots, it is observed that the semicircle diameter of NC-2 is lesser than that of NiS coin cells, implying the charge transfer resistance (Rct) of NC-2 (∼2 Ω) is smaller than that of NiS coin cells (∼5.5 Ω). This result reveals that the transfer rate of electrons in NC-2 is higher than NiS, and carbon anchoring indeed improves the surface electronic conductivity of NiS.
 |
| | Fig. 7 The Nyquist plots for the NiS and NC-2 electrodes (inset – equivalent circuit). | |
Conclusions
The present study investigates the lithium storage performance of camphoric carbon sheath wrapped NiS nano/micro hybrids for batteries. The NiS nano/micro clusters were constructed using a low temperature hydrothermal method, wherein several nanospikes assembled to form these clusters. These clusters were then uniformly wrapped with camphoric carbon sheath on its surface through a simple pyrolysis technique. These camphorized NiS samples were employed as cathode against lithium in a fully functional coin cell. It was observed that anchoring of these carbon sheath onto the NiS helps in reducing the charge transfer resistance thereby increasing the charge transport properties across the electrode overlay. CV studies showed these carbon wrapped NiS nano/micro hybrids exhibiting higher current densities compared to pristine NiS clusters. The first discharge capacity for these carbon based NiS systems were found to be ∼500 mA h g−1. An equivalent circuit was deduced for these systems using a fit and simulation technique using Nyquist plots which demonstrated second order transient response. The performance of these carbon anchored NiS systems are promising considering their low cost and facile fabrication process.
Acknowledgements
Council of Scientific and Industrial Research (CSIR), Government of India is gratefully acknowledged for its financial support.
Notes and references
- C. Lai, K. Huang, J. Cheng, C. Lee, W. Lee, C. Huang, B. Hwang and L. Chen, J. Mater. Chem., 2009, 19, 7277 RSC.
- W. Zhang, J. Hu, Y. Guo, S. Zheng, L. Zhong, W. Song and L. Wan, Adv. Mater., 2008, 20, 1160 CrossRef CAS.
- J. Lia, C. Daniela and D. Wooda, J. Power Sources, 2011, 196, 2452 CrossRef PubMed.
- S. B. Chikkannanavar, D. M. Bernardia and L. Liu, J. Power Sources, 2014, 248, 91 CrossRef CAS PubMed.
- N. Feng, D. Hu, P. Wang, X. Sun, X. Li and D. He, Phys. Chem. Chem. Phys., 2013, 28, 9924 RSC.
- Z. Cao, Y. He, L. Sun and X. Cao, Adv. Mater. Res., 2011, 236–238, 694 Search PubMed.
- J. Wang, S. Chou, S. Chew, J. Sun, M. Forsyth, D. R. MacFarlane and H. K. Liu, Solid State Ionics, 2008, 179, 2379 CrossRef CAS PubMed.
- K. Li, High Energy Electrode Materials for Lithium Sulfur Batteries, University of Technology, Sydney, March, 2012 Search PubMed.
- L. Baggetto, J. Jumas, J. Górka, A. B. Craig and G. M. Veith, Phys. Chem. Chem. Phys., 2013, 15, 10885 RSC.
- Y. Yao, J. Zhang, T. Huang, H. Mao and A. Yu, Int. J. Electrochem. Sci., 2013, 8, 3302 CAS.
- D. Wang, Q. Zeng, G. Zhou, L. Yin, F. Li, H. Cheng, I. R. Gentle and G. Q. M. Lu, J. Mater. Chem. A, 2013, 1, 9382 CAS.
- Y. Shi, Y. Wang, J. I. Wong, A. Y. S. Tan, C. L. Hsu, L. Li, Y. lu and H. Y. Yang, Sci. Rep., 2013, 3, 2169 Search PubMed.
- J. Zhu, D. Wang, L. Wang, W. You and Q. Wang, Int. J. Electrochem. Sci., 2012, 7, 9732 CAS.
- N. Mahmood, C. Zhang and Y. Hou, Small, 2013, 9, 1321 CrossRef CAS PubMed.
- X. Ho and J. Wei, Materials, 2013, 6, 2155 CrossRef CAS.
- V. Singh, D. Joung, L. Zhai, S. Das, S. I. Khondaker and S. Seal, Prog. Mater. Sci., 2011, 56, 1178 CrossRef CAS PubMed.
- L. Rodríguez-Pérez, M. A. Herranza and N. Martín, Chem. Commun., 2013, 49, 3721 RSC.
- J. Luo, J. Kim and J. Huang, Acc. Chem. Res., 2013, 46, 2225 CrossRef CAS PubMed.
- G. Lui, J. Liao, A. Duan, Z. Zhang, M. Fowler and A. Yu, J. Mater. Chem. A, 2013, 1, 12255 CAS.
- M. Park, J. Yu, K. Kim, G. Jeong, J. Kim, Y. Jo, U. K. Hwang, S. Kang, T. Woo and Y. Kim, Phys. Chem. Chem. Phys., 2012, 14, 6796 RSC.
- M. Choucair, P. Thordarson and J. A. Stride, Nat. Nanotechnol., 2009, 4, 30 CrossRef CAS PubMed.
- M. Hakimi and P. Alimard, World Applied Programming, 2012, 2, 377 Search PubMed.
- E. T. Thostenson, Z. Ren and T. Chou, Compos. Sci. Technol., 2001, 61, 1899 CrossRef CAS.
- K. B. K. Teo, C. Singh, M. Chhowalla and W. I. Milne, Encyclopedia of Nanoscience and Nanotechnology, American Scientific Publishers, California, 2003, vol. X, p. 1 Search PubMed.
- X. He, N. Zhao, J. Qiu, N. Xiao, M. Yu, C. Yu, X. Zhang and M. Zheng, J. Mater. Chem. A, 2013, 1, 9440 CAS.
- S. Tong, L. Mao, X. Zhang and C. Q. Jia, Ind. Eng. Chem. Res., 2011, 50, 13825 CrossRef CAS.
- Z. Cao, X. Cao, L. Sun and Y. He, Adv. Mater. Res., 2011, 2101, 239 CrossRef.
- R. Ghosh and S. Bhattacherjee, J. Chem. Eng. Process Technol., 2013, 4, 1 CrossRef PubMed.
- R. Rajbhandari, L. K. Shrestha, B. P. Pokharel and R. R. Pradhananga, J. Nanosci. Nanotechnol., 2013, 13, 2613 CrossRef CAS PubMed.
- A. Boonpoke, S. Chiarakorn, N. Laosiripojana 1, S. Towprayoon and A. Chidthaisong, Journal of Sustainable Energy & Environment, 2011, 2, 77 Search PubMed.
- L. Sun, C. Tian, M. Li, X. Meng, L. Wang, R. Wang, J. Yin and H. Fu, J. Mater. Chem. A, 2013, 1, 6462 CAS.
- M. Rosi, M. P. Ekaputra, F. Iskandar, M. Abdullah and Khairurrijal, AIP Conf. Proc., 2010, 1325, 86 CrossRef CAS PubMed.
- K. Awasthi, R. Kumar, H. Raghubanshi, S. Awasthi, R. Pandey, D. Singh, T. P. Yadav and O. N. Srivastava, Bull. Mater. Sci., 2011, 34, 607 CrossRef CAS PubMed.
- M. Kumar and Y. Ando, Diamond Relat. Mater., 2003, 12, 1845 CrossRef CAS.
- A. Paravannoor, A. S. Nair, R. Ranjusha, P. Praveen, K. R. V. Subramanian, N. Sivakumar, S. V. Nair and A. Balakrishnan, ChemPlusChem, 2013, 78, 1258 CrossRef CAS.
- R. Ranjusha, V. Prathibhaa, S. Ramakrishna, A. S. Nair, P. Anjali, K. R. V. Subramanian, N. Sivakumar, T. N. Kim, S. V. Nair and A. Balakrishnan, Scr. Mater., 2013, 68, 881 CrossRef CAS PubMed.
- R. Krishnan, J. John and B. Manoj, Int. J. Electrochem. Sci., 2013, 8, 9421 CAS.
- W. Dong, X. Wang, B. Li, L. Wang, B. Chen, C. Li, X. Li, T. Zhang and Z. Shi, Dalton Trans., 2011, 40, 243 RSC.
- Q. Pan, K. Huang, S. Ni, F. Yang and D. He, Mater. Res. Bull., 2008, 43, 1440 CrossRef CAS PubMed.
- S. C. Han, K. W. Kim, H. J. Ahn, J. H. Ahn and J. Y. Lee, J. Alloys Compd., 2003, 361, 247 CrossRef CAS.
- N. H. Idris, M. M. Rahman, S. L. Chou, J. Z. Wang, D. Wexler and H. K. Liu, Electrochim. Acta, 2011, 58, 456 CrossRef CAS PubMed.
- J. Chang, M. Jin, F. Yao, T. H. Kim, V. T. Le, H. Yue, F. Gunes, B. Li, A. Ghosh, S. Xie and Y. H. Le, Adv. Funct. Mater., 2013, 23, 5074 CrossRef CAS.
- Z. Fan, J. Yan, T. Wei, L. Zhi, G. Ning, T. Li and F. Wei, Adv. Funct. Mater., 2011, 21, 2366 CrossRef CAS.
- Y. Wang, Q. Zhu, L. Tao and X. Su, J. Mater. Chem., 2011, 21, 9248 RSC.
- A. G. Pandolfo and A. F. Hollenkamp, J. Power Sources, 2006, 157, 11 CrossRef CAS PubMed.
- P. Tomčík, Sensors, 2013, 13, 13659 CrossRef PubMed.
- G. P. Keeley and M. E. G. Lyons, Int. J. Electrochem. Sci., 2009, 4, 794 CAS.
- J. Park, B. Y. Chang, J. Yoo, S. Hong and S. Park, Bull. Korean Chem. Soc., 2007, 28, 1523 CrossRef CAS.
- D. W. Wang, F. Li, M. Liu, G. Q. Lu and H. M. Cheng, Angew. Chem., 2008, 120, 379 CrossRef.
- A. S. Aricò, P. Bruce, B. Scrosati, J. M. Tarascon and W. van Schalkwijk, Nat. Mater., 2005, 4, 366 CrossRef PubMed.
- R. Ranjusha, S. Ramakrishna, A. S. Nair, P. Anjali, S. Vineeth, T. S. Sonia, N. Sivakumar, K. R. V. Subramanian, S. V. Nair and A. Balakrishnan, RSC Adv., 2013, 3, 17492 RSC.
- M. Sathiya, A. S. Prakash, K. Ramesha, J.-M. Tarascon and A. K. Shukla, J. Am. Chem. Soc., 2011, 133, 16291 CrossRef CAS PubMed.
- S. A. Hashim Ali, A. Hussin and A. K. Arof, Ionics, 2003, 9, 432 CrossRef.
- G. Ning, B. Haran and B. N. Popov, J. Power Sources, 2003, 117, 160 CrossRef CAS.
- E. M. Krieger and C. B. Arnold, J. Power Sources, 2012, 210, 286 CrossRef CAS PubMed.
- G. Ning and B. N. Popov, J. Electrochem. Soc., 2004, 151, A1584 CrossRef CAS PubMed.
- M. M. Rahman, J. Wang, D. Wexler, Y. Zhang, X. J. Li, S.-L. Chou and H.-K. Liu, J. Solid State Electrochem., 2010, 14, 571 CrossRef CAS.
- B. L. He, B. Dong and H. L. Li, Electrochem. Commun., 2007, 9, 425 CrossRef CAS PubMed.
- Q.-C. Zhuang, X.-Y. Qiu, S.-D. Xu, Y.-H. Qiang and S.-G. Sun, Lithium Ion Batteries – New Developments, 2012, ch. 8, p. 189 Search PubMed.
- I. S. Kim, G. E. Blomgren and P. N. Kumta, J. Electrochem. Soc., 2005, 152 Search PubMed.
Footnote |
| † Electronic supplementary information (ESI) available: BET analysis of NiS and NC-2 samples, XPS of NC-2 samples (de-convoluted peaks of carbon). See DOI: 10.1039/c4ra00176a |
|
| This journal is © The Royal Society of Chemistry 2014 |
Click here to see how this site uses Cookies. View our privacy policy here.