TiO2–graphene nanoparticle based electrochemical sensor for the bimodal-response detection of 4-chlorophenol
Xue Bai*,
Xin Huang,
Xiaoyuan Zhang,
Zulin Hua,
Chaofan Wang,
Qin Qin and
Qi Zhang
Key Laboratory of Integrated Regulation and Resource Development on Shallow Lake of Ministry of Education, College of Environment, Hohai University, Nanjing 210098, P. R. China
First published on 26th February 2014
Abstract
An electrochemical sensor for the sensitive and convenient determination of 4-chlorophenol (4-Cp) was developed based on TiO2-modified graphene nanoparticle casting onto screen-printed carbon electrodes (TiO2–graphene oxide (GO)/SPE). A facile hydrothermal method was performed to prepare the novel TiO2–GO nanoparticles. Scanning electron microscopy, X-ray photoelectron spectroscopy, and electrochemical impedance spectroscopy were carried out to characterize in detail the formed TiO2–GO nanoparticles. TiO2 was homogenously deposited on the graphene substrate, and the nanoparticles possessed high surface areas and fast electron transfer rates, which could greatly improve their electrocatalytic performance. Cyclic voltammetry was performed to evaluate the electrochemical properties of TiO2–GO/SPE toward 4-Cp, and the TiO2–GO film exhibited a distinctly higher activity for bimodal-response detection of 4-Cp than the GO film. At the selected experimental conditions, the oxidation peak currents were proportional to 4-Cp concentrations over the range of 0.05 μM to 20.0 μM and 20.0 μM to 200.0 μM. The lower limit of detection was 0.02 μM. The obtained results suggested that the developed sensor can be successfully used to determine 4-Cp in a concentration range within environmental levels.
1. Introduction
Since the 1960s, chlorophenols have been recognized as environmental pollutants because of their tendency to bioaccumulate in the food chain and their toxicity towards humans and most aquatic organisms.1,2 They are widely used as preservative agents for wood, paints, vegetable fibers, and leather, as well as disinfectants. Moreover, they are also widely used as herbicides, fungicides, and insecticides and as intermediates in pharmaceutical and dye production.3,4 Among these chlorophenols, 4-chlorophenol (4-Cp) is one of the most studied chlorophenols because of its toxicity and broad antimicrobial properties.5 The United States Environmental Protection Agency has already listed 4-Cp as one of the priority pollutants.6 Therefore, the identification and detection of 4-Cp are of great importance.Many methods have been developed to determine 4-Cp, including gas chromatography,7 high-performance liquid chromatography,8 high-performance capillary zone electrophoresis,9 and spectrophotometry.10 These methods have high sensitivity and selectivity, but most of them have particular disadvantages, such as time-consuming preparation, expensive instruments, and toxic solvents. To overcome these inherent shortcomings, the electrochemical method11–13 has proven to be a good option. This method is sensitive, reproducible, stable, easy to use, and low-cost.
The direct electrochemical oxidation of 4-Cp is known to be kinetically sluggish, and a high overpotential is required at different bare electrodes, such as gold,14 platinum,15 glassy carbon,16 and boron-doped diamond17 electrodes. Therefore, the working electrodes used in conventional electrochemical method always need surface modification to decrease the overpotential and enhance the electrochemical response of the objective molecules.18–20 In recent years, great efforts have been focused on developing electrochemical sensors for 4-Cp by using different kinds of modified electrodes. These electrodes are mostly based on enzymes21 and noble metal nanoparticles.22 The disadvantages of enzyme-modified electrodes include the instability and complexity of immobilization, which cause poor sensor reproducibility. Moreover, noble metal (i.e., platinum, gold, and silver) nanoparticle-modified electrodes are expensive.
TiO2 nanoparticles can be used as an electrocatalytic material because it has a large surface area, strong adsorptive ability, subtle electronic properties, and catalytic ability.23,24 It is also easy to obtain and much cheaper than other catalysts.25 These excellent properties indicate that TiO2 nanoparticles can be used a potential electrode modification material for electrochemical sensing applications. TiO2 nanoparticles can be easily immobilized on the surface of metal electrodes,26 but anchoring them directly on the surface of carbon electrodes is difficult.
Graphene, a new form of carbon, is a 2D sheet of carbon atoms bonded through sp2 hybridization. Given its novel properties, such as large specific surface area (2630 m2 g−1), high electrical conductivity (103 S m−1 to 104 S m−1), and high thermal and mechanical properties, it is an ideal 2D catalyst support to anchor metal oxide nanoparticles, which offers versatile selective catalytic or sensing performances.27 The structure of graphene makes it easier to be modified on the carbon electrodes through π–π interaction. Given these advantages, graphene can be used as a support to disperse and stabilize TiO2 nanoparticles.
This study presents a hydrothermal preparation of TiO2–graphene oxide (GO) nanoparticles to fabricate a novel electrochemical sensor for 4-Cp. This developed sensor could provide a large electrochemically active surface area for 4-Cp adsorption. It could also effectively accelerate the electron transfer between electrode and solution, which could lead to a more rapid and sensitive bimodal current response. The physical and chemical characteristics and electrochemical performances of the prepared sensor were examined, and analysis conditions and interferences were discussed. The TiO2–GO nanoparticle-based electrochemical sensor will be widely used in the fields of environmental detection.
2. Experimental
2.1. Reagents
GO was prepared from natural graphite by using a modified Hummers' method.28 Titanium tetrafluoride (TiF4) was obtained from Sigma-Aldrich (USA). 4-Cp, phenol, 3-nitrophenol, and 3-aminophenol were purchased from Sinopharm Chemical Reagent Co., Ltd (Shanghai, China). All chemicals were of analytical-reagent grade unless otherwise stated and used directly without further purification. Deionized water was used throughout this study. The supporting electrolyte was 0.1 M PBS prepared with Na2HPO4 and NaH2PO4, and the pH was adjusted with NaOH or H3PO4.2.2. Apparatus
Scanning electron microscopy (SEM) images were obtained using a Hitachi S-4800 (Hitachi Ltd, Japan) instrument with a resolution of 1.00 μm and an accelerating voltage of 5.0 kV. Transmission electron microscopic (TEM) image was taken on a JEM-2010 UHR microscope from Japan. X-ray photoelectron spectroscopy (XPS) analysis was carried out using an AXIS-Ultra instrument from Kratos Analytical with monochromatic Al Kα radiation (225 W, 15 mA, 15 kV) and low-energy electron flooding for charge compensation. X-ray powder diffraction (XRD) pattern of the sample was performed on a Bruker D8 Advance X-ray diffractometer from Germany. Raman measurement was operated with a JY HR800 Raman spectrometer from France. Electrochemical impedance spectroscopy (EIS) experiments were performed using a CHI 660E electrochemical workstation (Shanghai Chenhua Instrument Co. Ltd, China). The solution was 0.1 M KCl containing 5 mM K3Fe(CN)6 and 5 mM K4Fe(CN)6. All electrochemical measurements were performed with a CHI 660E electrochemical workstation controlled by a personal computer. A conventional three-electrode system was used for all electrochemical measurements. This system is equipped with the prepared screen-printed carbon electrode (SPE) as the working electrode, a saturated Ag/AgCl electrode as the reference electrode, and a platinum wire as the counter electrode.2.3. Preparation of TiO2–GO nanoparticle
The hydrothermal preparation of TiO2–GO nanoparticle was carried out using the following procedure. A total of 5 mg of GO was dissolved in a mixture of 10 mL of ethanol and 20 mL of deionized water under sonication for 1 h to re-exfoliate the GO. Approximately 40 mL of 0.002 M TiF4 was then added to the GO suspension, and the mixture was alternately ultrasonicated and stirred for another 1 h. The resulting mixture was heated in an oven at 60 °C for 5 h until the suspension showed a uniform light gray color. The mixture was transferred to a Teflon-lined autoclave (30 mL capacity), heated at 200 °C for 20 h, and cooled naturally. The gray precipitates were then collected through centrifugation, washed several times with ethanol and deionized water, and dried at ambient condition to obtain the final products.2.4. Preparation of modified electrode
The as-prepared TiO2–GO nanoparticle (2.0 mg) was dispersed in DMF (1.0 mL) to form a homogenous suspension. To obtain the TiO2–GO-modified SPE (TiO2–GO/SPE), 5 μL of the suspension was placed on the SPE surface and dried at room temperature. For comparison, 5 μL of the GO suspension in DMF (1.0 mL) was cast on the SPE and dried at room temperature to obtain the GO-modified SPE (GO/SPE).3. Results and discussion
3.1. Characterization of TiO2–GO nanoparticle
The microstructures of the obtained samples were investigated via SEM (Fig. 1). Fig. 1A and B show that the bare SPE surface exhibited an amorphous morphology. The GO/SPE electrode showed a typical crumpled and wrinkled graphene sheet structure. This unique structure of GO sheets provides a large rough surface as scaffold for further modification.29–31 The SEM image of the TiO2–GO/SPE is shown in Fig. 1C. By contrast, TiO2 crystals were formed with a uniform particle size on the graphene substrates. In addition, Fig. 2 shows the typical TEM image of the synthesized TiO2–GO nanocomposite. It also can be seen that a large number of TiO2 are attached onto the surface of GO nanosheets with a uniform particle size. Highly dispersed TiO2 on supports with a large surface area would be beneficial to improve catalytic activity32 and sensor sensitivity.33 | ||
| Fig. 1 SEM images of the working surface area of (A) bare SPE, (B) GO/SPE, and (C) TiO2–GO/SPE. The acceleration voltage was 5.0 kV; 1.00 μm resolution was used for all the SEM images. | ||
 | ||
| Fig. 2 The TEM image of TiO2–GO composite film. | ||
XPS measurements were conducted to investigate the chemical state of TiO2–GO and the interactions between TiO2 and GO in the composites, and the results are shown in Fig. 3. The survey spectrum of TiO2–GO shows the presence of Ti 2p, C 1s, and O 1s, as shown in Fig. 3A. The Ti oxidation state in TiO2–GO is shown in Fig. 3B. Two bands located at 459.8 and 465.3 eV can be recognized and assigned to the distinct Ti 2p3/2 and Ti 2p1/2 signals in the Ti4+ chemical state. These XPS analyses suggest that the TiO2–GO film was successfully cast onto the SPE surface.
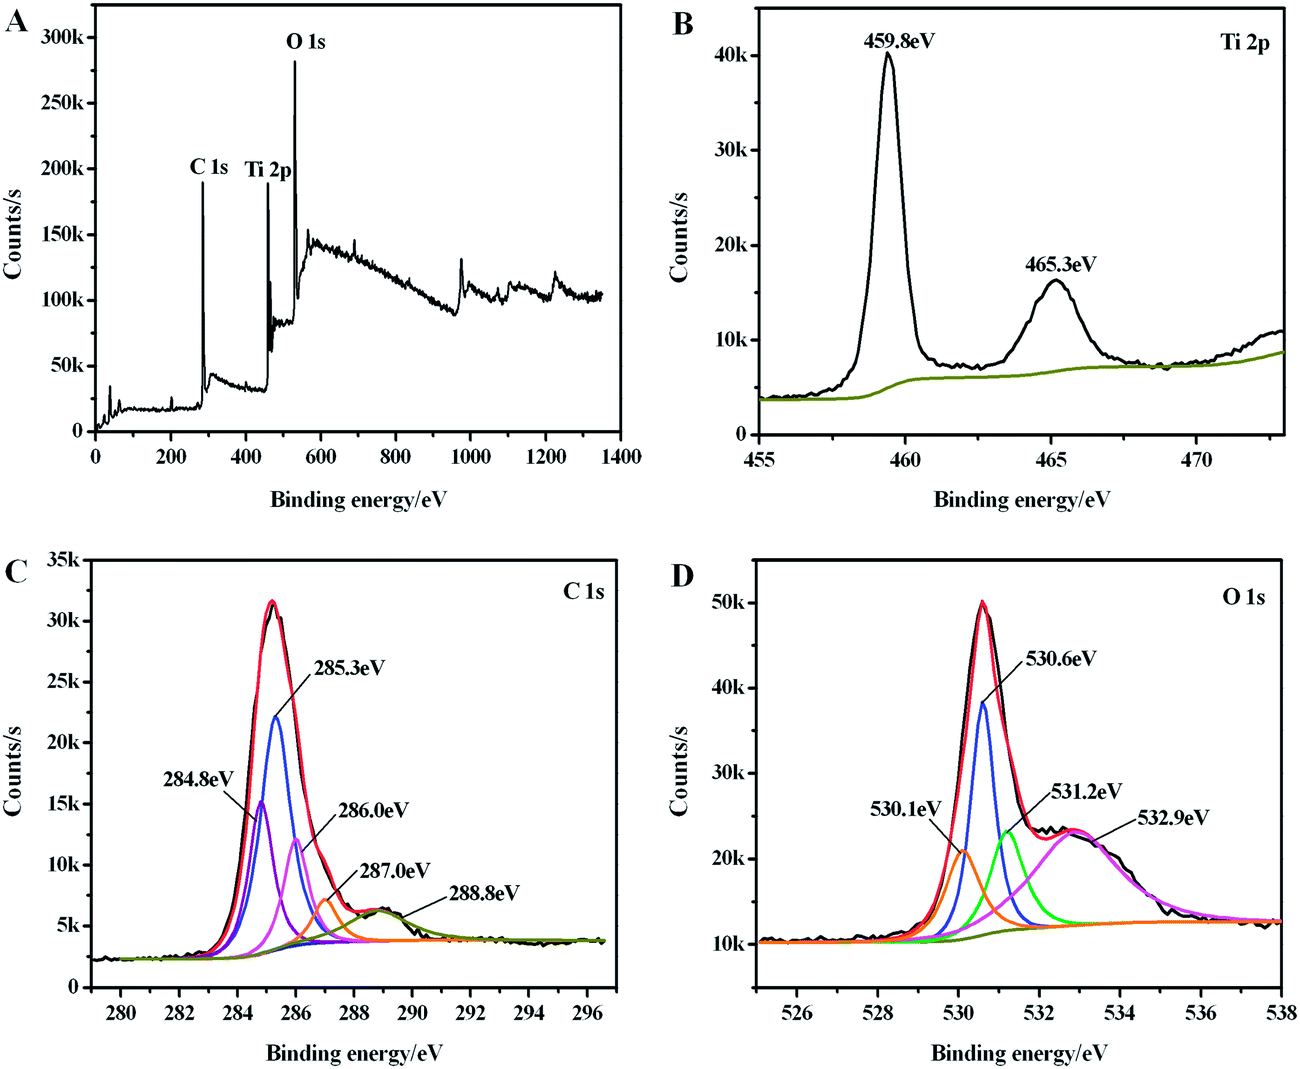 | ||
| Fig. 3 Survey XPS spectra of the TiO2–GO/SPE electrode: wide scan (A) and high-resolution scans for Ti 2p (B), C 1s (C), and O 1s (D). | ||
The higher resolution XPS data of the C 1s peaks and O 1s peaks of TiO2–GO are shown in Fig. 3. From the C 1s XPS spectrum of TiO2–GO (Fig. 3C), the peaks can be resolved into five components that were located at approximately 284.8 (–C–H), 285.3 (–C–C), 286.0 (–C–O), 287.0 (hydroxyl), and 288.8 eV (–C![[double bond, length as m-dash]](https://www.rsc.org/images/entities/char_e001.gif) O). The O 1s peaks can be divided into five components (Fig. 3D). The peaks located at 530.1 and 530.6 eV were attributed to TiO2, and the other peaks were located at approximately 531.2 (–CO) and 532.9 eV (–CO). Notably, these detected peaks were assigned to GO, which could be beneficial for the absorption of objective molecules.34
O). The O 1s peaks can be divided into five components (Fig. 3D). The peaks located at 530.1 and 530.6 eV were attributed to TiO2, and the other peaks were located at approximately 531.2 (–CO) and 532.9 eV (–CO). Notably, these detected peaks were assigned to GO, which could be beneficial for the absorption of objective molecules.34
To investigate the crystalline phase of TiO2, Raman spectroscopy was applied as a powerful tool. Fig. 4A exhibits the typical optical modes of anatase TiO2, namely, Eg(1) peak (146 cm−1), B1g(1) peak (395 cm−1), Eg(2) peak (636 cm−1), and the A1g + B1g(2) modes centered around 514 cm−1, respectively. This result confirms the existence of TiO2 nanoparticles on the electrodes, in agreement with XRD analysis. Furthermore, Fig. 4B shows XRD pattern of TiO2–GO composite. The diffraction peaks show major anatase-phase of TiO2. Peaks located at 25.3°, 36.5°, 37.8°, 48.0°, 53.9°, 55.1°, and 62.7° can be respectively indexed to the (101), (103), (004), (200), (105), (211), and (204) crystal planes of anatase TiO2. All of these structural and morphological characterizations confirm the successful immobilization of TiO2 nanoparticles on the GO.
 | ||
| Fig. 4 (A) Raman spectra of TiO2–GO composite film. (B) XRD patterns of TiO2–GO composite film. | ||
The SPE behavior before and after modification by TiO2–GO was further investigated via EIS at room temperature. The EIS includes semicircular and linear parts, and the electrical equivalent circuits are shown in Fig. 5. The semicircular part at higher frequencies corresponds to the electron transfer limited process, and the diameter is equivalent to charge transfer resistance (Rct). The linear part at lower frequencies corresponds to the diffusion process.35 Fig. 5A shows the impedance spectra in the form of Nyquist diagrams of bare SPE (curve a), GO/SPE (curve b), and TiO2–GO/SPE (curve c) in 0.1 M KCl containing 5 mM K3Fe(CN)6 and 5 mM K4Fe(CN)6. As shown in this figure, the Rct values for bare SPE, GO/SPE, and TiO2–GO/SPE were 23.7, 1.33, and 2.41 kΩ, respectively. After SPE modification with TiO2–GO and GO films, the diameter of these semicircles significantly decreased. The decreased diameter indicated that the impedance of the electrodes greatly decreased in the presence of TiO2–GO and GO films. These results demonstrate that both TiO2–GO and GO films could accelerate the electron transfer between electrode and solution.36
 | ||
| Fig. 5 (A) Nyquist diagrams of bare SPE (a), GO/SPE (b), and TiO2–GO/SPE (c) in 0.1 M KCl containing 5 mM K3Fe(CN)6 and 5 mM K4Fe(CN)6. The frequency range was from 0.01 Hz to 100 kHz. (B) Electrical equivalent circuits. | ||
3.2. Electrochemical behaviors of TiO2–GO/SPE toward oxidation of 4-Cp
Cyclic voltammetry (CV) was conducted to investigate the electrocatalytic activity of TiO2–GO/SPE for the oxidation of 4-Cp. Fig. 6 shows the CVs of SPE, GO/SPE, and TiO2–GO/SPE in the presence of 50.0 μM 4-Cp in 0.1 M PBS (pH 8.0) at a scan rate of 100 mV s−1. No redox peak was obtained at the SPE and GO/SPE, which indicates that the GO film was non-electroactive in the selected potential region. The background current of GO/SPE was higher than that of SPE, which could be attributed to the large specific area of GO.37–39 For the TiO2–GO/SPE, two distinct oxidation peak currents were observed at 0.12 and −0.05 V, which could be attributed to the redox of 4-Cp and 4-chlorophenoxy radicals. These results indicate that TiO2–GO has a high electrocatalytic activity toward 4-Cp oxidation. The 4-Cp oxidation is postulated to begin with the interaction of the 4-Cp molecule with an adsorbed ˙OH, which was formed by the electro-oxidation of a TiO2–H2O site.40,41 In this approach, a 4-chlorophenoxy radical is formed, which can start a polymerization reaction. Radical stabilization occurs by delocalization of the radical center over the aromatic ring.14,42,43 | ||
| Fig. 6 CVs of 50 μM 4-Cp at bare SPE (a), GO/SPE (b), and TiO2–GO/SPE (c) in 0.1 M PBS (pH 8.0). Scan rate: 100 mV s−1. | ||
3.3. Optimization of detection conditions and electro-catalytic activity of TiO2–GO/SPE
Fig. 7 shows that the oxidation peaks of 4-Cp changed when the pH was gradually increased from 4.0 to 12.0. In acidic or neutral solution, only one oxidation peak was observed. When the pH was increased from 8.0 to 10.0, two oxidation peaks were observed. However, the oxidation peaks decreased to just one when the pH was further increased to 12.0. This result can be attributed to the weak 4-Cp, which dissociated into hydrogen ions and 4-chlorophenoxy anion in an aqueous solution (Fig. 8).44 In acidic or neutral solution, most 4-Cp was in molecular form, and the concentration of the 4-chlorophenoxy anion was very low. Consequently, the oxidation peak of 4-Cp could be obtained. When the solution was slightly alkaline, 4-Cp dissociation was advantageous and the 4-chlorophenoxy anion concentration increased. The oxidation peaks of 4-Cp and 4-chlorophenoxy anion can then be observed. Further increasing the pH value resulted in a solution that was almost full of 4-chlorophenoxy anions. Therefore, only one oxidation peak can be observed. In summary, pH 8.0 PBS was used to determine 4-Cp in this experiment. | ||
| Fig. 7 CVs (oxidation peaks) of 50 μM 4-Cp at the TiO2–GO/SPE in different pH PBSs. | ||
 | ||
| Fig. 8 Dissociation process of 4-Cp. | ||
Moreover, the CVs of 50.0 μM 4-Cp at different potential scan rates on the TiO2–GO/SPE are shown in Fig. 9. Both anodic peak current (Ipa) and cathodic peak current (Ipc) values exhibited a linear relationship with a scan rate over the range of 50 mV s−1 to 150 mV s−1. The following linear regression equations were obtained (insert Fig. 9): Ipc1 (μA) = 6.1524 + 0.2433v (mV s−1) (R2 = 0.9973), Ipc2 (μA) = 31.081 + 0.2526v (mV s−1) (R2 = 0.9918), and Ipa (μA) = −41.751 − 0.3157v (mV s−1) (R2 = 0.9904). These results imply that the electrochemical oxidation was an absorption-controlled process for 4-Cp on the TiO2–GO/SPE surface.45
 | ||
| Fig. 9 CVs of 50 μM 4-Cp at the TiO2–GO/SPE with different scan rates (50, 80, 100, 120, and 150 mV s−1) in 0.1 M PBS (pH 8.0). Insert shows the plots of peak current vs. scan rates. | ||
To evaluate further the electrochemical sensing properties of the TiO2–GO/SPE for 4-Cp, CV was performed to observe the relationship between oxidation peak current (Ipa) of 4-Cp and its concentration (C4-Cp). Fig. 10 shows that the oxidation peak currents linearly increased with 4-Cp concentrations over the range of 0.05 μM to 20.0 μM and 20.0 μM to 200.0 μM. The linear regression equations can be expressed as Ipa (μA) = 1.8523C (μM) + 22.181 (R2 = 0.992) and Ipa (μA) = 0.1356C (μM) + 55.542 (R2 = 0.990). A detection limit of 0.02 μM (S/N = 3) was also obtained. From the calibration plot slope and the active electrode surface area, the sensitivities of this sensor in the two linear ranges were calculated to be 1.8523 and 0.1356 A M−1 cm−2.
 | ||
| Fig. 10 (A) CVs obtained at TiO2–GO/SPE in 0.1 M PBS (pH 8.0) containing low concentrations of 4-Cp (from (a to h): 0.05, 0.1, 1.0, 3.0, 6.0, 10.0, 15.0, and 20.0 μM, respectively); inset shows the calibration plot. (B) CVs obtained at TiO2–GO/SPE in 0.1 M PBS (pH 8.0) containing high concentrations of 4-Cp (from (a to g): 20.0, 50.0, 80.0, 110.0, 140.0, 170.0, and 200.0 μM, respectively); inset shows the calibration plot. | ||
To obtain a realistic comparison with previous procedures, the characteristics of different electrochemical sensors for 4-Cp are summarized in Table 1. The proposed sensor showed a relatively wider linear range and lower detection limit. The comparison confirmed that TiO2–GO/SPE was an appropriate platform for the electrochemical sensing of 4-Cp.
| Technique | Electrode | Detection limit (μM) | Linear range (μM) | Reference |
|---|---|---|---|---|
| Chronoamperometry-multiple pulsed amperometry | Graphite–epoxy composite electrode | 10 | 100–500 | 46 |
| Square wave voltammetry | CTAB–montmorillonite modified carbon paste electrode | 0.02 | 0.05–10 | 47 |
| Differential pulse voltammetry | Ag-modified zeolite-expanded graphite–epoxy composite electrode | 14 | 100–600 | 48 |
| Amperometry | Polycrystalline bismuth oxide film modified glassy carbon | 0.005 | 0.015–15 | 49 |
| Cyclic voltammetry | TiO2/GO modified screen-printed electrode | 0.02 | 0.05–200 | This study |
3.4. Repeatability, reproducibility, and stability of TiO2–GO/SPE
The repeatability was evaluated through successive measurements of the same 50 μM 4-Cp for four times at a single TiO2–GO/SPE. After each measurement, the modified electrode was thoroughly rinsed with water, transferred into the blank electrolyte, and scanned in the range of −1.0 V to 1.0 V for five cycles to remove any adsorbate residue. The relative standard deviation (RSD) of 2.4% indicated excellent repeatability. The reproducibility of TiO2–GO/SPE was evaluated with 10 electrodes fabricated at the same conditions. By measuring 50 μM 4-Cp in 0.1 M PBS (pH 8.0), the RSD was calculated to be 2.0%, which suggests the good reproducibility of TiO2–GO/SPE. The response to 50 μM 4-Cp was intermittently tested. After 1, 5, and 15 days at 25 °C, the sensor retained 99.8%, 98.1%, and 94.6%, respectively, of its initial response current. The results showed that TiO2–GO nanoparticles also had a good stability.3.5. Interference study and analytical application
To evaluate the prepared sensor, the influence of particular possible interfering substances was examined by separately adding 10 kinds of species in 0.1 M PBS (pH 8.0) containing 4-Cp of 50 μM; the relative responses are presented in Fig. 11. A great number of inorganic species, such as 100-fold concentration of Cd2+, Hg2+, Cu2+, Pb2+, Ca2+, Mg2+, and Na+ had slight influences on the 4-Cp signals, with deviations below 5.0%. Phenol (5000 μM) and several substitutes of phenols, such as 3-nitrophenol and 3-aminophenol, had more effects on the 4-Cp signal, especially phenol, which causes a 15.2% reduction in response with TiO2–GO/SPE. | ||
| Fig. 11 Influence of particular possible interfering substances on the responses of the proposed electrochemical sensor for 50 μM 4-Cp in 0.1 M PBS (pH 8.0). | ||
A recovery study was performed in triplicate by using four real water samples (A, B, C, and D represent water obtained from Yangtze River, Qinhuai River, Tai Lake, and Yellow Sea, respectively) with two different standard concentrations (1.0 and 6.0 μM) of 4-Cp. The concentrations measured were compared with the concentrations added, and the results are summarized in Table 2. The average recoveries varied from 91.3% to 102.1%, which demonstrates the satisfactory accuracy of the developed electrochemical sensor. This finding confirmed the application potential of our method to measure 4-Cp in real samples.
| Sample | Added (μmol L−1) | Found (μmol L−1) | RSD (%) | Recovery (%) |
|---|---|---|---|---|
| A | 1.00 | 0.95 | 6.3 | 95.2 |
| 6.00 | 5.92 | 8.5 | 98.7 | |
| B | 1.00 | 1.02 | 2.8 | 102.1 |
| 6.00 | 6.01 | 1.3 | 100.2 | |
| C | 1.00 | 0.91 | 9.8 | 91.3 |
| 6.00 | 5.89 | 10.0 | 98.2 | |
| D | 1.00 | 0.96 | 5.4 | 96.2 |
| 6.00 | 5.95 | 6.8 | 99.2 |
4. Conclusion
The TiO2–GO nanoparticles were initially synthesized through a hydrothermal method and used to fabricate an electrochemical sensor. The electrochemical studies demonstrated that TiO2–GO possessed a high catalytic performance with a bimodal current response toward 4-Cp, and the significant increase in peak current greatly improved the analytical performance of the prepared sensor. To our knowledge, this study is trying to construct an electrochemical sensor with TiO2–GO nanoparticles applied in the fields of environmental detection. Other advantages of TiO2–GO nanoparticles include ease of synthesis, low toxicity, and excellent stability, which are potential in electroanalysis and electrocatalysis of biological and organic molecules.Acknowledgements
The authors gratefully acknowledge the support provided by Specialized Research Fund for the Doctoral Program of Higher Education (Grant no. 20130094120009), National Natural Science Foundation of China (Grant no. 51308183), Natural Science Foundation of Jiangsu Province of China (Grant no. BK20130828) and the Fundamental Research Funds for the Central Universities (Grant no. 2013B32214).Notes and references
- Y. Pi, L. Zhang and J. Wang, J. Hazard. Mater., 2007, 141, 707–712 CrossRef CAS PubMed.
- O. Gimeno, M. Carbajo, F. J. Beltrán and F. J. Rivas, J. Hazard. Mater., 2005, 119, 99–108 CrossRef CAS PubMed.
- S. Rayne, K. Forest and K. J. Friesen, Environ. Int., 2009, 35, 425–437 CrossRef CAS PubMed.
- Z. Han, D. Zhang, Y. Sun and C. Liu, Chem. Phys. Lett., 2009, 474, 62–66 CrossRef CAS PubMed.
- L. H. Keith, Compilation of Sampling Analysis Methods, US Environmental Protection Agency, Boca Raton, FL, 1991, pp. 389–486 Search PubMed.
- D. Sun and H. Zhang, Water Res., 2006, 40, 3069–3074 CrossRef CAS PubMed.
- I. Rodriguez and R. Cela, TrAC, Trends Anal. Chem., 1997, 16, 463–475 CrossRef CAS.
- M. S. Ali, S. Rafiuddin, M. Ghori and A. R. Kahtri, J. AOAC Int., 2007, 90, 82–93 CAS.
- S. Zhang, Z. Yuan, H. Liu, H. Zou and Y. Wu, J. Chromatogr. A, 2000, 872, 259–268 CrossRef CAS.
- Q. Wang, P. Ma, K. Hu and Q. Jia, Spectrosc. Spectral Anal., 2007, 27, 560–564 CAS.
- Y. Zhu, M. Wu and S. Liu, J. Appl. Electrochem., 2013, 43, 1035–1041 CrossRef CAS.
- C. Wan, Y. Zhang, H. Lin, K. Wu, J. Chen and Y. Zhou, J. Electrochem. Soc., 2009, 156, F151–F154 CrossRef CAS PubMed.
- L. Chu and X. Zhang, J. Nanosci. Nanotechnol., 2012, 12, 300–307 CrossRef CAS PubMed.
- P. B. M. S. Ureta Zanartu, M. C. Diez, M. L. Mora and C. Gutierrez, Electrochim. Acta, 2001, 46, 2545–2551 CrossRef.
- M. Gattrell and B. MacDougall, J. Electrochem. Soc., 1999, 146, 3335–3348 CrossRef CAS PubMed.
- M. Ureta Zanartu, P. Bustos, C. Berrıos, M. Diez, M. Mora and C. Gutiérrez, Electrochim. Acta, 2002, 47, 2399–2406 CrossRef CAS.
- G. W. Muna, N. Tasheva and G. M. Swain, Environ. Sci. Technol., 2004, 38, 3674–3682 CrossRef CAS.
- J. Li, D. Kuang, Y. Feng, F. Zhang, Z. Xu and M. Liu, J. Hazard. Mater., 2012, 201, 250–259 CrossRef PubMed.
- Y. Dong, Y. Li, C. Wang, A. Cui and Z. Deng, J. Colloid Interface Sci., 2001, 243, 85–89 CrossRef CAS.
- X. h. Zhou, X. r. Huang, L. h. Liu, X. Bai and H. c. Shi, RSC Adv., 2013, 3, 18036–18043 RSC.
- Y. Zhang, J. Zhang, H. Wu, S. Guo and J. Zhang, J. Electroanal. Chem., 2012, 681, 49–55 CrossRef CAS PubMed.
- C. Qiu, T. Chen, X. Wang, Y. Li and H. Ma, Colloids Surf., B, 2013, 103, 129–135 CrossRef CAS PubMed.
- U. Diebold, Appl. Phys. A: Mater. Sci. Process., 2003, 76, 681–687 CrossRef CAS PubMed.
- Z. Weng, H. Guo, X. Liu, S. Wu, K. Yeung and P. K. Chu, RSC Adv., 2013, 3, 24758–24775 RSC.
- H. Cheng, J. Ma, Z. Zhao and L. Qi, Chem. Mater., 1995, 7, 663–671 CrossRef CAS.
- D. Daniel and I. G. Gutz, Electrochem. Commun., 2007, 9, 522–528 CrossRef CAS PubMed.
- X. Xing, S. Liu, J. Yu, W. Lian and J. Huang, Biosens. Bioelectron., 2012, 31, 277–283 CrossRef CAS PubMed.
- W. S. Hummers Jr and R. E. Offeman, J. Am. Chem. Soc., 1958, 80, 1339 CrossRef.
- H. Zhang, X. Lv, Y. Li, Y. Wang and J. Li, ACS Nano, 2009, 4, 380–386 CrossRef PubMed.
- L. Tang, Y. Wang, Y. Li, H. Feng, J. Lu and J. Li, Adv. Funct. Mater., 2009, 19, 2782–2789 CrossRef CAS.
- Y. Wang, S. Zhang, D. Du, Y. Shao, Z. Li, J. Wang, M. H. Engelhard, J. Li and Y. Lin, J. Mater. Chem., 2011, 21, 5319–5325 RSC.
- S. J. Bao, C. M. Li, J. F. Zang, X. Q. Cui, Y. Qiao and J. Guo, Adv. Funct. Mater., 2008, 18, 591–599 CrossRef CAS.
- X. Luo, A. Morrin, A. J. Killard and M. R. Smyth, Electroanalysis, 2006, 18, 319–326 CrossRef CAS.
- J. Li, D. Kuang, Y. Feng, F. Zhang, Z. Xu, M. Liu and D. Wang, Biosens. Bioelectron., 2013, 42, 198–206 CrossRef CAS PubMed.
- I. I. Suni, TrAC, Trends Anal. Chem., 2008, 27, 604–611 CrossRef CAS PubMed.
- J. Qiu, P. Zhang, M. Ling, S. Li, P. Liu, H. Zhao and S. Zhang, ACS Appl. Mater. Interfaces, 2012, 4, 3636–3642 CAS.
- J. Li, D. Kuang, Y. Feng, F. Zhang, Z. Xu, M. Liu and D. Wang, Biosens. Bioelectron., 2013, 42, 198–206 CrossRef CAS PubMed.
- J. Zhao, S. Pei, W. Ren, L. Gao and H. M. Cheng, ACS Nano, 2010, 4, 5245–5252 CrossRef CAS PubMed.
- X. Li, Y. Zhu, W. Cai, M. Borysiak, B. Han, D. Chen, R. D. Piner, L. Colombo and R. S. Ruoff, Nano Lett., 2009, 9, 4359–4363 CrossRef CAS PubMed.
- G. Zhao, X. Cui, M. Liu, P. Li, Y. Zhang, T. Cao, H. Li, Y. Lei, L. Liu and D. Li, Environ. Sci. Technol., 2009, 43, 1480–1486 CrossRef CAS.
- J. Qu and X. Zhao, Environ. Sci. Technol., 2008, 42, 4934–4939 CrossRef CAS.
- P. B. M. S. Ureta Zanartu, C. Berrios, M. C. Diez, M. L. Mora and C. Gutierrez, Electrochim. Acta, 2002, 47, 2399–2406 CrossRef.
- K. Peeters, K. De Wael, D. Bogaert and A. Adriaens, Sens. Actuators, B, 2008, 128, 494–499 CrossRef CAS PubMed.
- C. Comninellis and C. Pulgarin, J. Appl. Electrochem., 1991, 21, 703–708 CrossRef CAS.
- Y. Fan, H. T. Lu, J. H. Liu, C. P. Yang, Q. S. Jing, Y. X. Zhang, X. K. Yang and K. J. Huang, Colloids Surf., B, 2011, 83, 78–82 CrossRef CAS PubMed.
- A. Bebeselea, F. Manea, G. Burtica, L. Nagy and G. Nagy, Talanta, 2010, 80, 1068–1072 CrossRef CAS PubMed.
- H. Yang, X. Zheng, W. Huang and K. Wu, Colloids Surf., B, 2008, 65, 281–284 CrossRef CAS PubMed.
- F. M. A. Pop, C. Proca, C. Radovan, G. Burtica, P. Malchev, S. Picken and J. Schoonman, Chem. Bull. `Politehnica’ Univ. (Timisoara), 2008, 53, 22–25 Search PubMed.
- D. Shan, J. Zhang, H. G. Xue, Y. C. Zhang, S. Cosnier and S. N. Ding, Biosens. Bioelectron., 2009, 24, 3671–3676 CrossRef CAS PubMed.
| This journal is © The Royal Society of Chemistry 2014 |