Quantitative and qualitative analysis of ionic solvation of individual ions of imidazolium based ionic liquids in significant solution systems by conductance and FT-IR spectroscopy

Deepak Ekka and Mahendra Nath Roy*
Department of Chemistry, University of North Bengal, Darjeeling-734013, India. E-mail: mahendraroy2002@yahoo.co.in; Fax: +91 353 2699001; Tel: +91 353 2776381

Received 30th December 2013 , Accepted 7th April 2014

First published on 7th April 2014


Abstract

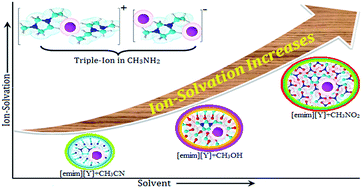
Quantitative analysis of molecular interactions by precise conductance (Λ) measurements and qualitative analysis by FT-IR spectroscopy have been reported for solution systems between some imidazolium-based ionic liquids ([emim]NO3, [emim]CH3SO3, [emim]Tos) and non-aqueous solvents (acetonitrile, methanol, nitromethane, methylamine solution) at 298.15 K. The Fuoss conductance equation (1978) and Fuoss–Kraus theory for ion-pair and triple-ion formations, respectively, have been used for analysing the conductance data. Using the appropriate division of the limiting molar conductivity value of [Bu4NBPh4] as a “reference electrolyte”, the limiting ionic conductances (λ±o) for individual ions have been calculated and reported. Dipole–dipole interactions, hydrogen bonding, structural aspects, and configurational theory are the driving forces and have been employed for the discussion of the results. FT-IR spectroscopic studies of variational intensity in the characteristic bands of the studied solvents have been undertaken, and the solvation phenomenon is manifested by the change of these band intensities in the presence of ionic liquids.


1. Introduction

Ionic liquids (ILs) have been actively tested as innovative non-volatile compounds and are used in many academic and industrial research areas. Most of the ionic liquids are good examples of neoteric solvents (new types of solvents or older materials that are finding new applications as solvents). Some of them are comparatively environmentally friendly (or eco-friendly) because they are found to be less hazardous for humans as well as less toxic for other living organisms.1 Room-temperature ionic liquids (RTILs) are salts in liquid state with relatively low melting points (below 100 °C) and usually consist of an organic cation or anion and a counter-ion. Generally, an ideal electrolyte should have high ionic conductivity (>10−4 S cm−1), fast ion mobility (>10−14 m2 V−1 s−1), large electrochemical potential windows (>1 V), and low volatility. RTILs exhibit most of these properties. Recently, ionic liquids (ILs) have been extensively studied as innovative compounds owing to their inimitable inherent characteristics, such as negligible vapour pressure, large liquid range, ability to dissolve a variety of chemicals, non-volatility, high thermal stability, large electrochemical window and potential as ‘designer solvents’ and ‘green’ replacements for volatile organic solvents.2 They have been intensively investigated for various applications including recyclable solvents for organic reactions and separation processes,3 lubricating fluids,4 heat transfer fluids for processing biomass and electrically conductive liquids as electrochemical devices in the field of electrochemistry (batteries and solar cells).5,6 By modifying the cations and anions, the physical properties (such as the melting point, viscosity, density, hydrophobicity, or hydrophilicity) of ionic liquids can be customized.7 In modern technology, industry, and also in academic research, the application of ILs is rapidly increasing. These applications are better understood by studying the ionic solvation and ion-association occurring in the solution systems.

ILs can be classified into two groups: protic ILs (PILs) and aprotic ILs (AILs).8 Generally, PILs are synthesized with equimolar amounts of a Brønsted acid and a Brønsted base.9 Aprotic ionic liquids (AILs) contain substituents other than a proton (typically an alkyl group) at the site occupied by the labile proton in an analogous PIL. AILs are a class of ILs based on organic cations characterized by a low melting point associated with the difficulty of packing large irregular cations with small anions. They have high mobility and ion concentration, making them suitable for application as advanced electrolytes.10 The selected ionic liquids in this study belong to the AIL class. They are emerging as promising materials for aqueous batteries, fuel cells, double-layer capacitors, solar cells and actuators.11

There are several commercially available imidazolium, pyridinium, ammonium and phosphonium based ionic liquid cations. Ionic liquids based on imidazolium cations have been demonstrated to exhibit the characteristics of AILs, have greater thermal stability than ionic liquids based on the above mentioned compounds and are commercially available in large quantities.12

Ionic liquids with polar anion functional groups (here, NO3, CH3SO3, and Tos) are able to interact with polar solvents. Given their structure and diversity of functionality, they are capable of most types of interactions (i.e., hydrogen bonding, ion-dipole, dipole–dipole, van der Waals forces).13,14

A number of conductimetric studies15,16 and related investigations of potential electrolytes in non-aqueous common solvents have probed their use in high-energy batteries17 and helped to understand the organic reaction mechanisms.18,19 Ionic level association of the individual electrolyte ions in the studied solution systems depends on the mode of ion solvation, which in turn depends on the characteristics of the solvent or solvent mixtures. Solvent properties such as viscosity and relative permittivity have been taken into consideration as these properties help determine the extent of ion–solvent interaction as well as the ion association occurring in the solution systems. On the other hand, non-aqueous solution systems have also been of great importance20 to industrialists, technologists and theoreticians to examine the nature, mode and magnitude of ion–ion and ion–solvent interactions as many chemical processes occur in non-aqueous solution systems.

A review of the literature divulges that very scant work has studied binary solution systems. Keeping in mind the vast applications in various fields of these systems, the present study on electrical conductance has explored the nature of ion-solvation in 1-ethyl-3-methylimidazolium based ionic liquids {1-ethyl-3-methylimidazolium nitrate [emim]NO3, 1-ethyl-3-methylimidazolium methanesulfonate [emim]CH3SO3, and 1-ethyl-3-methylimidazolium tosylate [emim]Tos (Scheme 1)} in non-aqueous polar solvents {acetonitrile (CH3CN), methanol (CH3OH), nitromethane (CH3NO2), and methylamine solution (CH3NH2)}.The solvation phenomena are evident by the shifting of the FT-IR vibrational intensity of characteristic bands (functional group) of the studied solvents due to the presence of the ionic liquids in the solution.


image file: c3ra48051h-s1.tif
Scheme 1 1-Ethyl-3-methylimidazolium based ionic liquids; (where Y = NO3, CH3SO3 and Tos).

2. Experimental

2.1 Source and purity of materials

The RTILs selected for the present work were puriss grade and procured from Sigma-Aldrich, Germany. The RTILs were used as purchased. The mass fraction purities of [emim]NO3, [emim]CH3SO3, and [emim]Tos} were ≥0.99, 0.98, and 0.98, respectively.

Spectroscopic grade solvents were procured from Sigma-Aldrich, Germany and were used as procured. The purities of acetonitrile, methanol, nitromethane, and methylamine solution were 99.8%, ≥99.8%, ≥98.5%, and ≥40% wt in water, respectively. The purity of the solvents was checked by measuring their density, viscosity and conductivity values. Results, as shown in Table 1, were in good agreement with the literature values.21

Table 1 Values of density (ρ), viscosity (η) and relative permittivity (εr) of studied solvents at T = 298.15 Ka
Solvents ρ × 10−3(kg m−3) η (mPa s) εr
Expt Lit Expt Lit
a Standard uncertainties u are: u(ρ) = 2 × 10⁻⁶ kg m−3, u(η) = 0.02 mPa s, and u(T) = 0.01 K.b Extrapolation of the values from ref. 59.
CH3CN 0.77668 0.77667 (ref. 56) 0.35 0.3446 (ref. 56) 35.95 (ref. 21)
CH3OH 0.78661 0.78660 (ref. 21) 0.55 0.545 (ref. 21) 32.70 (ref. 21)
CH3NO2 1.13015 1.13015 (ref. 22) 0.62 0.614 (ref. 22) 35.87 (ref. 22)
CH3NH2 0.89703 0.89700 (ref. 57) 0.18 0.178 (ref. 58) 9.10b


2.2 Apparatus and procedure

Prior to the start of the experimental work, we precisely checked the solubility of the selected ionic liquids; the selected RTILs were liberally soluble in all proportions of the solvents. All of the IL mother solutions in the studied solvents were prepared by mass (weighed by Mettler Toledo AG-285 with uncertainty 0.0003 g). Working solutions for conductance measurements were obtained by mass dilution of the prepared mother solutions.

Specific conductance values were measured by a Systronics-308 conductivity bridge with accuracy ±0.01% using a dip-type immersion conductivity cell, CD-10, with a cell constant of approximately (0.1 ± 0.001) cm−1. The measurements were made in a thermostated water bath maintained at temperature T = (298.15 ± 0.01) K. The cell was calibrated using the method proposed by Lind et al.,22 and the cell constant was measured based on a 0.01 M aqueous KCl solution. The conductance data were reported at a frequency of 1 kHz and the accuracy was ±0.3%. During all the measurements, the uncertainty in temperature was ±0.01 K.

Solvent densities (ρ) were measured by means of a vibrating U-tube Anton Paar digital density meter (DMA 4500M) with a precision of ±0.00005 g cm−3 maintained at ±0.01 K of the desired temperature. It was calibrated by triply-distilled water and passing dry air.

The viscosities (η) were measured using a Brookfield DV-III Ultra Programmable Rheometer with a size 42 fitted spindle. The viscosities were obtained using the following equation,

η = (100/RPM) × TK × torque × SMC
where RPM, TK (0.09373) and SMC (0.327) are the speed, viscometer torque constant and spindle multiplier constant, respectively. The instrument was calibrated against the standard viscosity samples supplied with the instrument, water and aqueous CaCl2 solution.23 The temperature was maintained to within ±0.01 °C using a Brookfield Digital TC-500 thermostat bath. The viscosities were measured with an accuracy of ±1%. Each measurement reported herein is an average of triplicate readings with a precision of 0.3%.

Infrared spectra were recorded with an 8300 FT-IR spectrometer (Shimadzu, Japan). The details of the instrument have been described previously.24 The concentration of the studied solutions used in the IR study was 0.05 M.

3. Results and discussion

3.1 Ion-pair formation from electrical conductance

The experimentally measured physicochemical properties of the pure solvents at 298.15 K are reported and compared to literature values in Table 1. Appropriate corrections have been made to the specific conductance of the solvents at the desired temperature, and precautions have been taken during the measurements.

The experimental specific conductance values (κ, μS cm−1) of the IL solutions in chosen solvents were measured by a Systronics-308 Conductivity Bridge. The measurements were made within a molar concentration range of 1.13 × 10⁻⁴ to 1.04 × 10⁻³ (M) at the experimental temperature. Using the specific conductance data, the molar conductances (Λ) for all studied solution systems (IL + solvent) were calculated by the appropriate equation.25

The determined molar conductance (Λ) values of the solutions of studied ionic liquids in different chosen solvents (IL + solvent) at the corresponding molar concentrations (c) are presented in Table 2. The linear relationship between the molar conductance and the square root of concentration (Λ versusc) shows that the relative permittivities are in the higher to moderate range for acetonitrile (εr = 35.95), methanol (εr = 32.70), and nitromethane (εr = 35.87), as depicted in Fig. 1. The extrapolation of the plotted lines to √c = 0 (i.e., at infinite dilution) represents the starting limiting molar conductance for the electrolytes. However, the non-linearity seen in the conductance vs. square root of concentration curves in Fig. 2 indicate low relative permittivity (εr < 10) of the solvent (methylamine solution, εr = 9.10). The Fuoss conductance equation (1978)26,27 was used for analysing the linear variation conductance data in higher or moderate relative permittivity solvents. For a given set of conductivity values (cj, Λj, j = 1, …, n) for each electrolyte in the solvents, three adaptable parameters {the limiting molar conductance (Λo), the association constant (KA), and the distance of closest approach of ions (R)} are derived from the following set of equations,

 
Λ = o[(1 + RX) + EL] (1)
 
P = 1 − α(1 − γ) (2)
 
γ = 1 − KA2f2 (3)
 
−ln[thin space (1/6-em)]f = βκ/2(1 + κR) (4)
 
β = e2/(εrkBT) (5)
 
KA = KR/(1 − α) = KR/(1 + KS) (6)
where RX is the relaxation field effect, EL is the electrophoretic counter current, k−1 is the radius of the ion atmosphere, εr is the relative permittivity of the solvent mixture, e is the electron charge, c is the molarity of the solution, kB is the Boltzmann constant, KA is the overall paring constant, KS is the association constant of the contact-pairs, KR is the association constant of the solvent-separated pairs, γ is the fraction of solute present as unpaired ion, α is the fraction of contact pairs, f is the activity coefficient, T is the absolute temperature and β is twice the Bjerrum distance. The computations were performed using a program suggested by Fuoss.27 The introductory limiting molar conductance (Λo) values for the iteration procedure were obtained from Shedlovsky extrapolation of the conductance data. Input for the program is the set (cj, Λj, j = 1, …, n), n, ε, η, T, initial values of Λo, and an instruction to cover a pre-selected range of R values.

Table 2 Molar conductance (Λ) and the corresponding concentration (c) of the studied ILs in different solvents at T = 298.15 Ka
c × 104 (mol dm−3) Λ × 104 (S m2 mol−1) c × 104 (mol dm−3) Λ × 104 (S m2 mol−1) c × 104 (mol dm−3) Λ × 104 (S m2 mol−1) c × 104 (mol dm−3) Λ × 104 (S m2 mol−1)
a Standard uncertainties u are: u(c) = 2 × 10⁻⁶ mol dm−3, u(Λ) = 1 × 10⁻⁶ S m2 mol−1, and u(T) = 0.01 K.
[emim]NO3
CH3CN CH3OH CH3NO2 CH3NH2
10.39 154.51 7.26 82.53 6.53 76.82 1.13 16.30
19.05 151.33 12.11 80.42 13.48 73.11 2.08 14.17
26.37 149.08 17.22 79.21 19.60 71.43 2.88 12.67
32.65 147.32 22.80 77.82 24.94 68.81 3.56 11.50
38.09 145.91 29.16 76.14 29.61 67.42 4.15 10.75
44.09 144.43 35.40 74.72 33.73 66.30 4.67 10.25
50.84 143.04 41.81 73.21 37.39 65.23 5.13 9.91
59.86 141.22 47.06 72.43 43.59 63.72 5.90 9.35
68.57 139.41 53.73 71.22 52.81 62.01 6.80 8.80
77.42 137.61 63.52 69.71 59.34 60.84 7.84 8.52
84.98 136.34 75.00 68.04 66.20 59.42 8.90 8.61
92.72 135.23 85.93 66.72 77.13 58.33 9.86 9.06
[emim]CH3SO3
CH3CN CH3OH CH3NO2 CH3NH2
9.62 148.93 6.76 74.04 8.01 65.53 1.25 14.03
17.64 145.26 11.29 71.72 12.89 63.64 2.08 12.00
24.42 141.97 17.14 69.43 19.01 61.72 2.79 10.89
30.24 140.24 22.75 67.61 24.50 59.81 3.45 9.86
35.28 138.27 27.35 66.51 29.16 58.43 4.07 9.28
43.58 135.85 32.95 65.44 34.81 57.02 4.72 8.63
50.13 134.12 39.82 63.52 41.60 55.21 5.57 8.05
57.72 132.07 47.06 61.43 49.42 53.44 6.35 7.73
65.12 130.64 55.80 60.04 58.83 51.57 7.06 7.64
72.76 128.84 65.45 58.82 68.89 49.73 7.85 7.65
80.63 127.01 75.17 57.43 76.74 47.52 8.70 7.81
86.93 125.64 84.46 54.41 82.08 46.73 9.68 8.30
[emim]Tos
CH3CN CH3OH CH3NO2 CH3NH2
9.62 116.22 7.84 59.50 8.70 51.04 1.18 11.70
17.64 109.32 14.38 57.11 14.98 48.81 1.94 9.91
24.42 106.14 19.91 54.92 21.16 47.12 2.63 8.57
30.24 103.56 24.65 53.30 28.62 44.93 3.33 7.80
35.28 101.67 28.76 52.22 34.57 43.82 3.94 7.35
43.58 98.40 32.36 51.08 41.06 42.84 4.62 6.71
50.13 96.57 38.35 50.03 48.67 40.51 5.39 6.65
55.43 95.20 43.14 48.45 54.75 39.23 6.23 6.40
61.73 93.61 48.77 48.06 61.89 38.04 6.94 6.58
68.03 92.02 55.47 46.32 68.95 36.82 7.78 6.80
74.70 90.67 62.32 45.64 77.30 36.01 8.59 6.87
80.63 89.71 66.68 44.74 85.17 34.03 9.60 7.53


image file: c3ra48051h-f1.tif
Fig. 1 Plot of molar conductance (Λ) vs. the square root of molar concentration (√c) for [emim]NO3 in CH3CN (♦), CH3OH (■) and CH3NO2 (▲); [emim]CH3SO3 in CH3CN (◊), CH3OH (□) and CH3NO2 (Δ); and [emim]Tos in CH3CN (●), CH3OH (○) and CH3NO2 (×) at T = 298.15 K.

image file: c3ra48051h-f2.tif
Fig. 2 Plot of molar conductance (Λ) vs. the square root of molar concentration (√c) for [emim]NO3 (♦), [emim]CH3SO3 (▲) and [emim]Tos (●) in CH3NH2 at T = 298.15 K.

The best values for the observable parameters were taken when the best fit of the equations to the experimental data, corresponding to a minimum standard deviation δ for a sequence of predetermined R values, was obtained. The standard deviation δ was calculated by the following equation,

 
image file: c3ra48051h-t1.tif(7)
where n is the number of experimental points and m is the number of fitting parameters. The conductance data were evaluated by fixing the distance of closest approach (R) of ions with two fitting parameters (i.e., m = 2). No significant minima were found in the curve of δ vs. R for the studied ILs in the acetonitrile, methanol or nitromethane. The R values were arbitrarily preset at the centre to centre distance of the solvent-separated ion pair. Thus, the theoretical values of R are assumed to be R = (a + d); where a = (r+ + r) is the sum of the crystallographic radii of the cation (r+) and anion (r) and d is the solvent effect parameter, which is the average distance to the side of a cell occupied by a solvent molecule. The average distance, d is given by,28
 
d (Å) = 1.183 (M/ρ)1/3 (8)
where M and ρ are the molar mass and density of the solvent, respectively.

The programmable values of Λo, KA, and R obtained by this procedure for all the studied ILs in selected solvents are presented in Table 3. Perusal of Table 3 discloses that the observed limiting molar conductances (Λo) for each of the ILs gradually decrease from acetonitrile to nitromethane among the solvents. Thus, the observed trend of the Λo values is:

Λo(CH3CN) > Λo(CH3OH) > Λo(CH3NO2)

Table 3 Limiting molar conductivity (Λo), the association constant (KA), the distance of closest approach of ions (R), standard deviation δ of experimental Λ, Walden product (Λoη) and Gibbs energy change (ΔGo) of ILs in different studied solvents at T = 298.15 K
Solvents Λo × 104 (S m2 mol−1) KA (dm3 mol−1) R (Å) δ Λoη × 104 (S m2 mol−1 mPa s) log(KA) ΔGo (kJ mol−1)
[emim]NO3
CH3CN 162.17 28.6 8.26 0.18 55.85 3.35 −0.83
CH3OH 87.53 59.0 7.89 0.21 47.66 4.08 −1.01
CH3NO2 82.34 98.5 8.29 0.27 50.56 4.59 −1.14
[emim]CH3SO3
CH3CN 157.35 42.9 9.10 0.18 54.19 3.76 −0.93
CH3OH 79.78 96.2 8.73 0.22 43.44 4.57 −1.13
CH3NO2 73.23 128.1 9.13 0.31 44.96 4.85 −1.20
[emim]Tos
CH3CN 125.62 90.8 9.43 0.14 43.26 4.51 −1.12
CH3OH 66.17 135.2 9.06 0.27 36.03 4.91 −1.21
CH3NO2 58.85 169.7 9.46 0.33 36.13 5.13 −1.27


The observed trend of solvent Λo is found to be the opposite of the viscosity trend. As expected, limiting molar conductance values decrease when the viscosity of the solvents increases because ionic mobility is diminished in viscous media. Interestingly, Fig. 3 shows that a linear relationship exists between the limiting molar conductivities for each of the ILs and the reciprocal viscosity (1/η) (or the fluidity, η−1) of the solvents. From Tables 1 and 3, we see that the association constant (KA) as well as the log(KA) values vary linearly with the viscosities of the solvents; this also shows that viscous media diminish the fluidity of the ion, which is due to the association of the ions and electrolyte with the solvent molecules in the solution systems. This suggests that the fluidity (η−1) of the solvents play a predominant role in limiting molar conductivities, in addition to the association of the ILs. A similar observation has been reported by Huiyong Wang and co-workers.29


image file: c3ra48051h-f3.tif
Fig. 3 Plot of limiting molar conductance (Λo) for [emim]NO3 (♦), [emim]CH3SO3 (▲), [emim]Tos (●) and fluidity (η−1) of the solvents CH3CN, CH3OH and CH3NO2, respectively, at T = 298.15 K.

Some conclusions may be reached based on the calculated ion-association constants (KA) of the studied ILs. We have examined the consequence of the solvent properties on the ion-association behaviour of the selected ILs. It is interesting to note from Table 3 that the KA values of the ILs are just inverses of the limiting molar conductance values (i.e., image file: c3ra48051h-t2.tif). The magnitudes of KA are lower in acetonitrile and higher in nitromethane for each of the electrolytes, and proceed in the following order:

KA(CH3NO2) > KA(CH3OH) > KA(CH3CN)

The theory, literature review and experimental results show that the association constants (KA) represent the ion–solvent interaction or ion-association. The interactions between the electrolytes (as well as ions) and solvent molecules in the binary solutions increase from acetonitrile to nitromethane among the chosen solvents, leading to a lower IL conductances. Comparing Tables 1 and 3, we can see that the association constant values follow the same trend as the viscosity values of the solvents. Thus, the viscosity values also support the above facts, i.e., a less viscous solvent should increase the Λo value and the mobility of the ion. However, this is not in line with the relative permittivities (εr) of the solvents, although the decreasing trend in solvent viscosity suggests a concomitant increase in limiting molar conductances30,31 for the electrolytes. The trends suggest that the solvents' viscosity (ηo) predominates over the relative permittivity (εr) in affecting both the electrolytic conductance and the association constant of the ILs in the studied solutions. The trends also suggest that the solvent effect for ion-association of ILs is similar to that of typical electrolytes, and that electrostatic interaction between the cation and anion is mainly responsible for their association. The data in Table 3 allow us to evaluate the ion-association ability of IL anions by comparison of KA values for [emim]NO3, [emim]CH3SO3, and [emim]Tos in chosen solvents. It is clear that the association constants for the common imidazolium-based ILs depend on anion species, with KA values in the following order:

Tos > CH3SO3 > NO3

This trend suggests that the Tos anion significantly enhances the ion–solvent interaction relative to CH3SO3 and NO3 in the molecular solvents, in agreement with experimental observations. Therefore, it is apt to state that the net result depends on the intrinsic interactions between both cations and anions and ion-solvation.

The Walden product (Λoη; product of the limiting molar conductance and solvent viscosity; Table 3) is a constant under normal conditions and presents another characteristic function for discussion and validating the trend obtained in limiting molar conductances (Λo) and ion-associations. From Table 3 and Fig. 4, the Walden product is seen to decrease from acetonitrile to nitromethane in concert with the increase in solvent viscosity and the decreasing limiting molar conductance of the ILs. This is warranted as the Walden product of an ion or solute is inversely proportional to the effective solvated radius (reff) of the ion or solute in a particular solvent.32 The Walden product is estimated from the following equation:

 
image file: c3ra48051h-t3.tif(9)


image file: c3ra48051h-f4.tif
Fig. 4 Plot of limiting molar conductance (Λo) for [emim]NO3 (♦), [emim]CH3SO3 (▲), [emim]Tos (●) and Walden product (Λoη) for [emim]NO3 (◊), [emim]CH3SO3 (Δ), [emim]Tos (○) in CH3CN, CH3OH and CH3NO2, respectively, at T = 298.15 K.

The variation in the Walden product reflects the degree of solvation.12 It is difficult to quantitatively correlate Walden product variation with solvent composition, however, the results indicate that the electrostatic ion–solvent interactions or ion-associations are stronger in these cases. The variation with solvent composition can be explained by the following aspects:

(i) Preference of the ILs for solvent molecules. Taking into consideration the conductance and association constant values of ILs in different solvents, we can say that the studied ILs prefer nitromethane compared to the other two solvents, and the order of preference of solvation by the ILs is as follows:

nitromethane > methanol > acetonitrile

(ii) Considering the structural aspect of the solvents,

(a) In acetonitrile (CH3CN), the interaction between the negatively charged nitrogen atom of acetonitrile and the positively charged N atom of the [emim]+ moiety, shown in (I) of Scheme 2, occurs through ion–dipole interaction. When acetonitrile is dimerized, most of the positive charge in CH3C+N is on the nitrile carbon, i.e., “inside” the molecule, indicating that acetonitrile tends to associate and form the antiparallel dimer33 presented in Scheme 3. The existence of antiparallel dimerization in acetonitrile or the interaction between acetonitrile molecules (solvent–solvent interaction) decreases the ion–solvent interactions with the ILs.


image file: c3ra48051h-s2.tif
Scheme 2 The schematic representation of ion-solvation for particular ions in the studied solutions {[emim][Y] + solvents}.

image file: c3ra48051h-s3.tif
Scheme 3 Antiparallel dimerization of acetonitrile (CH3CN).

(b) The interaction of ILs with methanol is shown in (II). This interaction is more intense due to the presence of the more negative oxygen atom in the molecular structure of methanol, generating electrostatic and ion–dipole interactions between the negatively charged oxygen atom and the positively charged nitrogen atom of the imidazole centre of the [emim]+ moiety or H-bond interaction of methanol and NO3, CH3SO3, and Tos.

(c) Nitromethane has three nucleophilic centres (two electronegative oxygen atoms and one nitrogen) to interact with the ILs as shown in (III). Thus, in the solutions of ILs + nitromethane, the nitromethane interacts with ILs at more attacking centres through H-bond, ion–dipole interaction, etc. Hence, nitromethane gives the highest value of ion-association constants and also demonstrates the highest level of aggregation.

The schematic representation of plausible ion–solvent interactions for the particular ion in the studied solvents (i.e., ILs + solvents), taking into account various derived parameters, is depicted in Scheme 2.

To investigate the role of the individual IL ions of the in ion-solvation, we have to split the limiting molar conductance values into their ionic contributions. The ionic conductances λ±o for the [emim]+ cation and NO3, CH3SO3, and Tos anions in different solvents were calculated using tetrabutylammonium tetraphenylborate (Bu4NBPh4) as a ‘reference electrolyte’ by the method of Das et al.34 We estimated the ionic limiting molar conductances λ±o in the studied solvents by interpolating conductance data from the literature35 using cubic spline fitting. The determined ionic conductance values are given in Table 4. Perusal of Table 4 illustrates that the degree of ionic conductance is higher for [emim]+ ion than for NO3, CH3SO3, or Tos, suggesting that the anions (NO3, CH3SO3, Tos) are responsible for a greater share of ionic association than the common imidazolium cation [emim]+. Estimation of the ionic contributions to conductance is based mostly on Stokes' law, which provides valuable insight for the limiting ionic Walden product. The law states that the limiting ionic Walden product (λ±oη; the product of the limiting ionic conductance and solvent viscosity) for any singly charged, spherical ion is a function of the ionic radius (crystallographic radius), and thus, is a constant under normal conditions. The contribution of anions (NO3, CH3SO3, Tos) and the common cation [emim]+ in both the limiting ionic conductance (λ±o) and the limiting ionic Walden product (λ±oη) are shown in Fig. 5. It can be been seen that both the λ±o, and λ±oη decrease from acetonitrile to nitromethane for each of the studied ILs, implying that ion–solvent interaction increases from acetonitrile to nitromethane. For a particular solvent, the order of limiting ionic conductance of anions is as follows:

NO3 > CH3SO3 > Tos

Table 4 Limiting ionic conductance (λ±o), ionic Walden product (λ±oη), Stokes' radius (rs) and crystallographic radius (rc) of imidazolium-based ionic liquids in different studied solvents at T = 298.15 K
Solvents λ±o × 104 (S m2 mol−1) λ±oη × 104 (S m2 mol−1 mPa s) rs (Å) rc (Å) t±
  [emim]+ NO3 [emim]+ NO3 [emim]+ NO3 [emim]+ NO3 [emim]+ NO3
CH3CN 97.20 64.97 33.48 22.37 2.45 3.66 1.33 1.99 0.599 0.401
CH3OH 52.47 35.06 28.57 19.09 2.87 4.29 1.33 1.99 0.599 0.401
CH3NO2 49.35 32.99 30.30 20.25 2.70 4.05 1.33 1.99 0.599 0.401
  [emim]+ CH3SO3 [emim]+ CH3SO3 [emim]+ CH3SO3 [emim]+ CH3SO3 [emim]+ CH3SO3
CH3CN 107.04 50.31 36.87 17.33 2.22 4.73 1.33 2.83 0.680 0.320
CH3OH 54.27 25.51 29.55 13.89 2.77 5.90 1.33 2.83 0.680 0.320
CH3NO2 49.82 23.41 30.59 14.38 2.68 5.70 1.33 2.83 0.680 0.320
  [emim]+ Tos [emim]+ Tos [emim]+ Tos [emim]+ Tos [emim]+ Tos
CH3CN 88.41 37.21 30.45 12.82 2.69 6.39 1.33 3.16 0.704 0.296
CH3OH 46.57 19.60 25.36 10.67 3.23 7.68 1.33 3.16 0.704 0.296
CH3NO2 41.42 17.43 25.43 10.70 3.22 7.66 1.33 3.16 0.704 0.296


image file: c3ra48051h-f5.tif
Fig. 5 Plot of limiting ionic conductance (λ±o) for NO3 (♦), CH3SO3 (▲), Tos (●) and ionic Walden product (λ±oη) for NO3 (◊), CH3SO3 (Δ), Tos (○) in CH3CN, CH3OH and CH3NO2, respectively, at T = 298.15 K.

This indicates that the greater size of Tos ion enhances the interaction with solvent molecules compared to the other two ions. Since the intrinsic radius of a given anion is constant in the different solvents, a smaller limiting molar conductivity value of an anion in a solvent suggests enhanced solvation of the anion in that specific medium. Therefore, it may be possible to state that the degree of solvation of anions in the solvents obeys the following trend: nitromethane > methanol > acetonitrile.

The stronger solvation of anions in nitromethane is believed to be attributable to the stronger H-bonding interaction between the anions and the nitromethane molecules relative to methanol, whereas the difference in the degree of solvation of anions in acetonitrile is attributed to the difference in the solvents' dipole moments. The ion–dipole interactions decrease with increasing intrinsic radius of the anions because of their decreased charge densities. This result is supported by the molecular dynamic simulations of H-bonding solvents; ILs were mainly solvated by the H-bonding interactions between the anion and the solvent molecules.36 Additionally, the complete solvation response of coumarin 153 has been determined by Maroncelli et al.37 in a variety of ILs by combining femtosecond broad-band fluorescence upconversion and time-correlated single photon counting measurements.

The λ±o values were in turn utilized for the calculation of Stokes' radii (rs) according to the classical expression,38

 
image file: c3ra48051h-t4.tif(10)
where the symbols have their usual meanings. The limiting ionic Walden products (λ±oη), Stokes' radii (rs), and crystallographic radii (rc) are presented in Table 4. The trends in Walden products (Λoη) and ionic Walden products (λ±oη) for the selected ILs in the chosen solvents are depicted in Tables 3 and 4 and in Fig. 4 and 5, respectively. They show that both the Walden products (Λoη) and ionic Walden products (λ±oη) for the ionic liquids (ILs) vary in an approximately linear fashion from acetonitrile to nitromethane. For the employed ions (i.e., [emim]+, NO3, CH3SO3, and Tos), the determined Stokes' radii (rs) are higher than their crystallographic radii (rc); this suggests that the ions are comparatively more solvated due to the intrinsic surface charge density. These results also support the idea that the ions have a higher level of association with the solvent molecules in the experimental solutions. The distance parameter R, shown in Table 3, represents the smallest distance that two free ions can have before they merge into an ion-pair in the studied media. The characteristic behaviours of the association constant (KA) values, which generally increase from acetonitrile to nitromethane, indicate that the thermal motion of the ions was probably destroyed in the solvents. However, the KA values and thus the IL ion-association increase from acetonitrile to nitromethane among the studied solvents (Table 3 and Fig. 6).


image file: c3ra48051h-f6.tif
Fig. 6 Plot of association constant (KA) for [emim]NO3 (♦), [emim]CH3SO3 (▲), [emim]Tos (●) and Gibbs energy change (ΔGo) for [emim]NO3 (◊), [emim]CH3SO3 (Δ), [emim]Tos (○) in CH3CN, CH3OH and CH3NO2, respectively, at T = 298.15 K.

Changes in the Gibbs energy are key to interpreting the nature of ion-pair formation. If we inspect the ΔGo, we can forecast the propensity for ion-pair formation taking place in the solution systems. The association constant (KA) values have been utilized to calculate the Gibbs energy change ΔGo, by the following relationship (Table 3):39

 
ΔGo = −RT[thin space (1/6-em)]ln[thin space (1/6-em)]KA (11)

Negative values of ΔGo were calculated for all the electrolytes in solvents, and the observed results can be explained in the context of ion-association phenomena. The Gibbs free energy values presented in Table 3 and Fig. 6 are negative for all solutions, and the negativity increases from acetonitrile to nitromethane for each electrolyte. The increasing negativity in the value of ΔGo of ionic liquids increases the probability of ion–solvent interactions. This result indicates that the extent of solvation for the selected ILs occurs in the following order:

CH3NO2 > CH3OH > CH3CN

Another distinguishing factor is the A-coefficient. The significance of this was recognized due to the development of the Debye–Hückel theory40 of interionic attractions in 1923. The A-coefficient depends on the ion–ion interactions (self interaction of the employed ions in solution) and can be calculated from interionic attraction theory as given by the Falkenhagen and Vernon41 equation:

 
image file: c3ra48051h-t5.tif(12)
where the symbols have their usual significance. The A-coefficients were calculated from conductivity measurements and are given in Table 5. From the table, it is observed that the A-coefficient is negative and very small. This indicates that the existence of the ion–ion interactions is negligible compared to the ion–solvent interactions for all the selected ILs in the studied solvents. Consequently, it is very clear that the ion–solvent interactions dominate over the ion–ion interactions. A similar conclusion was reached in our previous paper,16 by Banik and Roy,19 and by Wang and co-worker.29

Table 5 A-coefficient and solvation number (ns) of ionic liquids in different studied solvents at 298.15 K
Solvents A-coefficient/(mPas K1/2 S m2 mol−1)−1 ns A-coefficient/(mPas K1/2 S m2 mol−1)−1 ns A-coefficient/(mPas K1/2 S m2 mol−1)−1 ns
  [emim]NO3 [emim]CH3SO3 [emim]Tos
CH3CN −0.19 5.23 −0.17 6.67 −0.13 7.28
CH3OH −0.07 9.03 −0.06 8.06 −0.05 13.34
CH3NO2 −0.05 7.40 −0.04 7.17 −0.03 13.22


These interactions result in the orientation of the solvent molecules towards the effective ions. A greater number of solvent molecules oriented sequentially around the effective ion increases the ion-solvation. The number of solvent molecules that are involved in the solvation is called the solvation number (ns). Solvation regions can be classified as either primary or secondary. Here, we are concerned with the primary solvation region. The primary solvation number is defined as the number of solvent molecules which surrender their own translational freedom and remain with the molecule, tightly bound, as it moves around. Alternatively, the primary solvation number is the number of solvent molecules which are aligned in the force field of the ion as well as the electrolyte (IL).

If the limiting conductance of the ion (λ±o) of charge Zi is known, the effective radius of the solvated ion can be determined from Stokes' law and the volume of the solvation shell is given by the equation,

 
image file: c3ra48051h-t6.tif(13)
where rc and rs are the crystallographic and Stokes' radii of the ions, respectively. The solvation number ns would then be obtained from,
 
image file: c3ra48051h-t7.tif(14)
where Vo is the volume of the solvent molecules. The solvation number ns is given in Table 5. From the table, we see that the order of solvation number is methanol > nitromethane > acetonitrile, meaning that the number of solvent molecules which are aligned in the force field is increasing, leading to increasing ion–solvent interaction. This observation is in agreement with the finding by Rob Atkin et al.42 The key difference between IL interfacial structure and classical molecular liquid solvation layers is that many ILs possess bulk order,42 whereas conventional solvents may have preferred organization of adjacent molecules. In ILs, this order can be propagated over much greater distances, often forming a disordered sponge (L3 phase) structure43 where the ions form a network of polar and non-polar domains due to electrostatic and solvophobic clustering of like molecular groups.

Using the solvent viscosity and the estimated Stokes' radii, the diffusion coefficient (D±) of the ions can be determined by the Stokes–Einstein relation:

 
image file: c3ra48051h-t8.tif(15)
where kB is Boltzmann's constant and T is the temperature.

The diffusion coefficient (D±) is in turn utilized to obtain the ionic mobility (i) for the individual ions using the following equation,

 
image file: c3ra48051h-t9.tif(16)
where z±, F, Rg, T and D± are the ionic charge, Faraday constant, universal gas constant, temperature and diffusion co-efficient, respectively. Diffusion co-efficient (D±) and ionic mobility (i±) for the individual ions ([emim]+, NO3, CH3SO3, and Tos) in the studied solvents are given in Table 6. Scrutiny of Table 6 revels that the contribution to diffusion coefficients by the anions (NO3, CH3SO3, Tos) is less than the cation [emim]+ in all the studied solvents, indicating that [emim]+ ions diffuse more through the solvents. We observe that the diffusion coefficient decreases from acetonitrile to nitromethane for each ion. As indicated in Table 6, the employed ions show the greatest diffusion in acetonitrile. It seems reasonable to expect that detailed analyses of the sort described by Maroncelli et al.,44 taking into account the specifics of the electron transfer processes as well as the underestimation of diffusion coefficients by Stokes–Einstein predictions, would provide satisfactory explanations for what appear to be widely variable and sometimes unexpectedly high reaction rates reported for diffusion-limited reactions in ionic liquids. They found that the fact that the Stokes–Einstein relationship, DSE = kBT/6πηR, assumed in deriving the simple Smoluchowski prediction for kD = kBT/6πη, significantly underestimates diffusion coefficients in ionic liquids, contributing to large values of kq/kD. This effect was suggested by the small effective hydrodynamic radii required to fit the quenching data to the model and confirmed by direct measurements of the diffusion of DMA in all of the solvents studied. From both the results of this study and the observation by Maroncelli,44 it has been found that D±ηo−1.

Table 6 Diffusion coefficient (D±) and ionic mobility (i±) of ionic liquids in different studied solvents at 298.15 K
Solvents D± × 1015/(m2 s−1) i± × 1014/(m2 s−1 volt−1)
  [emim]+ NO3 [emim]+ NO3
CH3CN 2.59 1.73 10.07 6.74
CH3OH 1.40 0.93 5.43 3.63
CH3NO2 1.32 0.88 5.13 3.42
  [emim]+ CH3SO3 [emim]+ CH3SO3
CH3CN 2.85 1.34 11.11 5.21
CH3OH 1.45 0.68 5.63 2.64
CH3NO2 1.33 0.62 5.16 2.43
  [emim]+ Tos [emim]+ Tos
CH3CN 2.35 0.99 9.17 3.86
CH3OH 1.24 0.52 4.83 2.03
CH3NO2 1.10 0.46 4.30 1.81


Table 6 also shows that the mobility of anions (NO3, CH3SO3, and Tos) is lower than [emim]+ in all the investigated solvents, indicating a greater share of conductance by [emim]+ ions as indicated earlier by conductance measurements. The observation suggests that the diffusion coefficient (D±) is directly proportional to the ionic mobility (i±), and that this provides the driving force for electrical conduction by ILs or ions in solutions. From the same table, we see that the diffusion and the mobility of the ions decrease from acetonitrile to nitromethane, and the deceasing order in ionic mobility of the anions are as follows:

NO3 > CH3SO3 > Tos

This result is reciprocal to the density and viscosity of the solvents.45 Lower diffusivity and mobility is associated with higher ion–solvent interaction or ion-solvation, which is evident from the association constant values (Table 3). A graphical comparison of diffusion coefficient (D±) and ionic mobility (i±) for anions (NO3, CH3SO3, and Tos) is given in Fig. 7. These findings may be applied to the modulation of IL conductance by using solvents.


image file: c3ra48051h-f7.tif
Fig. 7 Plot of diffusion coefficient (D±) for NO3 (♦), CH3SO3 (▲), Tos (●) and ionic mobility (i±) for NO3 (◊), CH3SO3 (Δ), Tos (○) in CH3CN, CH3OH and CH3NO2, respectively, at T = 298.15 K.

3.2 Triple-ion formation from electrical conductance

The graphical representation of molar conductance corresponding to the square root of concentration (Λ vs.c) of the selected ionic liquids in methylamine solution (CH3NH2) is presented in Fig. 2. The figure shows that the ILs follow the same trend; i.e., the conductance value gradually decreases with increasing concentration, reaches a minima, and then increases. Due to the deviation of the conductimetric curves from linearity in the case of ILs in methylamine solution (εr = 9.10), the conductance data were analyzed to determine the limiting molar conductance and triple ion conductance by the classical Fuoss–Kraus theory of triple-ion formation28,39 in the form,
 
image file: c3ra48051h-t10.tif(17)
where g(c) is a factor that lumps together all the intrinsic interaction terms and is defined by:
 
image file: c3ra48051h-t11.tif(18)
 
β′ = 1.8247 × 10⁶/(εrT)1.5 (19)
 
image file: c3ra48051h-t12.tif(20)

In all the above equations, the Λo term signifies the sum of the molar conductance of the simple ions at infinite dilution, the ΛTo is the sum of the conductance value of the two possible triple-ions [(emim)2]+[Y] and [emim][Y2] for the imidazolium ionic liquids [emim][Y] (where Y = NO3, CH3SO3 and Tos). The constants KPKA and KT represent the ion-pair and triple-ion formation constants, respectively, and S is the limiting Onsager coefficient. When employing eqn (17), the triple-ions constants for the two possible symmetric triple ions, KT1 = [(emim)2]+[Y]/{[(emim)+][emim][Y]} and KT2 = [emim][Y2]/{[Y][emim][Y]}, were assumed to be as KT1 = KT2 = KT46. The Λo values for the studied electrolytes in methylamine solution have been determined using the method recommended by Krumgalz in 1983.47 The values of ΛTo were calculated with the help of Λo values by fitting the triple-ion conductance equal to 2/3Λo.48 Thus, the ratio ΛTo/Λo was set equal to 0.667 during linear regression analysis of eqn (17).

The obtained limiting simple ion molar conductances (Λo), limiting triple ion molar conductances of (ΛTo), slopes and intercepts of eqn (17) for ILs in methylamine solution at 298.15 K are presented in Table 7. The intercepts and slopes were obtained by employing linear regression analysis to eqn (17) for the electrolytes with an average regression constant of R2 = 0.9989. Thereafter, these values were utilized to calculate other parameters such as KP and KT (Table 8). Table 8 demonstrates that the ion-pair constant KP is larger than that of the triple-ion formation constant KT, indicating that the majority of the ILs exist as ion-pairs with a minor portion as triple-ions. This is due to the fact that the electrolytes exist as ion-pairs with water molecules, which make up the majority of the solvent, and as triple-ions with the minority methylamine molecules (solvent is 40 wt% methylamine + 60 wt% water). The propensity to form triple-ions vs. ion-pairs can be judged from the ratio of KT/KP and the values of log(KT/KP), which are shown in Table 8. The ratios and logarithm values recommend that strong ion-association between the ions and solvent molecules are due to the coulombic interactions in addition to covalent forces in the solution. The observed values are in excellent accord with those obtained by Hazra et al.49 We know that the electrostatic ionic interactions are very large due to the higher force field effect for very low relative permittivity solvents (i.e., εr < 10). Therefore, the formed ion-pairs were attracted by the free cations or anions present in the solution medium. As the distance of closest approach of the ions becomes minimal, triple-ions are formed, which acquire the charge of the ions attracted from bulk solution,35,39 i.e.,

M+ + A ↔ M+⋯A ↔ MA (ion-pair)

MA + M+ ↔ MAM+(triple-ion)

MA + A ↔ MAA(triple-ion)
where the symbols M+ and A imply [emim]+ and Y ions, respectively. The effect of ternary association50 explains the non-linearity of the conductimetric curve. As a consequence of these ternary associations, some non-conductive MA species are removed from solution and replaced by triple-ions, which increases the conductance values and creates the non-linearity observed in the conductance curves for ILs in methylamine solution. The pictographic depiction of triple-ion formation for the selected ionic liquids (ILs) in methylamine solution is depicted in Scheme 4.

Table 7 The calculated ion-pair limiting molar conductance (Λo), triple-ion limiting molar conductance (ΛTo), slope and intercept of eqn (17) of ionic liquids in methylamine solution (CH3NH2) at T = 298.15 K
Ionic liquids Λo × 104 (S m2 mol−1) ΛTo × 104 (S m2 mol−1) Slope Intercept
[emim]NO3 53.78 35.87 36.17 0.18
[emim]CH3SO3 44.17 29.47 39.44 0.16
[emim]Tos 30.39 20.27 61.68 0.12


Table 8 Salt concentration at the minimum conductivity (cmin) along with the ion-pair formation constant (KP) and triple-ion formation constant (KT) for ionic liquids in methylamine solution (CH3NH2) at T = 298.15 K
Ionic liquids cmin × 104 (mol dm−3) log[thin space (1/6-em)]cmin KP × 10−3 (m3 mol−1) KT × 10−2 (m3 mol−1) (KT/KP) × 104 log(KT/KP)
[emim]NO3 7.84 −3.11 84.23 2.93 34.74 −2.46
[emim]CH3SO3 7.06 −3.15 78.25 2.80 47.85 −2.32
[emim]Tos 6.23 −3.21 63.80 2.53 120.48 −1.92


image file: c3ra48051h-s4.tif
Scheme 4 The pictorial representation of triple-ion formation for the electrolyte (IL) in methylamine solution as an example.

The ion-pair and triple-ion concentrations, CP and CT, respectively, at the minimum molar concentration of the salt solution have also been calculated using the KP and KT value by the following set of equations:48

 
α = 1/(KP1/2C1/2) (21)
 
αT = (KT/KP1/2)C1/2 (22)
 
CP = C(1 − α − 3αT) (23)
 
CT = (KT/KP1/2)C3/2 (24)

The fraction of ion-pairs (α) and triple-ions (αT) present in the salt-solutions are shown in Table 9. The calculated values of CP and CT are also presented in Table 9. Comparison of the CP and CT values shows that the CP is higher than CT, indicating that the major portion of ions are present as ion-pairs even at high concentrations, and a small fraction exist as triple-ions. The conductance value decreases with increasing concentration and reach a minimum called Λmin. The concentration at which the conductance value reaches a minimum is termed Cmin; after Cmin, the fraction of triple-ions in the solution increases with the increasing concentration in the studied solution medium {[emim][Y] + methylamine solution}.

Table 9 Salt concentration (cmin) at the minimum conductivity (Λmin), the ion-pair fraction (α), triple-ion fraction (αT), ion-pair concentration (CP) and triple-ion concentration (CT) of ionic liquids in methylamine solution (CH3NH2) at T = 298.15 K
Ionic liquids cmin × 104 (mol dm−3) Λmin × 104 α × 102 αT × 102 CP × 105 (mol dm−3) CT × 105 (mol dm−3)
[emim]NO3 7.84 8.52 12.30 2.82 75.44 2.22
[emim]CH3SO3 7.06 7.64 13.46 3.56 68.59 2.51
[emim]Tos 6.23 6.40 15.87 7.59 66.55 4.73


Using the KP values, the interionic distance parameter aIP has been calculated with the aid of the Bjerrum's theory of ionic association50 in the form:

 
image file: c3ra48051h-t13.tif(25)
 
image file: c3ra48051h-t14.tif(26)
 
image file: c3ra48051h-t15.tif(27)

The aIP values obtained are given in Table 10. The Q(b) and b values were calculated by the literature procedure.51 The table reveals that the aIP values for all the ILs lie within the range of the actual ionic sizes (or crystallographic radii) and varied from (3.33 to 4.49) Å. This may be due to some extent to the easy penetration of the anions (NO3, CH3SO3 and Tos) into the void spaces between the alkyl chain of [emim]+, as suggested by Abbott and Schiffrin.52 Again, the aIP values are within the crystallographic radii (rc), suggesting that contact ion-pair formation in solution is probable.30 This causes a decrease in the degree of freedom for the ions forming ion-pairs, which results in the loss of configurational entropy. Generally, KP values do not change significantly for imidazolium ILs with the alkyl chain consisting of fewer carbon atoms. The small changes in KP may thus be related to entropic contributions.

Table 10 Interionic distance parameter for ion-pairs (aIP) and for triple-ions (aTI) in methylamine solution (CH3NH2) at T = 298.15 K
Ionic liquids aIP aTI 1.5aIP
[emim]NO3 3.44 4.01 5.16
[emim]CH3SO3 3.48 3.98 5.22
[emim]Tos 3.50 3.96 5.24


The interionic distance aTI for the triple-ion can be calculated using the expressions:35

 
image file: c3ra48051h-t16.tif(28)
 
image file: c3ra48051h-t17.tif(29)

I(b3) is a double integral tabulated in the literature39 for a range b3 values. Since I(b3) is a function of aTI, the aTI values were calculated by an iterative computer program. As shown in Table 10, the aTI values for the ILs are greater than the corresponding aIP values but much less than the expected theoretical value 1.5aIP. This is probably due to repulsive forces between the two anions or cations in the triple-ions [Bu4P(MS)2] and [(R4N)2+MS], as suggested by Hazra et al.49 These values also suggest that only a small fraction exist as triple-ions compared to ion-pairs.

3.3 FT-IR spectroscopic study

With the help of FT-IR spectroscopy, the molecular interaction between the ILs and the solvents have been qualitatively studied and used as supportive evidence for bond breaking and bond formation (electrostatic bond) due to ion–solvent and solvent–solvent interactions. The IR spectra of the pure solvents as well as the solutions of {[emim][Y] + solvents} were collected. The spectra in the wave number range 400–4000 cm−1 are shown in Fig. S1–S4, and the stretching frequencies of the functional groups are given in Table 11.
Table 11 Stretching frequencies of the functional groups present in the pure solvent and the change of frequency after addition of ILs to the solvents
Solvents Stretching frequencies
Functional group Pure solvent (νo cm−1) [emim]NO3 (νIL cm−1) [emim]CH3SO3 (νIL cm−1) [emim]Tos (νIL cm−1)
CH3CN C[triple bond, length as m-dash]N 2253.8 2278.9 2291.2 2307.6
C–H 2915.7 2919.3 2919.9 2920.3
CH3OH O–H 3384.7 3418.5 3430.8 3447.1
C–H 2916.6 2919.3 2920.0 2920.7
CH3NO2 N–O 1564.1 (νas) 1604.7 (νas) 1619.9 (νas) 1634.0 (νas)
1362.9 (νs) 1401.9 (νs) 1411.7 (νs) 1430.5 (νs)
C–H 2961.4 (νas) 2963.5 (νas) 2964.3 (νas) 2964.9 (νas)
2872.9 (νs) 2874.0 (νs) 2874.8 (νs) 2875.4 (νs)
CH3NH2 solution –OH 3446.3 3492.6 3503.1 3521.0
C–N 1283.4 1285.5 1286.7 1287.9
C–H 2914.9 2917.2 2919.0 2920.3


The IR spectrum of acetonitrile shows a sharp peak at νo = 2253.8 cm−1, which is attributed to the C[triple bond, length as m-dash]N stretching vibration (2210–2260 cm−1). When the ILs are added to acetonitrile (i.e., [emim][Y] + CH3CN), the peak shifts to νs = 2278.9 cm−1, 2291.2 cm−1, and 2307.6 cm−1 for [emim]NO3, [emim]CH3SO3, and [emim]Tos, respectively. This is due to the disruption of the dipole–dipole interaction of acetonitrile,33 leading to the formation of ion–dipole interaction between the ions and C[triple bond, length as m-dash]N bond and the shifting of the C[triple bond, length as m-dash]N stretching frequency. Negligible change in the C–H bond stretching frequency (3.6 cm−1, 4.2 cm−1, 4.6 cm−1) of CH3CN shows that the C–H bond does not contribute to the interaction.

In the case of methanol, a broad peak seen at νo = 3384.7 cm−1 is attributed to H-bonded O–H stretching vibration (within the range of 3200–3600 cm−1). However, the broad peak is shifted to νs = 3418.5 cm−1, 3430.8 cm−1, 3447.1 cm−1 in the IR spectra of {[emim][Y] + CH3OH} solutions. This indicates that the H-bonding between the methanol molecules53 is disrupted by the addition of the ILs [emim][Y]. The interaction of the IL ions ([emim]+, NO3, CH3SO3, Tos) with the –OH group of CH3OH causes the shift in the O–H bond stretching frequency. Negligible change in the stretching frequency of the C–H bond (2.7 cm−1, 3.4 cm−1, 4.1 cm−1) of CH3OH shows that the contribution of the C–H group is negligible.

For nitromethane, two bands for the asymmetric stretching vibration (νas) of N–O (1500–1570 cm−1) and the symmetric stretching vibration (νs) of N–O (1300–1370 cm−1) are obtained at νo = 1564.1 cm−1 and 1362.9 cm−1, respectively (Table 11). When we added ILs in nitromethane, νas shifted to 1604.7 cm−1, 1619.9 cm−1, 1634.0 cm−1 and symmetric νas shifted to 1401.9 cm−1, 1411.7 cm−1, 1430.5 cm−1, for [emim]NO3, [emim]CH3SO3, and [emim]Tos, respectively. The shift in the bands is due to the rupture of H-bonding in CH3NO2 molecules.54 The ILs also interact via ion–dipole interaction with the solvent molecules. The C–H stretching of the –CH3 group in CH3NO2 occurs at 2961.4 cm−1 for asymmetric vibration (νas) and at 2872.9 cm−1 for symmetric vibration (νs). A negligible change in asymmetric or symmetric stretching frequency of the C–H bond in CH3NO2 when the ILs are added (Table 11) shows that the interaction between C–H and IL ions is negligible.

A stronger interaction is seen between [emim][Y] and methylamine solution, as evident from the values of KA obtained from the conductivity study. Here, the peaks for hydroxyl –OH, C–N, and C–H bonds of methylamine solution were at 3446.3 cm−1, 1283.4 (1000–1360 cm−1), and 2914.9 (2850–2950 cm−1), respectively. The peak shifts to 3492.6 cm−1, 3503.1 cm−1 and 3521.0 cm−1 for the –OH group, respectively, when [emim]NO3, [emim]CH3SO3, and [emim]Tos are added to the methylamine solution (Table 11). This is due to the disruption of weak H-bonding in CH3NH2 (ref. 55) and H2O molecules of methylamine solution and the formation of ion–dipole interaction with the ions. Aqueous solutions of amines are basic, and the –NH groups interact less because the protons attached to nitrogen are less acidic than H2O. In methylamine solution (pKb = 3.36), the unshared electron pair on nitrogen forms a new covalent bond with hydrogen and displaces hydroxyl ion.

image file: c3ra48051h-u1.tif

It should be recognized that the presence of ILs leads to the generation of considerable intensity increases and due to the association of CH3NH3+ and –OH with additional [emim]+, NO3, CH3SO3 and Tos ions. Fig. S4 summarizes results for the –OH intensity increases for all the electrolytes in the methylamine solution. The shifting of the C–N and C–H bonds in the (ILs + solvents) mixture is negligible.

The overall schematic representation of the interaction or ion-solvation occurring in the studied solution systems {[emim][Y] + solvent} are represented in Scheme 5 in view of the observed derived parameters.


image file: c3ra48051h-s5.tif
Scheme 5 Schematic representation of the interaction or ion-solvation occurring in studied solution systems {[emim][Y] + solvent} in view of derived parameters.

4. Conclusions

The extensive qualitative and quantitative analysis of ion-solvation phenomena in typical 1-ethyl-3-methylimidazolium-based ionic liquids {[emim][Y]; where Y = NO3, CH3SO3 and Tos} in industrially-important non-aqueous polar solvents acetonitrile (CH3CN), methanol (CH3OH), nitromethane (CH3NO2), methylamine solution (CH3NH2) have been studied with the help of conductimetric and FTIR measurements. From examination of all the conductimetric measurements, the studied ILs are shown to exist as ion-pairs in acetonitrile, methanol and nitromethane, and as triple-ions in methylamine solution. The ionic size and charge distribution of the anions (NO3, CH3SO3 and Tos) and the common cation ([emim]+) as well as structural aspects (i.e., functional group of the solvent) are the key factors in the formation of ion-pairs and triple-ions. Transport properties including fluidity, diffusion coefficient (D±) and ionic mobility (i±) display a decreasing trend going from acetonitrile to nitromethane for all ions, suggesting a greater extent of ion–solvent interaction or ion-association in nitromethane compared to the other two solvents. For a particular solvent, the order of ion-association of anions for the common cation [emim]+ is as follows:
NO3 > CH3SO3 > Tos

In all the chosen solvents, the ILs interact through hydrogen bonding and ion–dipole interactions as evident from the FT-IR spectroscopic studies.

It is very clear from this study that the ion–solvent interactions dominate over ion–ion interactions. All parameters determined by the analysis of different equations enhanced with experimental data uphold the same conclusion discussed and explained in this text. The results are pertinent to the design of appropriate (IL + molecular solvent) binary systems for diverse applications.

Acknowledgements

The authors are thankful to the Departmental Special Assistance Scheme under the University Grants Commission, New Delhi (no. 540/6/DRS/2007, SAP-1), India and Department of Chemistry, University of North Bengal for financial support and instrumental facilities in order to continue this research work. One of the authors, Prof. M. N. Roy, is thankful to University Grant Commission, New Delhi, Government of India for being awarded a one time grant under Basic Scientific Research via the grant-in-Aid no. F.4-10/2010 (BSR) regarding his active service for augmenting of research facilities to facilitate further research work.

References

  1. R. J. Bernot, E. E. Kennedy and G. A. Lamberti, Environ. Toxicol. Chem., 2005, 24, 1759–1765 CrossRef CAS.
  2. T. Welton, Chem. Rev., 1999, 99, 2071–2084 CrossRef CAS PubMed.
  3. N. V. Plechkova and K. R. Seddon, Chem. Soc. Rev., 2008, 37, 123–150 RSC.
  4. C. Ye, W. Liu, Y. Chen and L. Yu, Chem. Commun., 2001, 2244–2245 RSC.
  5. F. Endres and S. Z. E. Abedin, Phys. Chem. Chem. Phys., 2006, 8, 2101–2116 RSC.
  6. P. Wang, S. M. Zakeeruddin, J. E. Moser and M. Grätzel, J. Phys. Chem. B, 2003, 107, 13280–13285 CrossRef CAS.
  7. J. Dupont, R. F. de Souza and P. A. Z. Suarez, Chem. Rev., 2002, 102, 3667–3692 CrossRef CAS PubMed.
  8. T. L. Greaves and C. J. Drummond, Chem. Rev., 2008, 108, 206–237 CrossRef CAS PubMed.
  9. T. L. Greaves, A. Weerawardena, C. Fong, I. Krodkiewska and C. J. Drummond, J. Phys. Chem. B, 2006, 110, 22479–22487 CrossRef CAS PubMed.
  10. A. Fernicola, B. Scrosati and H. Ohno, Ionics, 2006, 12, 95–102 CrossRef CAS PubMed.
  11. L. Timperman and M. Anouti, Ind. Eng. Chem. Res., 2012, 51, 3170–3178 CrossRef CAS.
  12. S. Zhang, N. Sun, X. He, X. Lu and X. Zhang, J. Phys. Chem. Ref. Data, 2006, 35, 1475–1517 CrossRef CAS PubMed.
  13. J. M. Crosthwaite, S. N. V. K. Aki, E. J. Maginn and J. F. Brennecke, J. Phys. Chem. B, 2004, 108, 5113–5119 CrossRef CAS.
  14. C. Cadena, J. L. Anthony, J. K. Shah, T. I. Morrow, J. F. Brennecke and E. J. Maginn, J. Am. Chem. Soc., 2004, 126, 5300–5308 CrossRef CAS PubMed.
  15. C. G. Janz and R. P. T. Tomkins, Non-aqueous Electrolytes Handbook, Academic Press, New York, 1973, vol. 2 Search PubMed.
  16. D. Ekka and M. N. Roy, J. Phys. Chem. B, 2012, 116, 11687–11694 CrossRef CAS PubMed.
  17. D. Aurbach, Non-aqueous Electrochemistry, Marcel Dekker, Inc, New York, 1999 Search PubMed.
  18. J. A. Krom, J. T. Petty and A. Streitwieser, J. Am. Chem. Soc., 1993, 115, 8024–8030 CrossRef CAS.
  19. I. Banik and M. N. Roy, J. Chem. Thermodyn., 2013, 63, 52–59 CrossRef CAS PubMed.
  20. O. Popvych and R. P. T. Tomkins, Nonaqueous Solution Chemistry, Wiley-Interscience, New York, 1981, ch. 4 Search PubMed.
  21. A. K. Covington and T. Dickinson, Physical chemistry of organic solvent systems, Plenum, New York, 1973 Search PubMed.
  22. J. E. Lind Jr, J. J. Zwolenik and R. M. Fuoss, J. Am. Chem. Soc., 1959, 81, 1557–1559 CrossRef.
  23. I. M. Abdulagatov and N. D. Azizov, Fluid Phase Equilib., 2006, 240, 204–219 CrossRef CAS PubMed.
  24. A. Sinha, A. Bhattacharjee and M. N. Roy, J. Dispersion Sci. Technol., 2009, 30, 1003–1007 CrossRef CAS.
  25. F. I. El-Dossoki, J. Mol. Liq., 2010, 151, 1–8 CrossRef CAS PubMed.
  26. R. M. Fuoss, Proc. Natl. Acad. Sci. U. S. A., 1978, 75, 16–20 CrossRef CAS.
  27. R. M. Fuoss, J. Phys. Chem., 1978, 82, 2427–2440 CrossRef CAS.
  28. R. M. Fuoss and F. Accascina, Electrolytic Conductance, Interscience, New York, 1959 Search PubMed.
  29. H. Wang, J. Wang, S. Zhang, Y. Pei and K. Zhuo, ChemPhysChem, 2009, 10, 2516–2523 CrossRef CAS PubMed.
  30. M. Bester-Rogac, J. Hunger, A. Stoppa and R. Buchner, J. Chem. Eng. Data, 2011, 56, 1261–1267 CrossRef CAS.
  31. J. O. Bockris and A. N. Reddy, Modern Electrochemistry, Plenum Press, New York, 2nd edn, 1998, p 552 Search PubMed.
  32. J. I. Bhat and P. Bindu, J. Indian Chem. Soc., 1995, 72, 783–790 CAS.
  33. R. Yamdagni and P. Kebarle, J. Am. Chem. Soc., 1972, 94(9), 2940–2943 CrossRef CAS.
  34. J. M. Chakraborty and B. Das, Z. Phys. Chem., 2004, 218, 219–230 CrossRef CAS.
  35. R. M. Fuoss and E. Hirsch, J. Am. Chem. Soc., 1960, 82, 1013–1017 CrossRef CAS.
  36. C. G. Hanke, N. A. Atamas and R. M. Lyndcn-Bell, Green Chem., 2002, 4, 107–111 RSC.
  37. (a) X.-X. Zhang, M. Liang, N. P. Ernsting and M. Maroncelli, J. Phys. Chem. B, 2013, 117, 4291–4304 CrossRef CAS PubMed; (b) M. Maroncelli, X.-X. Zhang, M. Liang, D. Roy and N. P. Ernsting, Faraday Discuss., 2012, 154, 409–424 RSC.
  38. R. A. Robinson and R. H. Stokes, Electrolyte Solutions, Butterworth, London, 1959, ch. 6, p. 130 Search PubMed.
  39. R. M. Fuoss and C. A. Kraus, J. Am. Chem. Soc., 1933, 55, 2387–2399 CrossRef CAS.
  40. P. Debye and E. Hückel, Phys. Z., 1923, 24, 185–206 CAS.
  41. H. Falkenhagen and E. L. Vernon, Philos. Mag., 1983, 14, 537–565 Search PubMed.
  42. R. Hayes, G. G. Warr and R. Atkin, Phys. Chem. Chem. Phys., 2010, 12, 1709–1723 RSC.
  43. (a) R. Atkin and G. G. Warr, J. Phys. Chem. B, 2008, 112, 4164 CrossRef CAS PubMed; (b) R. Atkin, D. Wakeham, R. Hayes, S. Imberti and G. G. Warr, Bulk and Interfacial Nanostructure, in Ionic Liquids, Congress on Ionic Liquids III, Cairns, 2009 Search PubMed.
  44. M. Liang, A. Kaintz, G. A. Baker and M. Maroncelli, J. Phys. Chem. B, 2012, 116, 1370–1384 CrossRef CAS PubMed.
  45. M. N. Roy, R. Dewan, D. Ekka and I. Banik, Thermochim. Acta, 2013, 559, 46–51 CrossRef CAS PubMed.
  46. Y. Harada, M. Salamon and S. Petrucci, J. Phys. Chem., 1985, 89, 2006–2010 CrossRef CAS.
  47. B. S. Krumgalz, J. Chem. Soc., Faraday Trans. 1, 1983, 79, 571–587 RSC.
  48. M. Delsignore, H. Farber and S. Petrucci, J. Phys. Chem., 1985, 89, 4968–4973 CrossRef CAS.
  49. D. Nandi, M. N. Roy and D. K. Hazra, J. Indian Chem. Soc., 1993, 70, 305–311 CAS.
  50. A. Sinha and M. N. Roy, Phys. Chem. Liq., 2007, 45, 67–77 CrossRef CAS.
  51. R. M. Fuoss and C. A. Krauss, J. Am. Chem. Soc., 1933, 55, 1019–1028 CrossRef CAS.
  52. A. P. Abbott and D. J. Schiffrin, J. Chem. Soc., Faraday Trans., 1990, 86, 1453–1459 RSC.
  53. M. Pagliai, G. Cardini, R. Righini and V. Schettino, J. Chem. Phys., 2003, 119, 6655–6662 CrossRef CAS PubMed.
  54. J. Li, F. Zhao and F. Jing, J. Comput. Chem., 2003, 24, 345–252 CrossRef CAS PubMed.
  55. E. M. Cabaleiro-Lago and M. A. Ríos, J. Chem. Phys., 2000, 112, 2155–2163 CrossRef CAS PubMed.
  56. N. Saha and B. Das, J. Chem. Eng. Data, 1997, 42, 227–229 CrossRef CAS.
  57. Catalogue of the product from Sigma Aldrich.
  58. R. A. Stairs, J. Chem. Eng. Data, 1980, 25, 379–379 CrossRef CAS.
  59. C. V. V. Ramana, A. B. V. Kiran Kumar, M. Ashok Kumar and M. K. Moodley, J. Chem., 2013, 687106 Search PubMed.

Footnote

Electronic supplementary information (ESI) available: Fig. S1–S4. See DOI: 10.1039/c3ra48051h

This journal is © The Royal Society of Chemistry 2014
Click here to see how this site uses Cookies. View our privacy policy here.