Bioimaging based on fluorescent carbon dots

Yubin Song , Shoujun Zhu and Bai Yang *
State Key Laboratory of Supramolecular Structure and Materials, College of Chemistry, Jilin University, Changchun, 130012, P. R. China. E-mail: byangchem@jlu.edu.cn

Received 27th December 2013 , Accepted 19th May 2014

First published on 29th May 2014


Abstract

Nanosized fluorescent carbon particles, namely, carbon dots (CDs), are a kind of fluorescent material that has drawn increasing attention in recent years. CDs have size-, surface chemistry-, and wavelength-dependent luminescence emission, which is different from traditional semiconductor-based quantum dots. Moreover, with excellent chemical stability, good biocompatibility, low toxicity, up-conversion emission, resistance to photo bleaching, as well as easy chemical modifications, CDs are promising for substantial applications in numerous areas: bioimaging, sensors, and energy-related devices. Herein, three kinds of fluorescent dots are reviewed: graphene quantum dots (GQDs), carbon nanodots (CNDs) and polymer dots (PDs). After the first reported CDs prepared from electrophoretic analysis and purification of fluorescent carbon nanotube fragments, there were hundreds of publications focusing on fluorescent CDs. Bioimaging was one of the most common applications of the CDs; therefore, in this review, most of the chosen reference papers were related to bioimaging based on CDs.
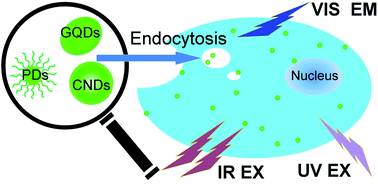

image file: c3ra47994c-p1.tif

Yubin Song

Yubin Song graduated from Jilin University in 2013. He is now a Ph.D. student in the State Key Lab of Supramolecular Structure and Materials, majoring in polymer chemistry and physics. Under the supervision of Prof. Bai Yang, he is working on the PL mechanism and novel application of the carbon nanomaterials.

image file: c3ra47994c-p2.tif

Shoujun Zhu

Shoujun Zhu was born in 1986. He obtained his BS in Applied Chemistry at the College of Chemistry, Jilin University in 2009. He is currently a Ph.D. student under the supervision of Prof. Bai Yang at Jilin University. His research is centered on the synthesis and application of fluorescent carbon-based materials.

image file: c3ra47994c-p3.tif

Bai Yang

Bai Yang is currently a professor of chemistry and the director of the State Key Lab of Supramolecular Structure and Materials in College of Chemistry, Jilin University. He received his Ph.D. in polymer physics and chemistry in 1991 under the supervision of Prof. Jiacong Shen at Jilin University. His research interests relate to the composite assembly of nanoparticles in polymers, fabrication of ordered microstructures, and high performance and functional polymer nanocomposite optical materials.


1 Introduction

Carbon dots (CDs) generally refer to small carbon nanoparticles with sizes below 10 nm; moreover, oxygen, hydrogen and other elements may exist in the small dots. The up- and down-conversion photoluminescent (PL) properties of CDs are similar to those of semiconductor quantum dots (QDs). Superior to QDs, CDs are biocompatible and environmentally friendly, without heavy metal ions and toxic elements. There have been many functional groups and/or passivation agents used to cover the surface of the CDs outside the carbon core, endowing CDs with high quantum yield (QY), chemical stability and good water solubility. CDs can be easily conjugated with target molecules to expand their functionality. In addition, starting materials for CDs are abundantly available, resulting in the possibility of low cost and mass production of the CDs.

Distinguished by “bottom-up” dehydration and “top-down” cutting routes, a large number of methods have been developed to synthesize CDs. Researchers are attempting to obtain high quality CDs via simple methods. In this review, carbon dots mainly consist of three kinds of fluorescent dots: graphene quantum dots (GQDs), carbon nanodots (CNDs) and polymer dots (PDs), which are mainly categorized by the inner structure of the carbon in the small dots.

GQDs are defined as nanographene fragments usually with diameters less than 10 nm. Although some other elements (e.g. oxygen, hydrogen, and nitrogen) may exist on the edge, the main body of GQDs is comprised of conjugated sp2 carbon. Carbon nanodots represent a wide range of fluorescent spherical carbon materials, which are mainly of two types. The first one is made up of a sp2 carbon core and surrounding chemical groups, while the other one consists of amorphous aggregations. In a sense, GQDs are a special kind of CNDs with a large conjugated domain and regular structure. Specifically, the CDs made from polymer (including protein) are referred to as polymer dots in this review. The dots form during the cross-linking and dehydration, while the polymer chain takes part in stabilization and passivation.

For all the three kinds of CDs, the starting material is usually not photoluminescent. During the synthetic process, dots and PL centers formed. The diversity and complexity of CDs make the PL complicated: the widely observed PL emission in CDs may be induced by the quantum size effect,1 triplet carbenes at the zigzag edges2/or edge defects, radiative recombination of excitons,3 surface state,4 aromatic structures with nitrogen/oxygen-containing groups5 and the molecular state.6

Because of their good solubility in aqueous solutions, low toxicity and biocompatibility, CDs can be employed for many applications, especially in bioimaging fields (Fig. 1). Many kinds of CDs can emit blue/green fluorescence when excited by UV light; thus, they are suitable for cellular imaging under a fluorescence microscope. Some special kinds of CDs can be excited by long-wavelength light and/or emit up-conversion PL light; therefore, they can be utilized for in vivo imaging. Nano-sized particle structures are beneficial to internalization of the small dots through caveolae-mediated endocytosis. In addition to adsorbing on the membrane, CDs may be incorporated into the cytoplasmic areas. Note that only a few papers reported that the cell nucleus could be labeled.7,8


image file: c3ra47994c-f1.tif
Fig. 1 Scheme for bioimaging of CDs.

Herein, we mainly summarize the different kinds of CDs, which have been applied in bioimaging. Most of the chosen reference papers in this review are related to bioimaging based on CDs. Moreover, a few representative papers not related to bioimaging are also cited to illustrate the category, synthetic method and properties of the CDs. Due to the increasing number of reports about CDs, we apologize to the researchers whose latest reports may have been left out.

2 Graphene quantum dots

Graphene quantum dots9–12 are composed of a single or a few layers of small graphene fragments. With an infinite exciton Bohr diameter, the bandgap of graphene is zero; however, the bandgap of GQDs are opened due to the small size and functional groups on the edge. The sizes of GQDs obtained from different method were different, most of which were smaller than 10 nm (Fig. 4). The quantum effect may be one of the reasons for the PL of GQDs, but free zigzag sites2 and surface defects13 seem to play an important role in the PL mechanism.

Bottom-up solution-based synthetic routes are an effective route for synthesizing nano-sized graphene. Based on oxidative condensation reactions, Müllen's group synthesized graphene with a certain size.14 Top-down methods often involve tuning surface chemistry, as well as cutting down the size, which can result in GQDs with blue- or green-colored PL. The electrochemical method is a common top-down method for GQDs.15,16 Moreover, the hydrothermal method is also a facile top-down route to obtain GQDs. In 2010, Pan et al. reported fluorescent GQDs prepared from graphene oxide (GO). The synthetic methods mainly involved thermal deoxidization of GO sheets, acid oxidation under mild ultrasonication and weakly basic hydrothermal treatment (yield was ca. 22%).2

2.1 Optical properties

2.1.1 Absorbance and PL. In addition to good physical and chemical characteristics, GQDs also exhibit excellent optical properties, which is a focus of this review. The absorbance of GQDs is mainly in the UV region (Fig. 3a). The absorbance peaks at ca. 230 nm and ca. 300 nm were often observed, and they were attributed to the π–π* transition of aromatic sp2 domains and n–π* transition of C[double bond, length as m-dash]O bonds, respectively. With the illumination of UV light, GQDs can emit bright blue-/green-colored light (Fig. 3b) with a QY of basically around 10%.
image file: c3ra47994c-f2.tif
Fig. 2 (a) Fluorescence mechanism of nitrogen-doped graphene quantum dots (N-GQDs) (b) Schemes of bandgap change of GQDs, modification of GQDs and reduction of GQDs. Reprinted with permission from: (a) ref. 21, copyright 2012 Wiley-VCH and (b) ref. 22, copyright 2013 American Chemical Society.

image file: c3ra47994c-f3.tif
Fig. 3 (a) UV-vis absorption (ABS), PL (on a 420 nm excitation), and PLE (the detection wavelength of 500 nm) spectra of the GQDs; inset: photographs of the GQDs in aqueous solution taken under visible light (left) and Xe irradiation (right). (b) The normalized PL spectra of the GQDs at different excitation wavelengths. Reprinted with permission from: ref. 30, copyright 2012 Royal Society of Chemistry.
2.1.2 Near-infrared fluorescence. As far as we know, UV/visible light does not pass through skin and tissue. Near-infrared light possesses the ability to penetrate a bio-sample and to avoid disturbance of autofluorescence in the background, thus providing a high signal to noise ratio. Therefore, the NIR region is often referred to as the “biological window.” If the CDs can be excited in the long-wavelength area, this kind of near-infrared fluorescent material is ideal for in vivo imaging.17

Up-conversion photoluminescence is a process in which the sequential absorption of two or more photons leads to the PL emission, which is shorter than the excitation wavelength. It is an anti-Stokes type emission, i.e., the photon energy of emission is higher than the excitation energy. In contrast to other emission processes based on multiphoton absorption, the up-conversion PL can be efficiently excited even at low excitation densities. The up-conversion PL has been widely observed in various structures, such as heterostructures of semiconductors, quantum wells, quantum dots and bimolecular system.

Li et al. found that graphene oxide nanoparticles can be excited by ultrafast near-infrared laser irradiation, and they are suitable for two-photon luminescence imaging.18 Shen et al. reported up-conversion luminescence of GQDs. The authors speculated that the GQDs exhibited an anti-Stokes photoluminescence (ASPL) rather than a multiphoton active process. When a bunch of low-energy photons excite the electrons of the π orbital, the π electrons transition to a high-energy state, and then the electrons jump back to a low-energy state. Thus, an upconverted PL is emitted when the electrons transition back to the σ orbital.19

Many groups reported the up-conversion PL of CDs, but some results were not real. Gan et al. summarized several publications that reported the up-conversion PL in GQDs under excitation from a xenon lamp. Experiment results revealed that the PL was artificial up-conversion emission, which was essentially excited by the second-order diffraction light of wavelength λ/2 coexisting in the red light. Real up-conversion PL from GQDs is observed under excitation with a femtosecond pulsed laser, indicating that coherent photons with high enough power density can be upconverted into blue light via GQDs.20

2.1.3 PL mechanism assumption. Many groups have tried to uncover the PL origin of GQDs through different methods. Comprehending the PL mechanism of GQDs can guide tuning of the properties of GQDs (for high quantum yield, long wavelength emission). Note that due to limited space available, only a few examples have been reviewed. Pan et al. attributed the PL phenomenon to the free zigzag sites. Blue luminescence originated from free zigzag sites with a carbene-like triplet ground state, which can be described as σ1π1.2 Zhu et al. concluded that for the GQDs prepared from GO, both defect state emission and intrinsic state emission exist, and these states lead to green- and blue-colored emission, respectively. During modification or reduction, green GQDs become blue GQDs (Fig. 2a), either of which can be applied in cell imaging.21 Liu et al. assumed that fluorescence might originate from the π–π electron transition (Fig. 2b). A strong electron donating group, dimethylamido, tuned the band gap. The large π-conjugated system in nitrogen-doped GQDs, and the strong electron donating effect of dimethylamido can facilitate the charge transfer efficiency, which enhanced the two-photon absorption.22 Wang et al. investigated the PL of GQDs through use of femtosecond transient absorption spectroscopy and femtosecond time-resolved fluorescence dynamics. A dark intrinsic state due to the quantum confinement of in-plane functional groups and two independent molecule-like states were shown to exist in the green-fluorescent GQDs.23 However, the PL mechanism of GQDs is still an open question,24 and the GQDs synthesized via different methods may process PL of different origin.
image file: c3ra47994c-f4.tif
Fig. 4 (a) TEM image of N-GQDs. Inset of (a): HRTEM image and size distribution of N-GQDs (inset). (b) AFM image of N-GQDs, inset image is height distribution of GQDs. (c) Height profile of N-GQDs corresponding to the AFM image. Reprinted with permission from: ref. 33, copyright 2012 Royal Society of Chemistry.

2.2 Toxicity

The toxicity of GQDs is a natural concern because of their potential for bio-applications. The cytotoxicity of GQDs has been evaluated by various research groups, revealing that GQDs appear to possess low toxicity (Fig. 5). As shown by the data on cell activity, cytotoxicity of GQDs was proven to be low in all the articles listed in Table 1.
image file: c3ra47994c-f5.tif
Fig. 5 (a) Effect of GQDs on MG-63 cell viability. Before MTT evaluation, cells were cultured 24 h with 100 μL of Dulbecco's modified Eagle's medium (DMEM) containing the GQDs in different doses. (b) Cytotoxicity studies of the photo-reduced GQDs and chemically reduced GQDs (48 h post treatment) on A549 cells was evaluated by the MTT method. Reprinted with permission from: (a): ref. 27, copyright 2011 Royal Society of Chemistry and (b): ref. 39, copyright 2013 American Chemical Society.
Table 1 Summary of GQDs applied in cellular imaging
Ref. Starting material Synthetic method Size QY PL color Cell Organelle
27 Graphene oxide and DMF Solvothermal method ∼5.3 nm 11.4% Green MC3T3 Cytoplasm
29 Carbon fibers Acidic exfoliation 1–4 nm   Green T47D Cytoplasm
30 Graphene oxide and ammonia Hydrothermal cutting 3 nm 7.5% Green HeLa Cytoplasm
31 Graphite rods and hydrazine Electrochemical and reduction 5–10 nm 14% Yellow PPCs, CPCs Cytoplasm
32 Triiodotriptycene Organic synthesis 40–50 nm 12.8% Green A2780, RAW264.7 Cytoplasm
33 Graphene oxide and ammonia Hydrothermal treatment 2–6 nm 24.6% Green HeLa Cytoplasm
7 CX-72 carbon black Chemical oxidation ∼15 nm 4.04% Green MCF-7 Cytoplasm, nucleus
22 Graphene oxide and DMF Solvothermal method ∼3 nm 31% Green HeLa Membrane, cytoplasm
34 Polycyclic aromatic hydrocarbon Carbonization, hydrothermal reduction 5-10 nm 11.7% Green MCF-7 Cytoplasm
35 Graphite powder Oxidizing and etching 2-4 nm 1% Green/blue A549 Cytoplasm
36 Ultrasmall graphite powder One-pot hydrothermal 1-20 nm 1.1–3.2% Green/yellow/red A549 Cytoplasm


However, Markovic et al. demonstrated that the defects and free radicals at the surface of GQDs could result in the generation of singlet oxygen. An in vitro photodynamic cytotoxicity study showed that photoexcited GQDs could cause programmed cell death via apoptosis and autophagy. Fortunately, this feature could be exploited in photodynamic therapy.25

Wu et al. investigated the cytotoxicity of GQDs in detail. The GQDs were prepared through photo-Fenton reaction of GO. The cytotoxicity of GQDs was lower than that of GO sheets, which can be proven by the effects on cell viability, internal cellular reactive oxygen species levels, damage to mitochondrial membrane potential, and cell cycle. The toxicity of GQDs did not dramatically increase with an increase in concentration. These results also demonstrated that the GQDs are internalized primarily through caveolae-mediated endocytosis.26

2.3 Application in bioimaging

Considering the properties of GQDs, they are suitable candidates for bio-applications.37,38 Table 1 lists several works reporting synthetic methods and bioimaging applications of the GQDs.

GQDs have been applied for bioimaging since Zhu et al. first used them for bioimaging in 2011.27,28 The authors performed cell viability tests on MG-63 (human osteosarcoma) cells using the methylthiazolyldiphenyl-tetrazolium bromide (MTT) assay. Addition of up to 400 mg of GQDs to 150 mL of culture medium (104 cells) did not weaken the cell activity significantly (Fig. 5a), suggesting that GQDs possess low toxicity and could be used in bioimaging and other biomedical applications at high concentrations. All these studies indicated that GQDs had low cytotoxicity and were greatly promising for bio-applications, such as in vitro and in vivo imaging studies.

Peng et al. reported a method to synthesize GQDs via the acid treatment and chemical exfoliation of traditional pitch-based carbon fibers. The size of the as-prepared GQDs varied with the reaction temperature, and the emission color and the bandgap of GQDs can be controlled accordingly. The GQDs can be applied in in vitro cellular studies using human breast cancer cell lines.29 Dong et al. reported a unique strategy to prepare GQDs by refluxing Vulcan CX-72 carbon black with concentrated nitric acid. The resultant GQDs are able to label not only the cell membrane and the cytoplasm, but also the nucleus (Fig. 6a–d).7 Zhang et al. presented a facile electrochemical method to synthesize yellow-PL-colored GQDs, which can be utilized efficiently in stem cell labeling. The GQDs formed via electrochemical oxidative cleavage of the graphite anode with subsequent reduction and functionalization (Fig. 6e and f).31


image file: c3ra47994c-f6.tif
Fig. 6 Images of human breast cancer MCF-7 cells labeled with GQDs obtained by a confocal laser scanning microscope. (a) Fluorescent image; (b) bright-field image; (c) merged fluorescent and bright-field image; and (d) section analysis. (e) Confocal fluorescence microscopy images of stem cells of NSCs and corresponding images under bright field (f). Reprinted with permission from: (a)–(d): ref. 7, copyright 2012 Royal Society of Chemistry, (e and f): ref. 31, copyright 2012 Royal Society of Chemistry.

In addition to cellular imaging, GQDs can also be used for in vivo bioimaging.18 Liu et al. discovered that GQDs synthesized via a solvothermal method can serve as efficient two-photon fluorescent probes for cellular and deep tissue imaging. The two-photon absorption cross-section of nitrogen-doped GQDs reached 48[thin space (1/6-em)]000 Göppert Mayer units, which far surpassed that of the organic dyes and was comparable to that of the high performance semiconductor QDs (Fig. 7a and b).22 Zhang et al. reported a novel kind of three-dimensional nano-graphene, which was prepared from triiodotriptycene by means of organic synthesis. The compound formed water-soluble nanoparticles with the aid of pluronic F68. The nanoparticles can be utilized not only in cell imaging, but also for in vivo imaging (excitation at 445–490 nm and emission at 570–650 nm). After intravenous injection, the nano-graphene mainly accumulates in the liver (Fig. 7c).32


image file: c3ra47994c-f7.tif
Fig. 7 (a and b) N-GQD two-photo cell imaging under (a) bright field and (b) 800 nm excitation. (c and d) In vivo fluorescence image of 3D nanographene nanoparticles (20 μL of 0.1 mg mL−1) injected subcutaneously on the left flank of a mouse. (c) Fluorescence images showing the biodistribution of 3D nanographene nanoparticles in a mouse 1 h after injection. K, Lu, Sp, Li and H indicate the kidney, lung, spleen, liver and heart, respectively. Reprinted with permission from: (a) and (b): ref. 22, copyright 2013 American Chemical Society, (c) and (d): ref. 32, copyright 2012 American Chemical Society.

2.4 Decoration and composition

Decorating GQDs and combining GQDs with other materials can make GQDs more suitable for cell imaging. Furthermore, the nanocomposites can promote potential abilities of GQDs and endow GQDs with new functionality.

Sun et al. reported that blue luminescent GQDs were prepared by photo-reducing GQDs with isopropanol, and the QY could be increased 3.7-fold. The reduced GQDs were suitable for cell imaging, because they show lower cytotoxicity (Fig. 5b) and can be more easily uptaken by cells.39 Zheng et al. reported that GQDs could be readily conjugated with a wide range of biomolecules while preserving their functionalities. Insulin-conjugated GQDs have been synthesized and utilized for specific labeling and dynamic tracking of insulin receptors in 3T3-L1 adipocytes (Fig. 8).40


image file: c3ra47994c-f8.tif
Fig. 8 Tracking the dynamics of insulin receptors in living adipocytes using total internal reflection microscopy (TIRFM). After preincubating adipocytes with insulin-GQDs to allow endocytosis and exocytosis of insulin receptors, time-lapse images were obtained under TIRFM for 2 min with a sampling frequency of 2 Hz. (a) Typical TIRFM image of a 3T3-L1 adipocyte after 1 h incubation of insulin-GQDs. Scale bar = 5 μm. (b) Membrane patch consisting of insulin-GQD/insulin receptor clusters (type I). (c) Endocytosis of fluorescent membrane patches into a vesicle (type II). (d) Exocytosis of a vesicle containing insulin-GQD/insulin receptor complexes (type III). (e) Transient approaching and retrieval of insulin-GQD/insulin receptor containing vesicle (type IV). Scale bars = 0.2 μm. Reprinted with permission from: ref. 22, copyright 2013 American Chemical Society.

Nanocomposites with an AuNC core and a GQD-doped mesoporous silica shell have been synthesized by Deng et al. Because of the local electric field amplification, the fluorescence intensity was enhanced and photostability was improved compared with those of pure GQDs in aqueous solution. The AuNCs@SiO2@GQDs nanocomposites can be applied not only to cell labeling but also to photothermal cancer therapy.41

Recently, Xue et al. synthesized PEI-functionalized GQDs, which were green-PL-colored fluorescent, independent of excitation wavelength and PL stable against pH. The PEI-GQDs can be efficiently taken up by cells and serve as fluorescent nanoprobes for biological applications.42 Qian et al. synthesized a series of GQDs functionalized by different small organic molecules, including dialcohols, diamines and dithiols. After functionalization, their emission color can be modulated and QY can be elevated; thus, the modified GQDs were applied to image HeLa cells.43

2.5 Summary of GQDs in bioimaging

Above we mainly discussed the PL properties of GQDs and their application in bioimaging. Similar to graphene and graphene oxide,44 graphene quantum dots are a type of material having excellent properties, namely, low toxicity and bight photoluminescence. Functional groups on the GQDs can be modified or linked with special molecule/nanodots, thus improving the performance of GQDs.

Novel synthetic methods have been developed to prepare GQDs from a rich source with unique characteristics. A paper reported that GQDs could be even prepared from various types of coal.45 Recently, some groups reported a method to prepare GQDs from graphite powder for bioimaging.35,36 Furthermore, if we can take advantage of other virtues of GQDs, their abundant application can be exploited. Taking advantage of the large conjugated domain, Sun et al. connected an anticancer drug onto the nanographene via a π-stacking interaction. They established a PL nanovehicle, and selective transportation was achieved via antibody-guided targeting.46 Jiang et al. prepared amine-functionalized GQDs from graphene oxide and applied them to cellular imaging. Specifically, the authors proved that amine-functionalized GQDs possess intrinsic peroxidase-like properties. GQDs were regarded as antimycoplasma materials, because they can catalyze decomposition of the hydrogen peroxide produced by M. urealyticum, which is harmful to cells.47

3 Carbon nanodots

Since the first report of CNDs,48 which were prepared via electrophoretic analysis and purification of fluorescent carbon nanotube fragments in 2004, many methods have been developed to obtain CNDs.49,50 A large number of studies investigated the application of CNDs in the bioimaging field.51,52 In fact, in some papers, carbon nanodots were also called carbon quantum dots3,53–57 because of their similarity to semiconductor crystals. In most cases, the quantum effect is not the main reason for the PL; thus, we would rather refer to this type of nanocarbon material as carbon nanodots.

3.1 Species of the CNDs

CNDs have a much more comprehensive definition compared to GQDs. In order to demonstrate the bio-application of CNDs, it is necessary to introduce the species of CNDs briefly in this section (Fig. 9). Although this summary is not complete, the examples listed are representative.
image file: c3ra47994c-f9.tif
Fig. 9 Scheme of CDs of different species.
3.1.1 CNDs from carbon structures. Since the discovery of CNDs in 2004, top-down methods predominated in the following years. The starting materials included amorphous carbon (candle soot, and carbon black) and regular sp2 carbon layers (graphite rod and carbon nanotubes). Many methods have been developed to break down the carbon structure: arc discharge, laser ablation, electrochemical oxidation, and nitric acid/sulfuric acid oxidation. The synthetic methods are complicated, and the QY of the CNDs is low; thus, the resultant CNDs may not be suitable for direct cell imaging.

Liu et al. reported a multi-step method to obtain multicolor photoluminescent CDs in 2009. Satellite-like polymer/F127/silica composites were prepared as carbon precursors. The subsequent high temperature treatment and removal of silica carriers generated nanosized CNDs. Acid treatment and simple surface passivation finally resulted in the product. The aqueous CNDs with excitation dependence PL properties were applied to image E. coli ATCC 25922 cells with blue/green/red color.58

Qiao et al. developed a general and facile method to prepare multicolor photoluminescent CNDs. The activated carbon with an amorphous structure was easily etched into individual CNDs by treatment with nitric acid, and then the CNDs were passivated using amine-terminated compounds. The CNDs were excellent candidates for a live-cell fluorescent imaging agent.60

Passivation was an important route to improve/tune the properties of CDs from top-down methods. In 2006, Sun et al. reported that laser-ablated, amorphous carbon nanoparticles could emit in the visible spectral range upon surface functionalization with polymer chains. Nanosized pure carbon particles may be surface-passivated to exhibit bright photoluminescence in the visible wavelength section. Then, surface passivation became an important means to increase the QY of CNDs substantially, because surface energy trapped on the bare dot surface became emissive after passivation.3 Li et al. reported that the passivated CDs exhibit no apparent cytotoxicity, and they were shown to successfully target cancer cells by conjugation with transferrin. Moreover, the CNDs were applied in in vitro cancer diagnostics. Through conventional bioconjugation chemistries, these CNDs can be transformed into functionalized nanoprobes.79

3.1.2 CNDs from small molecules. Through dehydration and carbonization, small molecules can form CNDs. Moreover, the PL color and QY can be tuned via adjusting the ratio of reagents or the amount of assistant inorganic substrate (e.g. NaOH, H3PO4, KH2PO4). Citric acid,70 glycerol,66,69 amino acid,80 ascorbic acid81 and other molecules with abundant hydroxyl, carboxyl and amine groups are suitable carbon precursors. Moreover, carbohydrates are often referred to as the ideal carbon resource.64,68,72,74,82–84 For example, Yang et al. synthesized fluorescent CNDs by hydrothermal treatment of glucose in the presence of monopotassium phosphate. HepG2 cells can uptake the CNDs and emit blue PL observed by a fluorescence microscope.64 Bhunia et al. attempted to synthesize CNDs from different kinds of carbohydrates. Highly fluorescent carbon nanoparticles with tunable visible emission (Fig. 12f) from blue to red have been synthesized at the gram scale. The CNDs were further applied in cell labeling.74 Many other groups reported CNDs prepared via bottom-up methods, in which synthetic methods mainly involve hydrothermal, microwave-assisted pyrolysis and calcination.

In recent years, many works reported water soluble CNDs made from biomaterials (even food). These kinds of CNDs are always highly water-soluble and possess no obvious cytotoxicity. CNDs can be derived from plant extracts, such as banana juice,85 strawberry,86 grape juice,78 orange juice,75 pomelo peel,87 watermelon peel,63 pepper,88 soy milk,89 honey,90 grass,91,123 willow bark92 and leaves from different plants.93 Bio-products from animals, such as, bovine serum albumin,94 silk,95,96 hair fibre,76 barbecue meat,97 and eggs,98,99 can also be regarded as CND raw materials. Considering the examples listed above, we find that carbon sources are macromolecules (proteins or polysaccharides) in nature. In some sense, these kinds of CNDs are PDs, which will be further discussed in Section 4.

3.2 Properties of the CNDs

Due to the many types of CNDs, it is hard to illustrate all the properties of CNDs formed from different species. Some general properties related to bioimaging are listed in Table 2 and summarized in this section.
Table 2 Summary of CNDs applied in cellular imaging
Ref. Starting material Synthetic method Size PL color QY Cell Organelle
58 Resol/F127/silica composite Calcination 1.5–2.5 nm Blue/green/red 14.7% E. coli  
59 Carbon soot Nitric acid oxidation 2–6 nm Blue-yellow 3% EAC  
60 Commercially activated carbon Treatment with nitric acid 2–6 nm Green 12.6% COS-7 Membrane, cytoplasm
61 C60 fullerene Electrochemical ∼5 nm Blue/green/red 5–6% A549, MCF-7 Cytoplasm
62 Citric acid and AEAPMS Heat ∼0.9 nm Blue 47% BGC823  
63 Watermelon peel Carbonization (220 °C) ∼2.0 nm Blue/green 7.1% HeLa Cytoplasm
64 Glucose Hydrothermal (200 °C) ∼3.83 nm Green 11% HepG2 Cytoplasm
65 Carbon xerogel Combustion with nitric acid 5–10 nm Blue/green   S. aureus  
66 Glycerol and PEI Microwave-assisted pyrolysis 4–12 nm Blue/green/red 15.3% COS-7 Cytoplasm
67 Glycine Hydrothermal (300 °C) 2.1–3.1 nm Green 30.6% MCF-10A, MCF-7 Membrane, cytoplasm
68 Glucose and TTDDA Microwave pyrolysis 2–7 nm Green 2% HeLa, MCF-7, NIH-3T3 Membrane, cytoplasm
69 Glycerol solvent Pyrolysis 2.7–3.3 nm Blue 32% HeLa Cytoplasm
70 Citric acid and amine Microwave pyrolysis 2.2–3.0 nm Blue/green/red 30.2% L929 Membrane, cytoplasm
71 BSA and TTDDA Hydrothermal (180 °C) 2–6 nm Blue 11% SW1116 Membrane, cytoplasm
72 Sucrose and oil acid Heating (215 °C) ∼1.84 nm Green 21.6% 16HBE Cytoplasm
73 Citric acid and ethylenediamine Hydrothermal (200 °C) 2–6 nm Blue 80% MC3T3 Cytoplasm
74 Carbohydrate Heat 1–10 nm Blue/green/yellow/red 6–30% HeLa  
75 Orange juice Hydrothermal (120 °C) 1.5–4.5 nm Blue/green 26% MG-63 Cytoplasm
76 Hair fiber Carbonization and etching 2–10 nm Blue 11.1% HeLa Membrane, cytoplasm
77 Phytic acid and ethylenediamine Microwave assisted 6–11 nm Green 21.65% L929  
78 Grape juice Hydrothermal (180 °C) ∼2.7 nm Green 13.5% HeLa Cytoplasm


As a fluorescent material, the PL properties are similar to those of GQDs. Because of the abundance of species, the PL wavelength can spread from blue to near-infrared. Two main reasons lead to the wide wavelength range. The first one is PL excitation dependence. We claimed a kind of fluorescent material is PL excitation dependent, if the emission peaks move as excitation wavelength is changed. Such behaviors were often observed in CNDs, which may applicable for multicolor imaging (Fig. 10a and b). The PL excitation dependence may result from relative intensity changes of a few emission species100 or optical selections of different sized nanoparticles and/or different emissive traps on the C-dot surface.49 The second reason for multi PL color is that the PL color can be tuned by synthetic74 and/or purification methods101 (Fig. 10c). Using different synthetic conditions or different excitation, the PL color of CNDs can be tuned from blue to red (Fig. 10).


image file: c3ra47994c-f10.tif
Fig. 10 (a and b) Aqueous solution of PEG1500N-attached carbon dots (a) excited at 400 nm and photographed through band-pass filters of different wavelengths as indicated, and (b) excited at the indicated wavelengths and photographed directly. (c) Fluorescent carbon nanoparticles were derived from candle soot and purified via polyacrylamide gel electrophoresis (PAGE). Nine fast-moving fluorescent bands were collected and characterized (mobility decreased in the order from 1–9). Optical images illuminated under white (top) and UV light (312 nm; center). Bottom: fluorescence emission spectra (excitation at 315 nm) of the corresponding CNP solutions. The maximum emission wavelengths are indicated above the spectra. Reprinted with permission from: (a) and (b): ref. 3, copyright 2006 American Chemical Society and (c): ref. 101, copyright 2007 Wiley-VCH.

Usually, the QY of CNDs is around 10%, which is enough for cellular imaging. Sun's group improved the QY via passivation and doping.3,102–104,107 Anilkumar et al. passivated small carbon nanoparticles by a combination of the surface doped with nanoscale semiconductors and the organic functionalization, coupled with gel column fractionation to harvest the most fluorescent CNDs, which exhibited fluorescence emission QYs of up to 78%.104 The QY of CNDs has been increased in recent years, as the synthetic methods have been improved. The highest reported QY of CNDs reached 80%, which is on the same level of organic dye. A high QY is beneficial for observing cells under a microscope and for reducing the dose of CNDs. The size of the CNDs is usually smaller than 10 nm (Fig. 11), which is suitable to pass through the membrane and stay in the cytoplasm (Fig. 12).


image file: c3ra47994c-f11.tif
Fig. 11 (a and b) TEM images of blue-PL-colored CNDs (a) and green-PL-colored CNDs (b). Inset: the SAED pattern (upper inset) and high-resolution TEM image of an individual dot (lower inset) (c) HRTEM image of CNDs surface-passivated with PEG1500N. The inset is the SAED pattern. (d) AFM topography image of CNDs on mica substrates with the height profile along the line in the image. Reprinted with permission from: (a and b): ref. 64, copyright 2011 Royal Society of Chemistry, (c and d): ref. 58, copyright 2009 Wiley-VCH.

image file: c3ra47994c-f12.tif
Fig. 12 (a and b) Representative bright-field and PL images of MCF-10A cells treated with CNDs prepared from glycine. The cells were excited with blue light (460–480 nm). The concentration of CNDs was 0.86 mg mL−1. (c and d) MG-63 cells were cultured and maintained in DMEM containing CNDs. Confocal images of the cells by excitation at (c) 488 nm and (d) 405 nm. (e) Laser scanning confocal microscopy images of CND-labeled L929 cells. (f) CNDs were incubated with HeLa cells for 3–6 hours, and labeled cells were imaged under fluorescence microscope. Reprinted with permission from: (a and b): ref. 67, copyright 2012 Royal Society of Chemistry, (c and d): ref. 75, copyright 2012 Royal Society of Chemistry, (e): ref. 70, copyright 2012 Royal Society of Chemistry and (f): ref. 74, copyright 2013 Nature Publishing Group.

Photostability is a key property for the fluorescent materials, which hold potential for application in bioimaging field. Organic dye, which has been widely used in bioimaging field, suffers from a serious photobleaching drawback. Photo blinking impairs the bioimaging results of QDs. Although CNDs have been synthesized via both the top-down cutting and bottom-up carbonization routes, many types of CNDs possess excellent photostability,58,60–64,66,102 making them ideal materials for bioimaging.

Sahu et al. prepared CDs from orange juice. In addition, the authors claimed that there was no reduction in luminescence intensity even after excitation for a prolonged time.75 Qiao et al. developed a direct chemical oxidation route to prepare biocompatible CNDs with multicolor photoluminescence. No obvious PL intensity reduction was observed in an experiment of continuously repeating excitations for 10 h with a UV lamp at a wavelength of 365 nm;60 however, all the CNDs are not completely photostable. The CNDs synthesized via top-down methods seem to have better photostability compared with the CNDs prepared via bottom-up carbonization methods. The weak photostability may be derived from the unstable PL centers (molecular states). During the lengthy UV irradiation, the PL intensity may decrease in some situations. Fortunately, with the help of compositing, the photostability of CDs can be improved.

3.3 Applications in bioimaging

As described above, CNDs are certainly viable candidates for cellular imaging. Many works, with differences in methods yet similarity in notions, have been published in this field. Several typical examples related to cell imaging are listed in the Table 2, in which the starting material, synthetic methods and properties of CNDs are summarized. Due to the length of this review, these examples will not be discussed in detail. We will focus on in vivo imaging in this section.

Actually, some CDs really possess PL up-conversion properties. Furthermore, two- or multi-photon absorption is a common property in carbon-based materials.105,106 Cao et al. reported that CNDs exhibited strong luminescence with two-photon excitation in the near-infrared region. Two-photon luminescence microscopic imaging of CNDs internalized in MCF-7 cells was demonstrated.107

In 2009, Yang et al. reported the first study of CDs for optical in vivo imaging. Surface-passivated and ZnS-doped CNDs were synthesized. Upon injection of a CND solution, mice were imaged using a Lumazone FA in vivo imaging system. The injected CNDs in mice diffused relatively slowly with the fluorescence fading about 24 h post-injection. CNDs can be injected into mice via subcutaneous, interdermal and intravenous injection and can be detected by 470 nm or 545 nm excitation. The biocompatibility and nontoxic characteristics of CNDs were also demonstrated (Fig. 13).102


image file: c3ra47994c-f13.tif
Fig. 13 A carbon dot solution (440 μg in 200 μL) was intravenously injected into mice for whole body circulation. The abdomen was shaved for fluorescence detection of the dots trapped in organs via the circulation. (a) Bright field, (b) as-detected fluorescence (Bl: bladder and Ur: urine) and (c) color-coded images. The same order for the images of the dissected kidneys (lower left) and liver (lower right). Reprinted with permission from: ref. 102, copyright 2009 American chemical society.

In 2012, Tao et al. obtained their product from carbon nanotubes and graphite after a mixed-acid treatment. In vivo fluorescence imaging with CNDs was then demonstrated in mouse experiments, by using various excitation wavelengths, including some in the near-infrared region. Furthermore, in vivo biodistribution and toxicology of those CNDs in mice over different periods were studied: no noticeable signs of toxicity of CNDs in the treated animals were discovered (Fig. 14).108


image file: c3ra47994c-f14.tif
Fig. 14 In vivo fluorescence imaging. In vivo fluorescence images of a CND-injected mouse. The images were taken under various excitation wavelengths at 455, 523, 595, 605, 635, 661, and 704 nm. Red and green represent fluorescent signals of CNDs and tissue autofluorescence, respectively. Reprinted with permission from: ref. 108, copyright 2012 Wiley-VCH.

Shi et al. reported a method for hydrothermal treatment of ethylenediamine tetraacetic acid to obtain highly soluble nitrogen-doped CNDs. Zebrafish were incubated with the CNDs, and the CNDs could be absorbed through swallowing and the skin. The CNDs accumulated selectively in the eye, yolk sac and tail of the zebrafish, and the green emission of CNDs could be easily observed. The application of CNDs in the zebrafish supports the eventual use of CNDs in clinical applications as a probe with low toxicity.109 The in vivo kinetic behaviors of the CNDs were investigated recently,110 and the results further proved the practicality of CNDs for in vivo applications.

3.4 Functionalization and nanocomposites

CNDs can be modified to exploit enhanced properties and diverse functions. Chandra et al. prepared green-PL-colored CNDs by microwave irradiation of sucrose with phosphoric acid. Fluorescein, rhodamine B and α-naphthylamine were functionalized onto the dots through EDC condensation. The fluorescence was improved, while the cytotoxicity decreased. Interestingly, the functionalized CNDs achieved maximum fluorescence intensity when excited at 225 nm, and the peak position was the same as that of the position of CNDs. The CNDs entered into human red blood cells (RBC), suggesting their potential application in bio-sensing and drug delivery.111 Song et al. prepared CNDs via a microwave pyrolysis method. Then, folic acid was conjugated onto the dots, and the functionalized CNDs can be utilized for targeting and detecting cancer cells.68

Anilkumar et al. reported cross-linked CNDs. The surface functionalization on the dots was further stabilized to achieve probes with high physicochemical and photochemical stabilities.112 Goh et al. reported cellular and in vivo bioimaging of PEG diamine-capped CNDs synthesized via the pyrolysis of citric acid in a hot solvent. Hyaluronic acid was linked to the dots to improve receptor-mediated endocytosis and specific delivery.113 Tian's group found that CNDs could be designed as an integrated biosensor.114–116 Combining CNDs with other materials, the resulting hybrids can be used to image the cell and monitor the pH value (or Cu2+ concentration) at the same time (Fig. 15).


image file: c3ra47994c-f15.tif
Fig. 15 (a) Schematic illustration of dual-emission fluorescent sensing of Cu2+ ions based on a CdSe@C-TPEA nanohybrid. (b) Schematic illustration of CD-TPY nanoprobes for two-photon pH imaging and biosensing. Receptor-AE-TPY binding onto CNDs was achieved through a condensation reaction of amino and carboxyl with NHS and EDC as catalysts. In the sensing process, photochemical cycle was regulated by N atoms protonation and deprotonation with the pH values change in the nanoprobe solution. Reprinted with permission from: (a): ref. 115, copyright 2012 Wiley-VCH and (b) ref. 114, copyright 2012 Wiley-VCH.

Note that carbon-silica hybrid dots have been investigated by Jeong et al. Fullerene-based silica nanoparticles were achieved by a reverse microemulsion method. These particles showed excellent properties for bioimaging applications.117 Lai et al. heated a mixture of mesoporous SiO2 nanoparticles, glycerol and PEG–NH2 to 230 °C. Dehydration of glycerol subsequently catalyzed the formation of unsaturated aldehydes, which can serve as the carbon precursor on which the growth of CNDs is induced. Mesoporous silica nanoparticles can serve as a nano-reactor to improve particle homogeneity, and polyethylene glycol (PEG) was conjugated onto the CNDs@SiO2 to enhance their luminescence, stability and biocompatibility. The nanocomposites can be used to image HeLa cells and deliver DOX at the same time.69

3.5 Summary of CNDs in bioimaging

CNDs are a versatile material formed from a wide range of starting materials and via various synthetic methods. In addition to their excellent photoluminescent properties, their biocompatibility and low toxicity make them ideal candidates for bioimaging. CNDs will show more advantages in bioapplications after proper functionalization, namely, passivation with polymer, decorating with organic molecules, doping with inorganic salt and hybridization with silica. Abundant species of CDs with diverse properties will satisfy multiple requirements. Not limited to use as a probe, CNDs can be further applied in drug/gene delivery and cancer diagnostics.79

Liu et al. constructed a nano-scale gene vector based on PEI-functionalized CDs via a one-step microwave-assisted method. The PEI polymer chain passivated the surface to enhance PL and acted as a polyelectrolyte to condense DNA for gene transfection.66 Tang et al. reported a drug delivery system developed with direct and sensitive Förster resonance energy transfer (FRET)-based CNDs. CNDs were synthesized via a modified electrochemical method and served as both drug carriers and PL detectors in the system. Doxorubicin (DOX) was adsorbed onto the CND surface via electrostatic interaction and π–π stacking. The release of DOX can be monitored by the FRET PL system and tuned by the pH of the environment. Folic acid was also covalently attached to CNDs for specific targeting of human cancer cells.118 Recently, Karthik et al. developed fluorescent CDs tethered to a quinoline-based phototrigger for regulated delivery of anticancer drugs. The decorated CNDs can enter the cytoplasm, as well as nucleus of cells, and loaded drug can be released using both one-photon and two-photon excitation.8

In addition to bioimaging, sensing is another common application of the carbon dots. Metal ions, such as Fe3+,6,34,93,119–121 Cu2+,53,115–116,122–123 Hg2+[thin space (1/6-em)]86–87, 124 and 139 and Pb2+,94 can be selectively detected based on CD PL quenching. Hypochlorite,88 glutathione,99 nitrite,125 thrombin,126 glucose,92 and others can be quantitatively analyzed. pH86,114,121 and temperature121 sensing systems can also be achieved. Facile operation, low limit of detection and rapid response are the advantages of CND-based sensors. Considering the biocompatibility of CNDs, these sensors may be further utilized in cells and even in vivo. Monitoring the intensity ratios of dual fluorescence bands is superior to monitoring single wavelength PL quenching, because interference factors, such as concentration, optical path length and source intensity, can be avoided. Qu et al. investigated a ratiometric fluorescent CND-based nanosensor, which could monitor the intensity ratio of two well-resolved wavelengths for quantitative sensing of temperature, pH value and ferric ions.121

4 Polymer dots

Polymer dots are a special kind of CDs made from polymers. In a narrow sense, the semiconducting polymer dots127,128 were not included in this review, because the PL comes from the starting material, the conjugated polymer chain, rather than the dot. The concept of polymer dots is indistinct and not well accepted by the public at present. In fact, it may not be very logical to separate PDs from the definition of CNDs due to the similarity between CNDs and PDs in terms of chemical and fluorescent properties. However, the polymer, a special starting material of CDs, endows the CDs with unique properties and applications. The polymer chain, which stretches from the cross-linked/carbonized center, passivates and stabilizes the PL center. Furthermore, the polymer chain can be easily decorated and functionalized. The PDs possess a lower degree of carbonization compared with CNDs. The crystal carbon cores of PDs are usually unobvious.

Water-soluble polymers with hydroxyl and amino groups tend to condense, dehydrate, and form cross-linked and carbonized structures upon heating. PDs can also be prepared by heating polymerizable monomers with a one-pot method. For example, polymer nanodots were obtained by one-pot hydrothermal treatment of a hybrid carbon source (glucose and glycine).119 To date, only a few studies have reported PDs and their use in bioimaging. These reports are summarized in Table 3. We found that PDs are becoming hot spots; thus, we are trying to illustrate this concept through some typical examples in this section.

Table 3 Summary of PDs applied in cellular imaging
Ref. Starting material Synthetic method Size PL color QY Cell Organelle
129 Chitosan Hydrothermal(180 °C) 4–7 nm Green 43% A549 Membrane, cytoplasm
130 Poly(vinyl alcohol) Hydrothermal(200 °C) 2–7 nm Blue 1.26% MC3T3  
95 Cocoon silk Hydrothermal(200 °C) ∼70 nm Green 38% HeLa, MCF-7 Cytoplasm
131 Polyacrylamide Hydrothermal(260 °C) 5–50 nm Green 12.7% LnCaP Cytoplasm
132 DNA Self-assembling (80 °C) ∼12 nm Green 3.65% MCF-7 Membrane, cytoplasm
133 Polyethyleneimine, polylactide Ring-opening polymerization ∼50 nm Blue/green/red 31% MCF-7  
134 Branched polyethyleneimine Oxidation and hydrothermal 3–4 nm Blue 54.3% MCF-7 Cytoplasm
135 Chitosan Pyrolysis and passivation 5–8 nm Blue/green/red 5.06% E. coli and S. aureus  


Yang et al. fabricated fluorescent carbon nanoparticles via hydrothermal carbonization of chitosan at 180 °C. The carbon nanoparticles possessed excitation-dependent PL property. Strong blue PL can be observed under UV excitation, and the QY can reach as high as 43%. The dots were 4–7 nm in diameter, and they were positively charged. They were applied to bioimaging of human lung adenocarcinoma A549 cells (Fig. 16).129


image file: c3ra47994c-f16.tif
Fig. 16 (a) A confocal fluorescence microphotograph of A549 cells labeled with PDs at 37 °C for 24 h. (lex: 405 nm). (b) A bright field microphotograph of the cells. (c) An overlay image of (a) and (b). (d) A schematic illustration of the preparation procedure of PDs by hydrothermal carbonization of chitosan. Reprinted with permission from: ref. 129, copyright 2011 Royal Society of Chemistry.

By describing the example of hydrothermal treatment of poly(vinyl alcohol) (PVA) to obtain PDs that are fluorescent in aqueous solution, Zhu et al. reported that a general hydrothermal method can be used to prepare fluorescent PDs from non-conjugated polymers. A single excited state was demonstrated in the PL mechanism by ultrafast spectroscopy. The presented method can also be applied to poly(ethylene imine) (PEI), polysaccharides, cellulose and starch. Although the QY was very low, the non-toxic PDs can be applied in cellular imaging (Fig. 17a and b).130 Because of the existence of soft polymer chains outside the carbon core, the as-prepared PDs can be easily mixed with polymer materials for improved stability and functionality (Fig. 17c). The nanocomposite films had multi-color emission properties using different excitations, due to the excitation-dependent behavior of PDs.136


image file: c3ra47994c-f17.tif
Fig. 17 (a) Scheme of the carbonization process of PVA chains to form PDs. (b) Effect of PDs on MC3T3 cell viability. (c) Blending PVA with PDs to prepare the nanocomposite film. Reprinted with permission from: (a and b): ref. 130, copyright 2012 Royal Society of Chemistry and (c): ref. 136, copyright 2012 Chinese Chemical Society.

Recently, Li et al. reported a simple and green route to synthesize water-soluble and nitrogen-doped polymer-like carbonaceous nanospheres through hydrothermal treatment of cocoon silk in water, which had been successfully used in imaging living cells and MCF-7 cell tissues at a depth of 60–120 μm.95 Gu et al. reported the preparation of a kind of self-passivated fluorescent carbon nanoparticles. Green-PL-colored dots were synthesized in one step by hydrothermal treatment (260 °C) of polyacrylamide. The core size of CNDs can be controlled from 5 to 50 nm by increasing the hydrothermal time. PDs were applied in labeling LnCaP cells, and the endocytosis mechanism for cellular uptake was investigated.131 Guo et al. reported a new class of PDs that were derived from DNA via self-assembly at low temperatures. Double-stranded DNA became single-stranded DNA first, followed by self-assembly and conversion into PDs. Moreover, the biocompatible dots can be successfully utilized in cellular imaging.132

In addition to bioimaging, PDs can be used to deliver drugs133 or genes.134 Sun et al. reported multifunctional PDs possessing excitation dependent fluorescence behavior and multicolor fluorescence to be used as imaging-guided drug delivery vehicles. Paclitaxel was encapsulated within the hydrophobic core of the PDs using modified emulsion/solution methods, and the drug can be released rapidly in acidic conditions. In vivo imaging was achieved by subcutaneous and intramuscular injection of PDs into nude mice. After intravenous injection, liver showed the strongest fluorescent signals.133

5 Conclusions

In this review, we mainly reviewed three kinds of CDs, focusing on synthetic methods, properties and bioimaging applications. CDs are newly developing fluorescent materials, which possess the potential for replacing the traditional fluorescent materials (QDs and organic dyes). They are expected to be a suitable material for in vitro and in vivo applications, because of their good aqueous solubility, bright PL performance, photo/chemical stability, low toxicity as well as biocompatibility. The PL natures of CDs are important properties, which are propitious to bioimaging and sensing. CDs always possess abundant chemical groups, which endow them the ability to be efficiently functionalized with bioactive species. As a result, the CD-based composites could have the integrated advantage of targeting in cellular/in vivo imaging and related biomedical applications. Furthermore, on loading of drugs and genes via facile chemical/physical integration, CDs show potential for diagnostic and therapeutic applications in vivo. The abundant species of CDs provide diverse options to satisfy the requirements of specific bioimaging or biomedical applications.

The reasonable definition and effective classification of emerging CDs are urgent tasks for further exploiting the related bioapplications. Increasing numbers of reported CDs have expanded the definition of the first CDs. As a result, CDs should include GQDs with a single or few layers, CNDs with/without a crystal lattice structure, and PDs with a carbon core or molecule-like PL centers. In addition, CDs are one member of the large family of carbon-based materials. As the cousin of GQDs, ultrathin graphitic-phase C3N4[thin space (1/6-em)]123 nanosheets are also photoluminescent and can be utilized in cell imaging.137 Some special kinds of fluorescent carbon materials, for example, graphene oxide, carbon nanotube, fullerene and nanodiamond,138 are also fit for bioapplications. In addition to CDs, all carbon materials are hot research topics at present and in the near future.

The PL emission in the IR region offers effective penetration in tissue, which is significant for application in in vivo bioimaging. The CDs with long-wavelength-excitation and/or two-photon absorption exhibit good performance in the bioimaging field. However, most reported CDs can only be excited by UV light, which restricts their use in in vivo imaging. For further bioapplications of CDs, CDs with high QY and red/near-infrared emission are highly desired. Robust and facile synthetic methods for CDs with up-conversion PL are expected in the future.

Acknowledgements

This work was financially supported by the National Science Foundation of China (NSFC) (no. 51373065, 21221063, 91123031), the National Basic Research Program of China (973 Program) (no. 2012CB933800) and the Specialized Research Fund for the Doctoral Program of Higher Education (no. 20130061130010).

Notes and references

  1. L.-s. Li and X. Yan, J. Phys. Chem. Lett., 2010, 1, 2572–2576 CrossRef CAS.
  2. D. Pan, J. Zhang, Z. Li and M. Wu, Adv. Mater., 2010, 22, 734–738 CrossRef CAS PubMed.
  3. Y.-P. Sun, B. Zhou, Y. Lin, W. Wang, K. A. S. Fermando, P. Pathak, M. J. Meziani, B. A. Harruff, X. Wang, H. Wang, P. G. Luo, H. Yang, M. E. Kose, B. Chen, L. M. Veca and S.-Y. Xie, J. Am. Chem. Soc., 2006, 128, 7756–7757 CrossRef CAS PubMed.
  4. L. Bao, Z.-L. Zhang, Z.-Q. Tian, L. Zhang, C. Liu, Y. Lin, B. Qi and D.-W. Pang, Adv. Mater., 2011, 23, 5801–5806 CrossRef CAS PubMed.
  5. S. H. Jin, D. H. Kim, G. H. Jun, S. H. Hong and S. Jeon, ACS Nano, 2013, 7, 1239–1245 CrossRef CAS PubMed.
  6. Y. Song, S. Zhu, S. Xiang, X. Zhao, J. Zhang, H. Zhang, Y. Fu and B. Yang, Nanoscale, 2014, 6, 4676–4682 RSC.
  7. Y. Dong, C. Chen, X. Zheng, L. Gao, Z. Cui, H. Yang, C. Guo, Y. Chi and C. M. Li, J. Mater. Chem., 2012, 22, 8764–8766 RSC.
  8. S. Karthik, B. Saha, S. K. Ghosh and N. D. Pradeep Singh, Chem. Commun., 2013, 49, 10471–10473 RSC.
  9. J. Shen, Y. Zhu, X. Yang and C. Li, Chem. Commun., 2012, 48, 3686–3699 RSC.
  10. S. Zhu, S. Tang, J. Zhang and B. Yang, Chem. Commun., 2012, 48, 4527–4539 RSC.
  11. Z. Zhang, J. Zhang, N. Chen and L. Qu, Energy Environ. Sci., 2012, 5, 8869–8890 CAS.
  12. L. Li, G. Wu, G. Yang, J. Peng, J. Zhao and J.-J. Zhu, Nanoscale, 2013, 5, 4015–4039 RSC.
  13. Z. X. Gan, S. J. Xiong, X. L. Wu, T. Xu, X. B. Zhu, X. Gan, J. H. Guo, J. C. Shen, L. T. Sun and P. K. Chu, Adv. Optical Mater., 2013, 1, 926–932 CrossRef.
  14. R. Liu, D. Wu, X. Feng and K. Mullen, J. Am. Chem. Soc., 2011, 133, 15221–15223 CrossRef CAS PubMed.
  15. Y. Li, Y. Hu, Y. Zhao, G. Shi, L. Deng, Y. Hou and L. Qu, Adv. Mater., 2011, 23, 776–780 CrossRef CAS PubMed.
  16. Y. Li, Y. Zhao, H. Cheng, Y. Hu, G. Shi, L. Dai and L. Qu, J. Am. Chem. Soc., 2012, 134, 15–18 CrossRef CAS PubMed.
  17. C. L. Amiot, S. Xu, S. Liang, L. Pan and J. X. Zhao, Sensors, 2008, 8, 3082–3105 CrossRef CAS PubMed.
  18. J.-L. Li, H.-C. Bao, X.-L. Hou, L. Sun, X.-G. Wang and M. Gu, Angew. Chem., Int. Ed., 2012, 51, 1830–1834 CrossRef CAS PubMed.
  19. J. Shen, Y. Zhu, C. Chen, X. Yang and C. Li, Chem. Commun., 2011, 47, 2580–2582 RSC.
  20. Z. Gan, X. Wu, G. Zhou, J. Shen and P. K. Chu, Adv. Optical Mater., 2013, 1, 554–558 CrossRef.
  21. S. Zhu, J. Zhang, S. Tang, C. Qiao, L. Wang, H. Wang, X. Liu, B. Li, Y. Li, W. Yu, X. Wang, H. Sun and B. Yang, Adv. Funct. Mater., 2012, 22, 4732–4740 CrossRef CAS.
  22. Q. Liu, B. Guo, Z. Rao, B. Zhang and J. R. Gong, Nano Lett., 2013, 13, 2436–2441 CrossRef CAS PubMed.
  23. L. Wang, S.-J. Zhu, H.-Y. Wang, Y.-F. Wang, Y.-W. Hao, J.-H. Zhang, Q.-D. Chen, Y.-L. Zhang, W. Han, B. Yang and H.-B. Sun, Adv. Optical Mater., 2013, 1, 264–271 CrossRef.
  24. L. Wang, S.-J. Zhu, H.-Y. Wang, S.-N. Qu, Y.-L. Zhang, J.-H. Zhang, Q.-D. Chen, H.-L. Xu, W. Han, B. Yang and H.-B. Sun, ACS Nano, 2014, 8, 2541–2547 CrossRef CAS PubMed.
  25. Z. M. Markovic, B. Z. Ristic, K. M. Arsikin, D. G. Klisic, L. M. Harhaji-Trajkovic, B. M. Todorovic-Markovic, D. P. Kepic, T. K. Kravic-Stevovic, S. P. Jovanovic, M. M. Milenkovic, D. D. Milivojevic, V. Z. Bumbasirevic, M. D. Dramicanin and V. S. Trajkovic, Biomaterials, 2012, 33, 7084–7092 CrossRef CAS PubMed.
  26. C. Wu, C. Wang, T. Han, X. Zhou, S. Guo and J. Zhang, Adv. Healthcare Mater., 2013, 2, 1613–1619 CrossRef CAS PubMed.
  27. S. Zhu, J. Zhang, C. Qiao, S. Tang, Y. Li, W. Yuan, B. Li, L. Tian, F. Liu, R. Hu, H. Gao, H. Wei, H. Zhang, H. Sun and B. Yang, Chem. Commun., 2011, 47, 6858–6860 RSC.
  28. S. J. Zhu, J. H. Zhang, X. Liu, B. Li, X. F. Wang, S. J. Tang, Q. N. Meng, Y. F. Li, C. Shi, R. Hu and B. Yang, RSC Adv., 2012, 2, 2717–2720 RSC.
  29. J. Peng, W. Gao, B. K. Gupta, Z. Liu, R. Romero-Aburto, L. Ge, L. Song, L. B. Alemany, X. Zhan, G. Gao, S. A. Vithayathil, B. A. Kaipparettu, A. A. Marti, T. Hayashi, J. J. Zhu and P. M. Ajayan, Nano Lett., 2012, 12, 844–849 CrossRef CAS PubMed.
  30. D. Pan, L. Guo, J. Zhang, C. Xi, Q. Xue, H. Huang, J. Li, Z. Zhang, W. Yu, Z. Chen, Z. Li and M. Wu, J. Mater. Chem., 2012, 22, 3314–3318 RSC.
  31. M. Zhang, L. Bai, W. Shang, W. Xie, H. Ma, Y. Fu, D. Fang, H. Sun, L. Fan, M. Han, C. Liu and S. Yang, J. Mater. Chem., 2012, 22, 7461–7467 RSC.
  32. C. Zhang, Y. Liu, X.-Q. Xiong, L.-H. Peng, L. Gan, C.-F. Chen and H.-B. Xu, Org. Lett., 2012, 14, 5912–5915 CrossRef CAS PubMed.
  33. C. Hu, Y. Liu, Y. Yang, J. Cui, Z. Huang, Y. Wang, L. Yang, H. Wang, Y. Xiao and J. Rong, J. Mater. Chem. B, 2013, 1, 39–42 RSC.
  34. L. Zhou, J. Geng and B. Liu, Part. Part. Syst. Charact., 2013, 30, 1086–1092 CrossRef CAS.
  35. Y. Sun, S. Wang, C. Li, P. Luo, L. Tao, Y. Wei and G. Shi, Phys. Chem. Chem. Phys., 2013, 15, 9907–9913 RSC.
  36. X. Zhang, S. Wang, M. Liu, B. Yang, L. Feng, Y. Ji, L. Tao and Y. Wei, Phys. Chem. Chem. Phys., 2013, 15, 19013–19018 RSC.
  37. H. Shen, L. Zhang, M. Liu and Z. Zhang, Theranostics, 2012, 2, 283–294 CrossRef CAS PubMed.
  38. J.-L. Li, B. Tang, B. Yuan, L. Sun and X.-G. Wang, Biomaterials, 2013, 34, 9519–9534 CrossRef CAS PubMed.
  39. H. Sun, L. Wu, N. Gao, J. Ren and X. Qu, ACS Appl. Mater. Interfaces, 2013, 5, 1174–1179 CAS.
  40. X. T. Zheng, A. Than, A. Ananthanaraya, D.-H. Kim and P. Chen, ACS Nano, 2013, 7, 6278–6286 CrossRef CAS PubMed.
  41. L. Deng, L. Liu, C. Zhu, D. Li and S. Dong, Chem. Commun., 2013, 49, 2503–2505 RSC.
  42. Q. Xue, H. Huang, L. Wang, Z. Chen, M. Wu, Z. Li and D. Pan, Nanoscale, 2013, 5, 12098–12103 RSC.
  43. Z. Qian, J. Ma, X. Shan, L. Shao, J. Zhou, J. Chen and H. Feng, RSC Adv., 2013, 3, 14571–14579 RSC.
  44. J. Luo, L. J. Cote, V. C. Tung, A. T. Tan, P. E. Goins, J. Wu and J. Huang, J. Am. Chem. Soc., 2010, 132, 17667–17669 CrossRef CAS PubMed.
  45. R. Ye, C. Xiang, J. Lin, Z. Peng, K. Huang, Z. Yan, N. P. Cook, E. L. G. Samuel, C.-C. Hwang, G. Ruan, G. Ceriotti, A.-R. Raji, A. A. Marti and J. M. Tour, Nat. Commun., 2013, 4, 2943 Search PubMed.
  46. X. Sun, Z. Liu, K. Welsher, J. T. Robinson, A. Goodwin, S. Zaric and H. Dai, Nano Res., 2008, 1, 203–212 CrossRef CAS PubMed.
  47. F. Jiang, D. Chen, R. Li, Y. Wang, G. Zhang, S. Li, J. Zheng, N. Huang, Y. Gu, C. Wang and C. Shu, Nanoscale, 2013, 5, 1137–1142 RSC.
  48. X. Xu, R. Ray, Y. Gu, H. J. Ploehn, L. Gearheart, K. Raker and W. A. Scrivens, J. Am. Chem. Soc., 2004, 126, 12736–12737 CrossRef CAS PubMed.
  49. S. N. Baker and G. A. Baker, Angew. Chem., Int. Ed., 2010, 49, 6726–6744 CrossRef CAS PubMed.
  50. H. Li, Z. Kang, Y. Liu and S.-T. Lee, J. Mater. Chem., 2012, 22, 24230–24253 RSC.
  51. J. C. G. E. da Silva and H. M. R. Gonçalves, TrAC, Trends Anal. Chem., 2011, 30, 1327–1336 CrossRef PubMed.
  52. P. G. Luo, S. Sahu, S.-T. Yang, S. K. Sonkar, J. Wang, H. Wang, G. E. LeCroy, L. Cao and Y.-P. Sun, J. Mater. Chem. B, 2013, 1, 2116–2127 RSC.
  53. Y. Dong, R. Wang, G. Li, C. Chen, Y. Chi and G. Chen, Anal. Chem., 2012, 84, 6220–6224 CrossRef CAS PubMed.
  54. Y. Q. Dong, N. N. Zhou, X. M. Lin, J. P. Lin, Y. W. Chi and G. N. Chen, Chem. Mater., 2010, 22, 5895–5899 CrossRef CAS.
  55. H. Li, X. He, Z. Kang, H. Huang, Y. Liu, J. Liu, S. Lian, C. H. Tsang, X. Yang and S. T. Lee, Angew. Chem., Int. Ed., 2010, 49, 4430–4434 CrossRef CAS PubMed.
  56. X. Li, H. Wang, Y. Shimizu, A. Pyatenko, K. Kawaguchi and N. Koshizaki, Chem. Commun., 2011, 47, 932–934 RSC.
  57. H. C. Zhang, H. Huang, H. Ming, H. T. Li, L. L. Zhang, Y. Liu and Z. H. Kang, J. Mater. Chem., 2012, 22, 10501–10506 RSC.
  58. R. Liu, D. Wu, S. Liu, K. Koynov, W. Knoll and Q. Li, Angew. Chem., Int. Ed., 2009, 48, 4598–4601 CrossRef CAS PubMed.
  59. S. C. Ray, A. Saha, N. R. Jana and R. Sarkar, J. Phys. Chem. C, 2009, 113, 18546–18551 CAS.
  60. Z.-A. Qiao, Y. Wang, Y. Gao, H. Li, T. Dai, Y. Liu and Q. Huo, Chem. Commun., 2010, 46, 8812–8814 RSC.
  61. Y. E. L. Bai, L. Fan, M. Han, X. Zhang and S. Yang, J. Mater. Chem., 2011, 21, 819–823 RSC.
  62. F. Wang, Z. Xie, H. Zhang, C.-y. Liu and Y.-g. Zhang, Adv. Funct. Mater., 2011, 21, 1027–1031 CrossRef CAS.
  63. J. J. Zhou, Z. H. Sheng, H. Y. Han, M. Q. Zou and C. X. Li, Mater. Lett., 2012, 66, 222–224 CrossRef CAS PubMed.
  64. Z.-C. Yang, M. Wang, A. M. Yong, S. Y. Wong, X.-H. Zhang, H. Tan, A. Y. Chang, X. Li and J. Wang, Chem. Commun., 2011, 47, 11615–11617 RSC.
  65. S. Chandra, S. Mitra, D. Laha, S. Bag, P. Das, A. Goswami and P. Pramanik, Chem. Commun., 2011, 47, 8587–8589 RSC.
  66. C. Liu, P. Zhang, X. Zhai, F. Tian, W. Li, J. Yang, Y. Liu, H. Wang, W. Wang and W. Liu, Biomaterials, 2012, 33, 3604–3613 CrossRef CAS PubMed.
  67. P.-C. Hsu and H.-T. Chang, Chem. Commun., 2012, 48, 3984–3986 RSC.
  68. Y. Song, W. Shi, W. Chen, X. Li and H. Ma, J. Mater. Chem., 2012, 22, 12568–12573 RSC.
  69. C.-W. Lai, Y.-H. Hsiao, Y.-K. Peng and P.-T. Chou, J. Mater. Chem., 2012, 22, 14403–14409 RSC.
  70. X. Zhai, P. Zhang, C. Liu, T. Bai, W. Li, L. Dai and W. Liu, Chem. Commun., 2012, 48, 7955–7957 RSC.
  71. Z. Zhang, J. Hao, J. Zhang, B. Zhang and J. Tang, RSC Adv., 2012, 2, 8599–8601 RSC.
  72. B. Chen, F. Li, S. Li, W. Weng, H. Guo, T. Guo, X. Zhang, Y. Chen, T. Huang, X. Hong, S. You, Y. Lin, K. Zeng and S. Chen, Nanoscale, 2013, 5, 1967–1971 RSC.
  73. S. Zhu, Q. Meng, L. Wang, J. Zhang, Y. Song, H. Jin, K. Zhang, H. Sun, H. Wang and B. Yang, Angew. Chem., Int. Ed., 2013, 52, 3953–3957 CrossRef CAS PubMed.
  74. S. K. Bhunia, A. Saha, A. R. Maity, S. C. Ray and N. R. Jana, Sci. Rep., 2013, 3, 1473 CAS.
  75. S. Sahu, B. Behera, T. K. Maiti and S. Mohapatra, Chem. Commun., 2012, 48, 8835–8837 RSC.
  76. D. Sun, R. Ban, P. H. Zhang, G. H. Wu, J. R. Zhang and J. J. Zhu, Carbon, 2013, 64, 424–434 CrossRef CAS PubMed.
  77. W. Wang, Y. Li, L. Cheng, Z. Cao and W. Liu, J. Mater. Chem. B, 2014, 2, 46–48 RSC.
  78. H. Huang, Y. Xu, C.-J. Tang, J.-R. Chen, A.-J. Wang and J.-J. Feng, New J. Chem., 2014, 38, 784–789 RSC.
  79. Q. Li, T. Y. Ohulchanskyy, R. Liu, K. Koynov, D. Wu, A. Best, R. Kumar, A. Bonoiu and P. N. Prasad, J. Phys. Chem. C, 2010, 114, 12062–12068 CAS.
  80. J. Jiang, Y. He, S. Li and H. Cui, Chem. Commun., 2012, 48, 9634–9636 RSC.
  81. X. Jia, J. Li and E. Wang, Nanoscale, 2012, 4, 5572–5575 RSC.
  82. S. F. Chin, S. N. A. M. Yazid, S. C. Pang and S. M. Ng, Mater. Lett., 2012, 85, 50–52 CrossRef CAS PubMed.
  83. L. Zhou, B. He and J. Huang, Chem. Commun., 2013, 49, 8078–8080 RSC.
  84. X. Wang, K. Qu, B. Xu, J. Ren and X. Qu, J. Mater. Chem., 2011, 21, 2445–2450 RSC.
  85. B. De and N. Karak, RSC Adv., 2013, 3, 8286–8290 RSC.
  86. H. Huang, J. J. Lv, D. L. Zhou, N. Bao, Y. Xu, A. J. Wang and J. J. Feng, RSC Adv., 2013, 3, 21691–21696 RSC.
  87. W. Lu, X. Qin, S. Liu, G. Chang, Y. Zhang, Y. Luo, A. M. Asiri, A. O. Al-Youbi and X. Sun, Anal. Chem., 2012, 84, 5351–5357 CrossRef CAS PubMed.
  88. B. Yin, J. Deng, X. Peng, Q. Long, J. Zhao, Q. Lu, Q. Chen, H. Li, H. Tang, Y. Zhang and S. Yao, Analyst, 2013, 138, 6551–6557 RSC.
  89. C. Zhu, J. Zhai and S. Dong, Chem. Commun., 2012, 48, 9367–9369 RSC.
  90. L. Wu, M. Luderer, X. Yang, C. Swain, H. Zhang, K. Nelson, A. J. Stacy, B. Shen, G. M. Lanza and D. Pan, Theranostics, 2013, 3, 677–686 CrossRef CAS PubMed.
  91. M. J. Krysmann, A. Kelarakis and E. P. Giannelis, Green Chem., 2012, 14, 3141–3145 RSC.
  92. X. Qin, W. Lu, A. M. Asiri, A. O. Al-Youbi and X. Sun, Catal. Sci. Technol., 2013, 3, 1027–1035 CAS.
  93. L. L. Zhu, Y. J. Yin, C. F. Wang and S. Chen, J. Mater. Chem. C, 2013, 1, 4925–4932 RSC.
  94. S. S. Wee, Y. H. Ng and S. M. Ng, Talanta, 2013, 116, 71–76 CrossRef CAS PubMed.
  95. W. Li, Z. Zhang, B. Kong, S. Feng, J. Wang, L. Wang, J. Yang, F. Zhang, P. Wu and D. Zhao, Angew. Chem., Int. Ed., 2013, 52, 8151–8155 CrossRef CAS PubMed.
  96. Z. L. Wu, P. Zhang, M. X. Gao, C. F. Liu, W. Wang, F. Leng and C. Z. Huang, J. Mater. Chem. B, 2013, 1, 2868–2873 RSC.
  97. J. Wang, S. Sahu, S. K. Sonkar, K. N. Tackett Ii, K. W. Sun, Y. Liu, H. Maimaiti, P. Anilkumar and Y.-P. Sun, RSC Adv., 2013, 3, 15604–15607 RSC.
  98. J. Wang, C. F. Wang and S. Chen, Angew. Chem., Int. Ed., 2012, 51, 9297–9301 CrossRef CAS PubMed.
  99. Q. Wang, X. Liu, L. Zhang and Y. Lv, Analyst, 2012, 137, 5392–5397 RSC.
  100. J. Shang, L. Ma, J. Li, W. Ai, T. Yu and G. G. Gurzadyan, Sci. Rep., 2012, 2, 792 Search PubMed.
  101. H. Liu, T. Ye and C. Mao, Angew. Chem., Int. Ed., 2007, 46, 6473–6475 CrossRef CAS PubMed.
  102. S.-T. Yang, L. Cao, P. G. Luo, F. Lu, X. Wang, H. Wang, M. J. Meziani, Y. Liu, G. Qi and Y.-P. Sun, J. Am. Chem. Soc., 2009, 131, 11308–11309 CrossRef CAS PubMed.
  103. S.-T. Yang, X. Wang, H. Wang, F. Lu, P. G. Luo, L. Cao, M. J. Meziani, J.-H. Liu, Y. Liu, M. Chen, Y. Huang and Y.-P. Sun, J. Phys. Chem. C, 2009, 113, 18110–18114 CAS.
  104. P. Anilkumar, X. Wang, L. Cao, S. Sahu, J.-H. Liu, P. Wang, K. Korch, K. N. Tackett II, A. Parenzan and Y.-P. Sun, Nanoscale, 2011, 3, 2023–2027 RSC.
  105. X. Zhang, H. Huang, J. Liu, Y. Liu and Z. Kang, J. Mater. Chem. A, 2013, 1, 11529–11533 CAS.
  106. H. Ming, Z. Ma, Y. Liu, K. Pan, H. Yu, F. Wang and Z. Kang, Dalton Trans., 2012, 41, 9526–9531 RSC.
  107. L. Cao, X. Wang, M. J. Meziani, F. Lu, H. Wang, P. G. Luo, Y. Lin, B. A. Harruff, L. M. Veca, D. Murrat, S.-Y. Xie and Y.-P. Sun, J. Am. Chem. Soc., 2007, 129, 11318–11319 CrossRef CAS PubMed.
  108. H. Tao, K. Yang, Z. Ma, J. Wan, Y. Zhang, Z. Kang and Z. Liu, Small, 2012, 8, 281–290 CrossRef CAS PubMed.
  109. Q.-Q. Shi, Y.-H. Li, Y. Xu, Y. Wang, X.-B. Yin, X.-W. He and Y.-K. Zhang, RSC Adv., 2014, 4, 1563–1566 RSC.
  110. X. Huang, F. Zhang, L. Zhu, K. Y. Choi, N. Guo, J. Guo, K. Tackett, P. Anilkumar, G. Liu, Q. Quan, H. S. Choi, G. Niu, Y. P. Sun, S. Lee and X. Chen, ACS Nano, 2013, 7, 5684–5693 CrossRef CAS PubMed.
  111. S. Chandra, P. Das, S. Bag, D. Laha and P. Pramanik, Nanoscale, 2011, 3, 1533–1540 RSC.
  112. P. Anilkumar, L. Cao, J.-J. Yu, K. N. Tackett II, P. Wang, M. J. Meziani and Y.-P. Sun, Small, 2013, 9, 545–551 CrossRef CAS PubMed.
  113. E. J. Goh, K. S. Kim, Y. R. Kim, H. S. Jung, S. Beack, W. H. Kong, G. Scarcelli, S. H. Yun and S. K. Hahn, Biomacromolecules, 2012, 13, 2554–2561 CrossRef CAS PubMed.
  114. B. Kong, A. Zhu, C. Ding, X. Zhao, B. Li and Y. Tian, Adv. Mater., 2012, 24, 5844–5848 CrossRef CAS PubMed.
  115. A. Zhu, Q. Qu, X. Shao, B. Kong and Y. Tian, Angew. Chem., Int. Ed., 2012, 51, 7185–7189 CrossRef CAS PubMed.
  116. A. Zhu, C. Ding and Y. Tian, Sci. Rep., 2013, 3, 2933 Search PubMed.
  117. J. Jeong, M. Cho, Y. T. Lim, N. W. Song and B. H. Chung, Angew. Chem., Int. Ed., 2009, 48, 5296–5299 CrossRef CAS PubMed.
  118. J. Tang, B. Kong, H. Wu, M. Xu, Y. Wang, Y. Wang, D. Zhao and G. Zheng, Adv. Mater., 2013, 25, 6569–6574 CrossRef CAS PubMed.
  119. T. Lai, E. Zheng, L. Chen, X. Wang, L. Kong, C. You, Y. Ruan and X. Weng, Nanoscale, 2013, 5, 8015–8021 RSC.
  120. Y. L. Zhang, L. Wang, H. C. Zhang, Y. Liu, H. Y. Wang, Z. H. Kang and S. T. Lee, RSC Adv., 2013, 3, 3733–3738 RSC.
  121. S. Qu, H. Chen, X. Zheng, J. Cao and X. Liu, Nanoscale, 2013, 5, 5514–5518 RSC.
  122. X. She, H. Xu, Y. Xu, J. Yan, J. Xia, L. Xu, Y. Song, Y. Jiang, Q. Zhang and H. Li, J. Mater. Chem. A, 2014, 2, 2563 CAS.
  123. S. Liu, J. Tian, L. Wang, Y. Zhang, X. Qin, Y. Luo, A. M. Asiri, A. O. Al-Youbi and X. Sun, Adv. Mater., 2012, 24, 2037–2041 CrossRef CAS PubMed.
  124. H. M. Goncalves, A. J. Duarte and J. C. Esteves da Silva, Biosens. Bioelectron., 2010, 26, 1302–1306 CrossRef CAS PubMed.
  125. Z. Lin, W. Xue, H. Chen and J. M. Lin, Anal. Chem., 2011, 83, 8245–8251 CrossRef CAS PubMed.
  126. J. Liu, J. Li, Y. Jiang, S. Yang, W. Tan and R. Yang, Chem. Commun., 2011, 47, 11321–11323 RSC.
  127. C. Wu, S. J. Hansen, Q. Hou, J. Yu, M. Zeigler, Y. Jin, D. R. Burnham, J. D. McNeill, J. M. Olson and D. T. Chiu, Angew. Chem., Int. Ed., 2011, 50, 3430–3434 CrossRef CAS PubMed.
  128. C. Wu, T. Schneider, M. Zeigler, J. Yu, P. G. Schiro, D. R. Bumham, J. D. McNeill and D. T. Chiu, J. Am. Chem. Soc., 2010, 132, 15410–15417 CrossRef CAS PubMed.
  129. Y. Yang, J. Cui, M. Zheng, C. Hu, S. Tan, Y. Xiao, Q. Yang and Y. Liu, Chem. Commun., 2012, 48, 380–382 RSC.
  130. S. Zhu, J. Zhang, L. Wang, Y. Song, G. Zhang, H. Wang and B. Yang, Chem. Commun., 2012, 48, 10889–10891 RSC.
  131. J. Gu, W. Wang, Q. Zhang, Z. Meng, X. Jia and K. Xi, RSC Adv., 2013, 3, 15589–15591 RSC.
  132. C. X. Guo, J. Xie, B. Wang, X. Zheng, H. B. Yang and C. M. Li, Sci. Rep., 2013, 3, 2957 Search PubMed.
  133. Y. Sun, W. Cao, S. Li, S. Jin, K. Hu, L. Hu, Y. Huang, X. Gao, Y. Wu and X.-J. Liang, Sci. Rep., 2013, 3, 3036 Search PubMed.
  134. L. Hu, Y. Sun, S. Li, X. Wang, K. Hu, L. Wang, X.-j. Liang and Y. Wu, Carbon, 2014, 67, 508–513 CrossRef CAS PubMed.
  135. A. Sachdev, I. Matai, S. U. Kumar, B. Bhushan, P. Dubey and P. Gopinath, RSC Adv., 2013, 3, 16958–16961 RSC.
  136. S. Zhu, J. Zhang, Y. Song, G. Zhang, H. Zhang and B. Yang, Acta Chim. Sin., 2012, 70, 2311–2315 CAS.
  137. X. Zhang, X. Xie, H. Wang, J. Zhang, B. Pan and Y. Xie, J. Am. Chem. Soc., 2013, 135, 18–21 CrossRef CAS PubMed.
  138. N. Mohan, C.-S. Chen, H.-H. Hsieh, Y.-C. Wu and H.-C. Chang, Nano Lett., 2010, 10, 3692–3699 CrossRef CAS PubMed.
  139. H. Gonçalves, P. A. S. Jorge, J. R. A. Fernandes and J. C. G. Esteves da Silva, Sens. Actuators, B, 2010, 145, 702–707 CrossRef PubMed.

This journal is © The Royal Society of Chemistry 2014