A star polymer based on a polyethylene glycol with a porphyrinic core as a photosensitizing agent for application in photodynamic therapy: tests in vitro on human erythrocytes
Placido Mineo†
*ab,
Caterina Faggio†*c,
Norberto Micalib,
Emilio Scamporrinoa and
Valentina Villari†*b
aDipartimento di Scienze Chimiche and I.N.S.T.M. UdR of Catania, Università di Catania, Viale Andrea, Doria 6, I-95125 Catania, Italy. E-mail: gmineo@unict.it
bCNR-IPCF Istituto per i Processi Chimico-Fisici, Viale F. Stagno d'Alcontres 37, I-98158, Messina, Italy. E-mail: villari@me.cnr.it
cDepartment of Biological and Environmental Sciences, University of Messina, Viale Ferdinando Stagno d'Alcontres, 31 98166 S.Agata-Messina, Italy. E-mail: cfaggio@unime.it
First published on 5th March 2014
Abstract
In this study, human erythrocytes were used to assess the cytotoxicity of an uncharged, water-soluble and bio-compatible porphyrin system [the 5,10,15,20-tetrakis-p-(ω-methoxypolyethyleneoxyphenyl)porphyrin, H2–P], which has the potential to act as a photosensitizing agent in photodynamic therapy (PDT). By investigating the cytotoxicity effects under controlled conditions, at different porphyrin concentrations and upon increasing irradiation times, the data in the absence and in the presence of H2–P were compared. It was shown that the H2–P system, without the assistance of any additional carrier, is easily internalized into cells, unlike the process which occurs for charged porphyrins. Incubation of red blood cells with H2–P resulted in non-cytotoxicity in control conditions but, under irradiation, the cytotoxicity increased significantly at 20 μM of porphyrin; it further increased at 40 μM, reaching total cell death at 80 μM. These results suggest that, as already observed for other cellular species, PDT-mediated oxidative stress occurs.
Introduction
The discovery of new strategies in the fight against cancer is one of the most urgent objectives in scientific research. Generally, the approach to contend with this disease is surgery, often combined with chemo- and/or radiation therapies. These are all drastic treatments that lead to serious biological and bioorganic damage with severe reduction of the quality of the patient's life. In particular, the major drawback of cancer chemotherapy is the development of multidrug-resistant tumor cells, so alternative therapies are highly desirable. With this purpose, in the last few years, treatments involving the use of suitable photo-sensitizers able to generate, by means of light irradiation, singlet oxygen (a formidable cytotoxic agent for the destruction of neoplastic cells) have been investigated.1 This methodology, called photodynamic therapy (PDT), is less invasive, more selective and, applied locally, can be used for other different clinical treatments, like in the ophthalmic, cardiovascular and dermatological fields.PDT potentially allows for selective treatment of the malignant tissue if only the photo-sensitizer, which has low toxicity without irradiation, is accumulated there. As such, the right choice of sensitizing agent and light source are very important.
The search is very complex, since different cell types, different photosensitizers and different incubation and illumination conditions can all considerably alter the outcome of the photodynamic treatment. However, the most commonly used strategies aim to improve the therapeutic index, reducing the toxicities of the treatments. Porphyrins, phthalocyanines and 5-aminolevulinic acid-induced protoporphyrin IX are some of the most studied tetrapyrrole-based photosensitizers,2,3 despite their poor water solubility and/or their tendency to form aggregates.
Further problems, due to the interaction of the charged groups with the membranes, can affect the internalization efficiency of the sensitizer, which is indispensable for an efficient PDT treatment. In some cases, the molecular mobility has been improved by inserting the sensitizer agent into specific carriers4,5 (such as cyclodextrins, liposomes, etc.), but the large amount of the required molecular carrier system could induce chronic and/or acute toxicity phenomena.
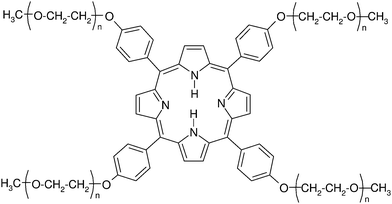
In an attempt to overcome these problems, we have recently synthesized some uncharged, water soluble, mono- and oligo-porphyrin systems, and studied their properties in the bio-molecular recognition field.6–10 In some cases, induced circular dichroism and fluorescence spectroscopy data showed that an uncharged cobalt–porphyrin has the ability to recognize specific amino acids and globular proteins in aqueous solution at micromolar concentrations. In particular, the formation of the supramolecular complexes without disruption of the native structure of the proteins was also observed.6 The 5,10,15,20-tetrakis-p-(ω-methoxypolyethyleneoxyphenyl)porphyrin (H2–P), constituting a porphyrinic core (the photosensitizer agent) with four bio-compatible polyethylene glycol branches (the water soluble agent, see Scheme 1) symmetrically bound to the peripheral porphyrin positions, was adopted in the present study. Besides making the porphyrin water-soluble, the polyethylene glycol branches, thanks to their hydrophilic/hydrophobic balance, also contribute to its ability to migrate into the cellular structures.
In order to confirm the potential application of H2–P as a photosensitizer in PDT, it was also necessary to assess its permeation through cell membranes. For this purpose, mammalian erythrocytes were considered a convenient and versatile model of cells for the exploration of the physiological and molecular mechanisms involved in PDT.11 All blood-perfused tissues contain red blood cells (RBC), which are mainly composed of hemoglobin and water, enclosed by a membrane. In mammals, nuclei and other cellular organelles such as mitochondria, Golgi apparatus and endoplasmic reticula are absent in erythrocytes. Thus, as they do not have internal membrane structures, they provided a good choice for optical measurements.
For this reason, the photodynamic behavior of H2–P was evaluated in vitro using human erythrocytes, comparing the collected results with those already reported in the literature.12 The final goal was to demonstrate that H2–P permeates into erythrocytes without the use of an additional carrier, whilst maintaining its photochemical properties, to induce the death of the erythrocytes by light treatment.
Materials and methods
1H-NMR analyses
1H-NMR and 13C-NMR spectra were obtained on a UNITYINOVA Varian instrument operating at 500 MHz (1H) using VNMR for software acquisition and processing. Samples were dissolved in CD2Cl2 and the chemical shifts were expressed in ppm by comparison with the CH2Cl2 residue signal. The spectra were acquired at 27 °C, with a spin lock time of 0.5 s.MALDI-TOF mass spectrometric analysis
Positive MALDI-TOF (Matrix Assisted Laser Desorption/Ionization Time-Of-Flight) mass spectra were acquired by a Voyager DE-STR (PerSeptiveBiosystem) instrument using a simultaneous delay extraction procedure (25 kV applied after 2600 ns with a potential gradient of 454 V mm−1 and a wire voltage of 25 V) and detection in linear mode.13,14 The instrument was equipped with a nitrogen laser (emission at 337 nm for 3 ns) and a flash Analog-to-Digital converter (time base 2 ns). trans-3-Indoleacrylic acid (IAA) was used as a matrix. Mass spectrometer calibration and average molecular mass determination were performed as reported in previous cases.15–17 Each m/z value reported in the spectra and in the text refers to the ion containing the most abundant isotope of each element present in the molecule.UV-vis measurements
UV-visible spectra were recorded on a Shimadzu UV-1601 spectrophotometer at 25 ± 0.1 °C, using quartz cuvettes with a 1 cm path length and water (LC-mass grade) as the solvent.Steady-state fluorescence measurements
Fluorescence emission spectra were measured by a Varian Cary Eclipse Fluorescence spectrophotometer at 25 ± 0.1 °C using cuvettes with a 1 cm path length (the resolution was set at 2.5 nm).Irradiation protocol
For the irradiation experiments, a Q/switch laser was used (λ = 532 nm) with a repetition rate of 5 Hz, pulse duration of 8 ns and energy of 0.8 mJ per pulse. The irradiated volume was 1 cm3.The erythrocyte solutions were irradiated both in the absence and in the presence of H2–P at different concentrations and for different exposure times (0, 1, 2, 3, 5 and 10 minutes). The cytotoxicity assay was performed immediately after each irradiation process.
Synthesis of poly(ethylene glycol)methyl ether chloride (PEGMEC)
A commercial poly(ethylene glycol)methyl ether sample (PEGME, Mn = 750 Da, MWD = 1.02, from Sigma Chemical Company), constituted of a mixture of linear oligomers with a narrow mass distribution (about 1.01) and a methoxyl and a hydroxyl as the end groups, was transformed into the corresponding chlorinated derivative (PEGMEC) by reaction with thionyl chloride. In particular, 1.19 g (10 mmol) of thionyl chloride was added to 5 g (6.67 mmol) of PEGME and 0.79 g (10 mmol) of pyridine, dissolved in 100 mL of THF, under stirring at room temperature.18 After 24 hours, the solution was refluxed for 1 h and treated with active carbon; the clear solution was evaporated to dryness and then dried under vacuum.Synthesis of tetrakis-(p-hydroxyphenyl)porphyrin
This product was prepared according to the method described by Little et al.,19 starting from pyrrole and p-acetoxybenzaldheyde in boiling propionic acid.Synthesis of 5,10,15,20-tetrakis-p-(ω-methoxypolyethyleneoxyphenyl)porphyrin (H2–P)
H2–P (Scheme 1), which has an average molecular mass of 3600 Da with a narrow polydispersity (Mw/Mn = 1.02), was prepared by reaction between tetrakis-(p-hydroxyphenyl)porphyrin and PEGMEC.18Briefly, to 1.07 g of PEGMEC (about 1.43 mmol), dissolved in 6 mL of a H2O–THF (1![[thin space (1/6-em)]](https://www.rsc.org/images/entities/char_2009.gif) :
:![[thin space (1/6-em)]](https://www.rsc.org/images/entities/char_2009.gif) 1) mixture, 0.12 g of tetrakis-(p-hydroxyphenyl)porphyrin (0.177 mmol), dissolved in 1.42 mL of a 0.5 M NaOH aqueous solution was added and the mixture refluxed for 24 h. Then, 1.42 mL of 0.5 M NaOH and 1.5 mL of THF were added and the solution was refluxed for another 24 h. Then the reaction was stopped by the addition of CH3COOH, and dried under vacuum. The residue, dissolved in CHCl3, was fractionated by column chromatography using silica gel as a stationary phase and a solution of CHCl3–C2H5OH–N(C2H5)3 (96.5
1) mixture, 0.12 g of tetrakis-(p-hydroxyphenyl)porphyrin (0.177 mmol), dissolved in 1.42 mL of a 0.5 M NaOH aqueous solution was added and the mixture refluxed for 24 h. Then, 1.42 mL of 0.5 M NaOH and 1.5 mL of THF were added and the solution was refluxed for another 24 h. Then the reaction was stopped by the addition of CH3COOH, and dried under vacuum. The residue, dissolved in CHCl3, was fractionated by column chromatography using silica gel as a stationary phase and a solution of CHCl3–C2H5OH–N(C2H5)3 (96.5![[thin space (1/6-em)]](https://www.rsc.org/images/entities/char_2009.gif) :
:![[thin space (1/6-em)]](https://www.rsc.org/images/entities/char_2009.gif) 2.0
2.0![[thin space (1/6-em)]](https://www.rsc.org/images/entities/char_2009.gif) :
:![[thin space (1/6-em)]](https://www.rsc.org/images/entities/char_2009.gif) 1.5) as an eluent. As indicated by MALDI-TOF analysis, H2–P was the first compound to elute from the column, with a yield of about 30% with respect to the initial porphyrin amount.
1.5) as an eluent. As indicated by MALDI-TOF analysis, H2–P was the first compound to elute from the column, with a yield of about 30% with respect to the initial porphyrin amount.
Cytotoxicity assay
Fresh human blood was collected from healthy adult donors. After extraction, the whole blood was taken into anticoagulant EDTA (Ethylenediaminetetraacetic acid), centrifuged (3000 rpm for 5 min) to remove the plasma and the leukocyte layer, washed three times with a saline solution [composition in mM: 125 NaCl, 5 KCl, 1 MgSO4, 32 4-(2-hydroxyethyl)-1-piperazineethanesulfonic acid (HEPES), 5 D-(+)-glucose, 1 CaCl2; pH 7.4] and centrifuged again. Erythrocytes were re-suspended in saline solution with the H2–P porphyrin at concentrations of 0 μM (control sample), 20 μM, 40 μM and 80 μM. After the irradiation experiments, a cell viability assay was performed using a trypan blue exclusion method. The percentage of unstained cells represented the percentage of viable cells in the suspension. This assay was performed in different cell types and measures the cytotoxicity based on alterations in the plasma membrane permeability.20Statistical analysis
The experiments were performed in triplicate, and statistical analyses were performed using the Student's t-test, with a confidence level of 95% (p < 0.05) considered statistically significant.Fluorescence microscopy measurements
An erythrocyte solution was incubated for 12 hours with H2–P at a concentration of 20 μM. A droplet of this solution was put on a glass slide pre-treated with polylysine. The non-internalized H2–P, which remained in the solution, was removed by washing the slide repeatedly with the isotonic buffer. Fluorescence microscopy measurements were performed using an inverted Zeiss microscope (Axiovert S100) equipped with a cooled DVC camera and a 100× in-oil objective (with a numerical aperture of 1.4). The glass slide was thermostated using a Peltier-based home-made thermostat to control the temperature at 37 ± 0.5 °C. In order to measure the fluorescence spectra inside the cells, an optical fiber, positioned on the image plane equivalent to that of the camera, captured a defined portion of the image (4 μm sized) in which a cell was contained.21 The fluorescence spectra were measured using a diode array spectrometer (Ocean Optics model S2000) as the detecting device. The absence of fluorescence from the erythrocyte solution without H2–P was also checked.Singlet-oxygen assay
The amount of 1O2 produced was determined by a standard method based on the bleaching reaction of p-nitroso-N,N′dimethylaniline (RNO).22The sensitizer H2–P was dissolved, with imidazole (10 mM) and RNO (50 μM), in buffered solution. In a typical experiment, 1 mL of the reaction mixture was poured into a quartz cuvette (Hellma) with a 1 cm path length, and exposed to the laser beam under the same conditions as described in the irradiation protocol for erythrocyte solutions (Q/switch laser λ = 532 nm; repetition rate = 5 Hz; pulse duration = 8 ns; energy = 0.8 mJ per pulse). To avoid shielding effects, the optical density at the excitation wavelength was about 0.1.
The RNO absorbance at λ = 440 nm was plotted as a function of the irradiation time and the slope ΔAH2P was compared to that obtained for the solution of TPPS (5,10,15,20-tetrakis(4-sulfonatophenyl)porphyrin) used as standard reference, ΔATPPS, at the same concentration in phosphate buffer (50 mM). The 1O2 quantum yield of H2–P was then calculated according to the following relationship:23
 | (1) |
Results
Characterization of 5,10,15,20-tetrakis-p-(ω-methoxypolyethyleneoxyphenyl)porphyrin
The 5,10,15,20-tetrakis-p-(ω-methoxypolyethyleneoxyphenyl)porphyrin (H2–P, see Scheme 1), used in this work as a sensitizer, was suitably characterized before the in vitro experiments were carried out.The chemical structure of H2–P was characterized by MALDI-TOF and NMR measurements. The MALDI-TOF spectrum of H2–P (see Fig. 1) consists of essentially two families of peaks, both due to the cationization of the H2–P species by H+ [m/z (2802 + n44) + 1, •] and Na+ [m/z (2802 + n44) + 23, #].
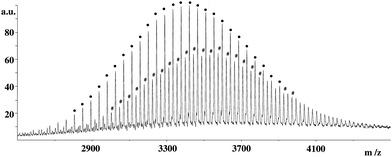 | ||
| Fig. 1 MALDI-TOF mass spectrum of H2–P, consisting of two families of peaks due to the cationization of species by H+ [m/z (2802 + n44) + 1, •] and Na+ [m/z (2802 + n44) + 23, #]. | ||
The structure of H2–P was also confirmed by NMR analysis. The assignment of the 1H- and 13C-NMR signals (spectra not reported for brevity) were as follows.
1H-NMR (500 MHz, CD2Cl2, 27 °C): a singlet at 8.92 ppm (8H, C–H pyrrole protons); two doublets at 8.15, 8.11 ppm (8H, C–H phenyl protons in the γ position with respect to the phenolic oxygen) and at 7.35, 7.30 ppm (8H, C–H phenyl protons in the β position with respect to the phenolic oxygen); a singlet at −2.80 ppm (2H, N–H pyrrole protons). The signals obtained for the PEG arms of the porphyrin were: two triplets centered at 4.42 and 4.02 ppm (16H, CH2 groups in the α and β positions, respectively, with respect to the phenolic oxygen), an unresolved multiplet between 3.85 and 3.43 ppm (about 230H, the remaining methylene groups of the PEG); and a few singlets between 3.33 and 3.30 ppm (12H, the CH3 terminal groups of the branches).
13C-NMR (125 MHz, CD2Cl2): signals at 159.12, 134.97 and 120.17 ppm (quaternary carbons), 135.97 and 113.19 ppm (phenyl tertiary carbons in the γ and β positions, respectively, with respect to the phenolic oxygen), 131.37 ppm (broad signal for pyrrole tertiary carbons), 72.1–68.1 ppm (a few peaks observed due to PEG secondary carbons) and 68.20 ppm (terminal PEG methyl groups). It can be observed that the signal corresponding to the fourth quaternary carbon, generally present at about 146.6 ppm,24 was absent in this case, probably because of a longer relaxation time of this carbon atom with respect to the other ones. In fact, the signals of these quaternary carbons appeared in the 13C-NMR spectra when analyses were carried out at 80 °C, on dissolving the sample in deuterated DMF. As expected, the broad peak due to the pyrrole tertiary carbons at 131.52 ppm (a little shifted with respect to the previous value because of the different solvent and temperature) also became sharper, due to the shorter relaxation times of the aromatic carbons at this temperature.
The spectroscopic properties of H2–P were evaluated by means of UV-vis and fluorescence spectroscopies.
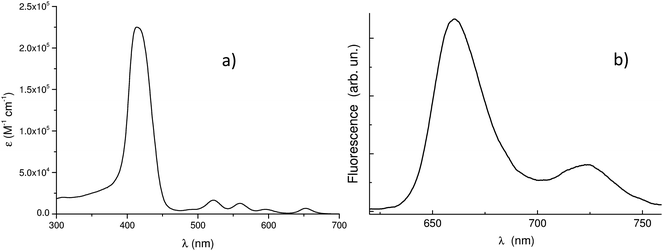
The UV-vis spectrum shows a Soret band at 421.7 nm and four satellite Q-bands at 521.1, 559.8, 599.5, and 652.5 nm (Fig. 2a); the molar extinction coefficient (ε) was 2.25 × 10⁵ M−1 cm−1.
The fluorescence spectrum in Fig. 2b shows a maximum emission at 660 nm (λexc. = 532 nm). The fluorescence decay (at 660 nm) shows a mono-exponential behavior with a lifetime value of about 9 ns (data not shown).
Cytotoxicity assay
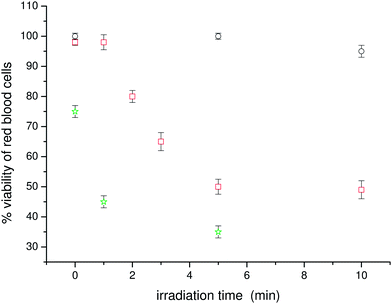
The trypan blue assay showed a cell-viability of about 100% in controlled conditions and the absence of H2–P; under irradiation, a low cytotoxicity in RBC was observed after 10 min of irradiation (see Fig. 3). In contrast, when cells incubated with H2–P (at a porphyrin concentration of 20 μM) were irradiated, the cell-viability dramatically decreased after about two minutes of irradiation, continuing to change as a function of the exposition time, as shown in Fig. 3. The toxicity effect was significantly stronger at the H2–P concentration of 40 μM, whereas at 80 μM, the whole cellular population died.Fluorescence microscopy measurements
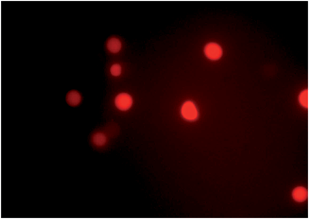
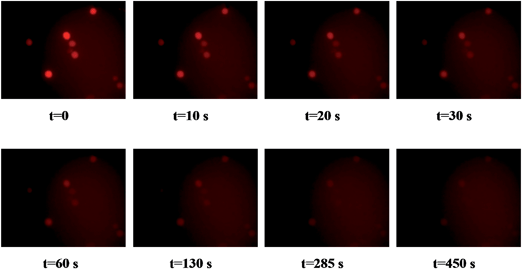
Fig. 4 shows a typical fluorescence image collected from the erythrocytes incubated with H2–P. It clearly highlights the internalization of H2–P into the cells.In order to prove that the detected fluorescence was due to the emission from H2–P, spectra were collected inside and outside erythrocytes. As can be seen in Fig. 5, the spectra possess emission bands characteristic of the free-base porphyrin at 660 nm and at about 723 nm,25,26 whereas there is no fluorescence emission from erythrocytes in the absence of H2–P. Although it was not possible to completely wash out the non-internalized H2–P (as indicated in Fig. 4 by the residual fluorescence signal observed outside cells), the fluorescence from H2–P inside the cells was significantly stronger.
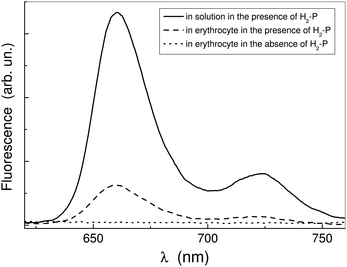 | ||
| Fig. 5 Fluorescence spectra of H2–P: in solution (continuous line) and in erythrocytes (dashed line). The dotted curve refers to erythrocytes in absence of H2–P. | ||
The fluorescence quenching of H2–P inside the erythrocytes after irradiation also provided evidence of the quantitative and qualitative aspects of the phenomenon by comparing the emission spectra with the optical images (see Fig. 6 and 7).
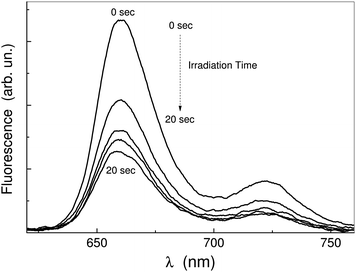 | ||
| Fig. 6 Emission spectra of H2–P collected inside a cell at different irradiation times: t = 0 s, t = 5 s, t = 10 s, t = 15 s and t = 20 s. | ||
Singlet oxygen generation
In order to test H2–P as a potential photosensitizing agent for photodynamic therapy, the 1O2 formation under irradiation was verified. In Fig. 8, the decrease in the RNO optical density at 440 nm is reported as a function of the irradiation time in the presence of either H2–P or TPPS. The singlet oxygen quantum yield was calculated from eqn (1) as 0.33 ± 0.05, using the slopes of the linear fits of the two data sets.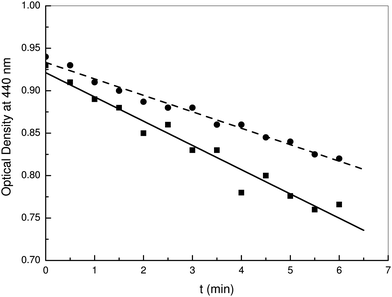 | ||
| Fig. 8 Bleaching rate of RNO in solution as a function of the irradiation time in the presence of TPPS (squares) or H2–P (circles). | ||
Discussion
In the last decade, a number of authors have studied the effects of PDT on various cells.27 Generally, the procedure involves the administration of a photosensitizing agent, followed by irradiation at a wavelength corresponding to an absorbance band of the sensitizer, to provoke its excitation and the production of reactive oxygen species. These highly cytotoxic species rapidly attack any organic compounds they encounter, also leading to the death of the tumor cells, as well as damage to the microvasculature and inducing a local inflammatory reaction. In our study, human erythrocytes were used to assess the cytotoxicity of the H2–P porphyrin at different concentrations, in control conditions and at increasing irradiation times. The data indicated that the mere incubation of red blood cells with H2–P did not cause cytotoxicity, at least at low H2–P concentration. However, when the cells incubated with H2–P were irradiated, the cytotoxicity increased significantly for the sample with 20 μM of sensitizer. A stronger increment was observed for the sample incubated at 40 μM, and total death of the cells resulted in the experiment with 80 μM of H2–P. As such, the quenching of the H2–P upon irradiation can be considered a consequence of the generated singlet oxygen.These results suggest that, as already observed for other cellular species, PDT-mediated oxidative stress by H2–P can evoke the three main cell death pathways: (1) eryptosis (the suicidal death of erythrocytes, which may be a valuable model system for the analysis of mechanisms which are similarly important for the apoptosis of nucleated cells,28,29), (2) necrotic and (3) autophagy associated cell death.28 Although further studies will be necessary to understand the action of H2–P, these preliminary data confirmed that human erythrocytes may serve well as a model cell to study the cellular and molecular mechanisms of a photodynamic treatment.30
In conclusion, our results provide new perspectives for a new approach to the treatment of the blood vessels that grow around the tumor mass (angiogenesis), which are essential to its growth, by using a PDT treatment with H2–P as a photosensitizer. Hence, PDT might provide a universal method for neoplastic cell destruction. Obviously, it will also be necessary to investigate the long-term efficacy of PDT using H2–P in combination with an anti-VEGF (anti-vascular endothelial growth factor) treatment.
Acknowledgements
This work was supported by MIUR-PON 2010, project DIATEME PON01-00074.References
- E. D. Sternberg, D. Dolphin and C. Brükner, Tetrahedron, 1998, 54, 4151–4202 CrossRef CAS.
- M. Ethirajan, Y. Chen, P. Joshi and R. K. Pandey, Chem. Soc. Rev., 2011, 40, 340–362 RSC.
- F. M. Engelmann, I. Mayer, D. S. Gabrielli, H. E. Toma, A. J. Kowaltowski, K. Araki and M. S. Baptista, J. Bioenerg. Biomembr., 2007, 39, 175–185 CrossRef CAS PubMed.
- S. Ferro, G. Jori, S. Sortino, R. Stancanelli, P. Nikolov, G. Tognon, F. Ricchelli and A. Mazzaglia, Biomacromolecules, 2009, 10, 2592–2600 CrossRef CAS PubMed.
- L.-Y. Wang, X.-Y. Shi, C.-S. Yang and D.-M. Huang, Nanoscale, 2013, 5, 416–421 RSC.
- P. Mineo, N. Micali, V. Villari, M. G. Donato and E. Scamporrino, Chem.–Eur. J., 2012, 18, 12452–12457 CrossRef CAS PubMed.
- P. Mineo, F. Spitaleri and E. Scamporrino, J. Polym. Sci., Part A: Polym. Chem., 2013, 51, 1428–1435 CrossRef CAS.
- V. Villari, P. Mineo, N. Micali, N. Angelini, D. Vitalini and E. Scamporrino, Nanotechnology, 2007, 18(37), 375503 CrossRef.
- E. Scamporrino, P. Mineo, S. Dattilo, D. Vitalini and E. Spina, Macromol. Rapid Commun., 2007, 28, 1546–1552 CrossRef CAS.
- N. Angelini, N. Micali, P. Mineo, E. Scamporrino, V. Villari and D. Vitalini, J. Phys. Chem. B, 2005, 109(39), 18645–18651 CrossRef CAS PubMed.
- L. Sikurova, P. Balis and M. Zvarik, J. Photochem. Photobiol., B, 2011, 103(3), 230–233 CrossRef CAS PubMed.
- L. Kaestner, Gen. Physiol. Biophys., 2003, 22(4), 455–465 CAS.
- P. Mineo, E. Scamporrino and D. Vitalini, Rapid Commun. Mass Spectrom., 1999, 13, 2511–2517 CrossRef.
- P. Mineo, E. Scamporrino, D. Vitalini, R. Alicata and S. Bazzano, Rapid Commun. Mass Spectrom., 2005, 19, 2773–2779 CrossRef CAS PubMed.
- G. Montaudo, P. Mineo, E. Scamporrino and D. Vitalini, Rapid Commun. Mass Spectrom., 1999, 10, 1551–1559 CrossRef.
- P. Mineo, E. Scamporrino and D. Vitalini, Macromolecules, 1997, 30, 5285–5289 CrossRef.
- E. Scamporrino, P. Maravigna, D. Vitalini and P. Mineo, Rapid Commun. Mass Spectrom., 1998, 12, 646–650 CrossRef CAS.
- P. Mineo, D. Vitalini and E. Scamporrino, Macromol. Rapid Commun., 2002, 23, 681–687 CrossRef CAS.
- R. G. Little, J. A. Anton, P. A. Loach and J. A. Ibers, J. Heterocycl. Chem., 1975, 12, 343–349 CrossRef CAS.
- P. Bonaccorsi, M. C. Aversa, A. Barattucci, T. Papalia, A. Torre, F. Trischitta and C. Faggio, J. Sulfur Chem., 2013, 34(6), 684–691 CrossRef CAS.
- A. Mazzaglia, M. Trapani, V. Villari, N. Micali, F. Marino Merlo, D. Zaccaria, M. T. Sciortino, F. Previti, S. Patanè and L. Monsù Scolaro, J. Phys. Chem. C, 2008, 112, 6764–6769 CAS.
- J. Mosinger and Z. Micka, J. Photochem. Photobiol., A, 1997, 107, 77–82 CrossRef CAS.
- R. Venkatesan, N. Periasamy and T. S. Srivastava, Proc. Indiana Acad. Sci., 1992, 104, 713–722 CAS.
- P. Mineo, D. Vitalini and E. Scamporrino, Macromolecules, 1999, 32, 60–69 CrossRef.
- N. Angelini, N. Micali, V. Villari, P. Mineo, D. Vitalini and E. Scamporrino, Phys. Rev. E: Stat., Nonlinear, Soft Matter Phys., 2005, 71, 021915–021917 CrossRef CAS; V. Villari, P. Mineo, E. Scamporrino and N. Micali, RSC Adv., 2012, 2, 12989–12998 RSC.
- T. Kushibiki, T. Hirasawa, S. Okawa and M. Ishihara, Journal of Healthcare Engineering, 2013, 4(1), 87–108 CrossRef PubMed.
- F. Lang, K. S. Lang, P. A. Lang, S. M. Huber and T. Wieder, Antioxid. Redox Signaling, 2006, 8(7–8), 1183–1192 CrossRef CAS PubMed.
- F. Lang, E. Lang and M. Föller, Transfus. Med. Hemother., 2012, 39(5), 308–314 CrossRef PubMed.
- P. Agostinis, K. Berg, K. A. Cengel, T. H. Foster, A. W. Girotti, S. O. Gollnick, S. M. Hahn, M. R. Hamblin, A. Juzeniene, D. Kessel, M. Korbelik, J. Moan, P. Mroz, D. Nowis, J. Piette, B. C. Wilson and J. Golab, Ca-Cancer J. Clin., 2011, 61(4), 250–281 CrossRef PubMed.
- L. Kaestner, Bioelectrochemistry, 2004, 62(2), 123–126 CrossRef CAS PubMed.
Footnote |
| † These authors contributed equally to this work. |
| This journal is © The Royal Society of Chemistry 2014 |

