Nitrogen-based alternative fuel: an environmentally friendly combustion approach

Alon Grinberg Danaa, Gennady E. Shterb and Gideon S. Grader*b
aThe Nancy and Stephen Grand Technion Energy Program, Technion – Israel Institute of Technology, Haifa 3200003, Israel. Fax: +972-77-887-5099
bThe Wolfson Department of Chemical Engineering, Technion – Israel Institute of Technology, Haifa 3200003, Israel. E-mail: grader@technion.ac.il; Fax: +972-4-829-5672

Received 22nd December 2013 , Accepted 30th January 2014

First published on 31st January 2014


Abstract

We report here on a continuous combustion of a low carbon nitrogen-based alternative fuel. The investigated fuel, an aqueous solution of urea and ammonium nitrate, consists of common fertilizer commodities. This nonflammable, nontoxic and nonexplosive fuel underwent combustion at a pressure range of 1 to 25 MPa. The pressure was found to greatly affect pollutant levels in the effluent gas. Molecular nitrogen yield was 99.89% at 25 MPa, and the lowest NOx level was 128 mg MJ−1, below the regulation standard for power generation. The alternative fuel described herein is an excellent gas generator, producing an environmentally friendly working fluid consisting of 73.0% H2O, 21.6% N2, and 5.4% CO2. This fuel has the potential to be a sustainable future renewable energy storage medium as well as an energy carrier.

1. Introduction

Large scale integration of intermittent renewable energies, such as solar and wind, introduces considerable uncertainty into an electric power system operation.1 Energy storage media and energy carriers are the missing links required for any sustainable and robust energy system.2 Currently, pumped hydroelectricity storage (PHS) and compressed air energy storage (CAES) are the only commercially available technologies capable of providing large scale (above 100 MW) energy storage.1,3 However, both of these technologies can be implemented only where the appropriate geographical or geological conditions are available,4 and they do not provide an energy carrier solution.

The chemical bonds within fuels are perhaps the most attractive form of large scale energy storage.5 For example, nature uses photosynthesis to convert sunlight into useful chemical energy in the form of biomass, and humans have long ago discovered the convenience of utilizing a variety of chemical fuels. Hydrogen is often considered as the cleanest fuel,2,6,7 emitting only water during utilization. However, the feasibility of a pure hydrogen economy is questionable due to safety issues associated with the transport of hydrogen, as well as the extremely low volumetric energy density of hydrogen, even when compresses or liquified.7

Nonetheless, chemical hydrogen storage in the form of other stable compounds is advantageous.5,8 Once available, hydrogen could be chemically stored via two major fuel carriers: carbon or nitrogen. However, entrapment of carbon is a challenge due to scarce levels of atmospheric CO2. Although some schemes to trap atmospheric CO2 are being discussed, the logistic challenges in production and transport are formidable when globally relevant quantities are considered.2 On the other hand, the global accessibility to atmospheric nitrogen, coupled to the future availability of hydrogen, will enable a large scale production of ammonia and its fertilizer derivatives. In addition, future photocatalytic water splitting processes can potentially be a low-cost alternative to the contemporary fossil fuel derived hydrogen.

In this work, we suggest a three component low carbon nitrogen-based alternative fuel as a chemical hydrogen storage medium and energy carrier. The fuel consists of an aqueous solution of Ammonium Nitrate (AN) with a reducing agent additive. As a global commodity, AN is already manufactured in millions of tons annually, and accounts for more than 24% of the world's nitrogen fertilizer market.9 It is considered to be an inexpensive condensed source of oxygen,10 and it is chemically stable over a wide range of temperatures and pressures.11 The solubility of AN in water is relatively high (66 wt% at 20 °C), and its aqueous form is chemically stable, nontoxic, nonflammable, and nonexplosive, making it safe to handle and transport.11

Urea was chosen as a reducing additive to react with the excess oxidizing species that are released during AN decomposition.12 Urea, the most important nitrogenous fertilizer worldwide,13 is also used to reduce the Nitrogen Oxides (NOx) levels in various stationary and mobile sources.14,15 Urea is favored for the reduction of AN decomposition products as it is a nontoxic and nonvolatile source of ammonia, and it is soluble in an aqueous AN solution. In addition, the total number of hydrogen bonds per water molecule is almost independent of the urea concentration, since urea fits structurally and sterically very well into the water hydrogen bond network.16

The ideal effluent composition of aqueous Urea Ammonium Nitrate (UAN) combustion is about 73.0% H2O, 21.6% N2, and 5.4% CO2 on a mole basis (Reaction (R1)). On an energy equivalent basis, the CO2 emission from aqueous UAN combustion is only about one forth than CO2 emission from natural gas combustion.

 
image file: c3ra47890d-t1.tif(R1)

In this paper we demonstrate the feasibility of the aqueous UAN continuous combustion process, and report on the dependence of this process on pressure, residence time, and fuel flow rate. Being common fertilizers, a clean usage of these materials as future fuels would expand their market as well as the production for these already common chemicals. As the economy of scale teaches, an increased production of a global mass product would inevitably bring down its cost – for everyone's benefit.

2. Experimental

Aqueous UAN combustion was carried out using a continuous high pressure reaction system (Scheme 1). The reagents were AN (≥99%, Sigma-Aldrich), urea (≥99.5%, Sigma-Aldrich) and water (Milli-Q® ultrapure water). The monofuel composition was 60% AN, 15% urea and 25% water by weight.
image file: c3ra47890d-s1.tif
Scheme 1 Experimental system setup. Bold lines indicate heating mantles. Red lines indicate heaters. Vessels are not to scale. LI: level indicator, TC: thermocouple, PT: pressure transmitter, PLC: programmable logic controller. FTIR: Fourier transform infrared.

The monofuel was pumped by a high pressure pump (SSI Series III 10 ml min−1) into a continuous 0.5 L cylindrical reactor (Parr N4652) composed of stainless steel 316T. The flow rate was set with 2% accuracy. The pressure inside the reactor was controlled by a Programmable Logic Controller (PLC) via a pneumatic valve and oscillated about ±2% in magnitude. The reactor was externally heated to 450 °C, and the temperature inside the reactor was measured using two thermocouples at different heights from the bottom of the reactor.

The 170 mm long fuel inlet tube with an internal diameter of 3.175 mm entered the reactor vertically from the top, and was extended towards the bottom of the reactor floor. The effluent gas flowed through a pneumatic actuator valve and entered an 11.5 L heated (180 °C) gas receiver in which the pressure was kept constant at 0.20 ± 0.01 MPa.

The reaction system was monitored and controlled by the PLC which also recorded the reactor's temperatures and pressure at one second intervals.

Sampled gas from the gas receiver was diluted by 99.995% N2 at a 1[thin space (1/6-em)]:[thin space (1/6-em)]40 ratio using a gas dilution unit (M&C DIL-1/H). The diluted gas was analyzed by a multicomponent online Fourier Transform Infrared (FTIR) gas spectrometer (Gasmet CX-4000O2) calibrated with the necessary standards. The selected species for analysis were H2O, CO2, CO, N2O, NO, NO2, NH3, HNO3 and HNCO. Homonuclear diatomic molecules (N2, O2, and H2) were not detected by the FTIR spectrometer since they are IR transparent. The spectrometer's sampling frequency was 10 Hz with automatic averaging over 20 second segments. Subsequently, 15 consecutive data points were averaged.

The dependency of the residence time inside the fuel inlet tube on pressure and fuel flow rate (eqn (E1)) was calculated under the following assumptions: (1) the reaction occurs immediately as the fluid enters the hot fuel inlet tube, (2) no condensation occurs inside the reactor, and all species exit the reactor in the gas phase, (3) the molar ratio of products to reactants is identical to that of the ideal reaction (Reaction (R1)), (4) the reactor is homogeneous, (5) the process is at a steady state, and (6) the ideal gas law applies. In addition, the following parameters were used: an effective tube volume of 1.35 ml, a fuel density of 1.33 g ml−1, and an average combustion temperature of 1000 °C.

In eqn (E1) τ indicates the residence time inside the tube, V indicates the free volume of the tube, Q indicates the gas flow rate out of the reactor, P indicates the absolute pressure inside the reactor, and r indicates the fuel flow rate into the reactor.

 
image file: c3ra47890d-t2.tif(E1)

Experiments were carried out under pressures ranging from 1 to 25 MPa and fuel flow rates ranging from 1.0 to 10.0 ml min−1. Gas from the receiver was sampled for online analysis after 10 residence times in the reactor have elapsed. For the calculation of the N2 yield, 1⅓ moles of N2 per 1 mole of AN was used as the maximum value (Reaction (R1)).

3. Results and discussion

3.1. Continuous combustion

In order to examine the feasibility of an aqueous nitrogen-based fuel combustion, continuous combustion experiment series were conducted under pressure. During a typical experiment conducted at 5 MPa, the average temperature measured inside the reactor 60 mm from the fuel inlet tube by TC2 (Scheme 1) was unaffected by the flow rate. However, the average temperatures measured 15 mm from the tip of the fuel inlet tube by TC3 were 535 °C and 660 °C at fuel flow rates of 4 ml min−1 and 8 ml min−1, respectively (Fig. 1A).
image file: c3ra47890d-f1.tif
Fig. 1 Aqueous UAN continuous combustion at 5 MPa. (A) Measured temperatures as a function of time at fuel flow rates of 8.00 ml min−1 and 4.00 ml min−1. TC2: temperature at 80 mm from the bottom of the reactor and 60 mm from the tip of the fuel inlet tube, TC3: temperature at 35 mm from the bottom of the reactor and 15 mm from the tip of the fuel inlet tube, TC4: temperature within the reactor's heater. (B and C) FTIR spectra of combustion products as a function of wavenumber at selected wavenumber ranges at different flow rates.

The aqueous UAN monofuel does not require an additional oxidizer, and it ignites once the required thermal conditions are met; hence the ignition may occur within the fuel inlet tube if its temperature is sufficiently high. We ensured this condition in this work, and consequently, the hottest zone in the reactor is expected to occur along this tube. As the gases pass the Exothermic Tube Segment (Exo-TS), they subsequently cool down due to the relatively colder reactor environment. The reported rising temperature at increased flow rate exclusively in the vicinity of the tube tip indicates that the Exo-TS advances further downstream towards the tube tip as the flow rate increases. Therefore, the data shown in Fig. 1A is consistent with the main combustion process essentially occurring within the fuel inlet tube. Unreacted species can further react in the reactor volume, yet at a lower rate due to the colder environment and lower concentration. The only species detected by FTIR analysis were NO2, NO, N2O, NH3, CO2, CO and H2O.

3.2. The flow rate effect

The decomposition of AN is known to be dependent on various factors such as pressure, temperature, sample volume and reactor design.10 As shown in Fig. 1B and C, the product composition of aqueous UAN continuous combustion was found to be affected by the flow rate. Although the observed levels of H2O and CO2 were not significantly affected by changes in the flow rate, levels of N2O and NH3 dropped considerably as the fuel flow rate decreased from 8 ml min−1 to 4 ml min−1 at 5 MPa.

At a constant pressure, the pollutant levels changed as the fuel flow rate increased. As shown in Fig. 2, minimum levels in N2O, NH3, and CO were observed, while the NO levels exhibited a maximum in the same fuel flow rate range.


image file: c3ra47890d-f2.tif
Fig. 2 Detected pollutants at a constant pressure of 5 MPa as a function of the fuel flow rate. The fuel flow rate was experimentally set, and the residence time inside the fuel inlet tube (Exo-TS) was theoretically calculated (eqn (E1)). Error bars indicate Standard Deviation (SD).

In order to overcome the high pressure inside the reactor, the fuel was injected by a piston pump. As a consequence, at low fuel flow rates the flow became intermittent due to the long delay between repeated piston strokes. Such intermittent flow caused frequent initiation and termination of the combustion. As further outlined below, the aqueous UAN combustion process proceeds through a radical reaction mechanism. Since intermittent flow of reactants diminishes the radical pool, desirable reaction pathways are interrupted, and relatively high pollutant levels are emitted at such low flow rate conditions.

On the other hand, at high fuel flow rates and relatively low pressures, the Exo-TS residence time can amount to several tens of milliseconds at the working conditions described in this work (eqn (E1)). The critical Exo-TS is where the highest concentration of radicals occurs as well as the highest temperature in the system. Albeit the high temperature in the inlet tube, the relatively short residence time is insufficient for the chain reaction process, and the gases exiting the fuel inlet tube are subsequently diluted and quenched in a colder gas environment inside the reactor. As a consequence, reaction pathways are slowed down or altered at high flow rate conditions, leading to incomplete combustion and to the observed higher pollutant levels.

At a representative constant pressure of 5 MPa, the flow intermittency phenomenon was dominant at fuel flow rates of up to about 3 ml min−1, giving rise to the high N2O, NH3 and CO levels. At fuel flow rates above 8 ml min−1, which correspond to residence times below 75 ms (eqn (E1)), the insufficient residence time caused pollutant levels to rise (Fig. 2).

Levels of NH3, for example, may rise once the radical pool depletes due to a deficiency in OH radicals. The presence of these radicals is critical for the conversion of NH3 to higher reactive species such as NH2 radicals by hydrogen abstraction (Reaction (R2)).17

At a constant pressure, the NO levels were inconsistent with the minimum phenomenon described above for the other pollutants (Fig. 2). A possible explanation of this effect is based on the opposite manner in which the NO and N2O species interact. Isocyanic acid (HNCO) from urea decomposition (Reaction (R3))18 reacts with OH radicals to give NCO radicals (Reaction (R4)).19 The presence of NCO contributes to the elimination of NO and the formation of N2O (Reaction (R5)), which is an important chain-terminating reaction.20 If the radical pool is sustained, O radicals compete with NO over NCO (Reactions (R5–R7)), thus hindering the removal of NO. Furthermore, the reaction of O with NCO yields NO (Reaction (R7)).17 These O radicals may also react with N2O, giving yet more NO (Reaction (R8)).17 Therefore, at the flow rate window where minimum N2O levels were obtained, relatively high NO levels were detected (Fig. 2).

 
NH3 + OH˙ ⇄ NH2˙ + H2O (R2)
 
NH2CONH2 ⇄ HNCO + NH3 (R3)
 
HNCO + OH˙ ⇄ NCO˙ + H2O (R4)
 
NCO˙ + NO˙ ⇄ N2O + CO (R5)
 
NCO˙ + NO˙ ⇄ N2 + CO2 (R6)
 
NCO˙ + O: ⇄ NO˙ + CO (R7)
 
N2O + O: ⇄ 2NO (R8)

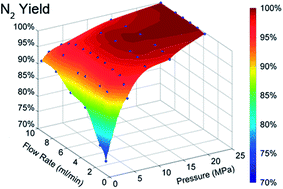
The intermittent reactant flow effect is prominent in a three dimensional representation of the species levels as a function of fuel flow rate and pressure as shown in Fig. 3. This effect is mainly illustrated by high levels of N2O and NH3, and by low N2 yield at fuel flow rates below 4 ml min−1 at relatively low pressures (Fig. 3C, D and F). The effect of the residence time is seen as a decrease in N2O, NH3, and CO levels (Fig. 3C–E) and as an increase in N2 yield (Fig. 3F). This effect is observed as the low pressure and high flow rate conditions change towards higher pressures and lower flow rates, reflecting short and long residence times, respectively.


image file: c3ra47890d-f3.tif
Fig. 3 Emission levels of major combustion pollutants and N2 yield. (A–E) Levels of NO2, NO, N2O, NH3, and CO in millimole per AN mole. Red dots indicate experimental data. (F) Yield of N2 was calculated using an atomic mass balance. Blue dots indicate calculated values. Surfaces were numerically interpolated using a cubic interpolation method with 300 steps in both x and y directions. The x and y axes of the N2 yield showing the pressure and fuel flow rate were inverted to better demonstrate the effect graphically.

3.3. The pressure effect

The effect of pressure on the pollutant levels involves two distinct regions. In the low pressure region of 1 to 5 MPa, a sharp and significant decrease in pollutant levels, as well as an increase in N2 yield, was observed as the pressure increased. In the high pressure region of 5 to 25 MPa, these trends proceeded to a lesser extent (Fig. 3). The lowest N2 yield, 72.73%, was obtained at a pressure of 1 MPa and a fuel flow rate of 1.2 ml min−1. The highest N2 yield, 99.89%, was obtained at a pressure of 25 MPa and a fuel flow rate of 10 ml min−1.

The flow rate effect described above (Section 3.2.) was found to be pressure-dependent, as the minimum and maximum trends of species levels seemed to reach an asymptotic value as the pressure increases (Fig. 3).

At a representative constant fuel flow rate of 6 ml min−1, the pollutant levels decreased drastically as pressure and residence time increased. Specifically, NO levels dropped by three orders of magnitude from 193.4 millimole per AN mole at 1 MPa, to 0.3 millimole per AN mole at 25 MPa (Fig. 4A). With the exception of NO2, the distribution of the nitrogen-containing pollutants was approximately constant at the low pressure region of 1 to 5 MPa (Fig. 4B). The levels of NO2 decreased only slightly from 5.6 millimole per AN mole at 1 MPa to 2.5 millimole per AN mole at 2.5 MPa. However, at 5 MPa levels of NO2 decreased abruptly below the detection limit (the detection limit is equivalent to about 0.1 millimole per AN mole). Levels of NO2 remained under detection limit at higher pressures as well. Below 5 MPa, the NO species was the major detected pollutant, accounting for about 60% of the total nitrogen-containing pollutants. However, above 5 MPa the relative amount of NO decreased significantly, and at 25 MPa it was as low as 6.7% of the overall nitrogen-containing pollutants (Fig. 4B). Although the relative amount of N2O increased at higher pressures, accounting for about 70% of all nitrogen-containing pollutants (Fig. 4B), its absolute level decreased monotonically (Fig. 4A).


image file: c3ra47890d-f4.tif
Fig. 4 Detected nitrogen-containing pollutants at a constant fuel flow rate of 6 ml min−1. (A) Absolute levels of detected nitrogen pollutants at varied pressures and Exo-TS residence times. (B) Distribution of nitrogen-containing pollutants at varied pressures and Exo-TS residence times. Pressure was experimentally set, while residence time was theoretically calculated. Error bars indicate SD. The error bars in B are relatively large at higher pressures and short residence times due to the relatively low pollutant levels under these conditions, and the limited resolution of the FTIR detection system.

Higher pressures result in an increased volumetric concentration, which directly increases the reaction kinetics. A threshold pressure of 5 MPa was found to separate between two distinct pressure regions. While the product distribution generally remained constant at the low pressure region, the decrease in absolute pollutant levels indicates higher reaction rates with no principal change in reaction pathways. On the other hand, in the high pressure region the considerable variation in product composition suggests that a critical minimum intermediate concentration was reached, and that reaction pathways were altered. A possible radical reaction mechanism is postulated below.

3.4. Nitrogen transformation routes

Generally, combustion of aqueous UAN is characterized by endothermic processes followed by exothermic reactions. While a conventional liquid fuel (e.g., gasoline) only vaporizes prior to its combustion in air, aqueous UAN involves significant endothermic processes in addition to water vaporization. These processes include the dissociation of AN to ammonia and nitric acid mediated by a proton transfer (Reaction (R9)),21 nitric acid homolysis (Reaction (R10)),22 urea decomposition into HNCO and ammonia (Reaction (R3)), and urea hydrolysis (Reaction (R11)).18 Other endothermic high temperature decomposition pathways have also been proposed for urea.18,22
 
NH4NO3(l) ⇄ NH3(g) + HNO3(g), ΔĤoRxn = +169.0 kJ mol−1 (R9)
 
image file: c3ra47890d-t3.tif(R10)
 
NH2CONH2(aq.) + H2O(l) ⇄ CO2(g) + 2NH3(g), ΔĤoRxn = +77.1 kJ mol−1 (R11)

The prevailing intermediate species in aqueous UAN combustion are analogous to those identified in several NOx removal processes20 and in combustion of nitrogen that is chemically bound to carbon-based fuels.23 Reaction pathways reported in the literature for AN thermal decomposition21,24,25 and nitrogen chemistry in combustion20,23 can be used to better understand the aqueous UAN combustion mechanism subsequent to the endothermic processes reported above.

The initial oxidized nitrogen species in the aqueous UAN combustion system is HNO3 from AN dissociation (Reaction (R9)), which has the highest nitrogen oxidation state in the system of +5 (Fig. 5). This species was not detected in the effluent gas since it readily decomposes at relatively low temperatures; HNO3 was assumed to completely decompose inside the hot reactor. Above 290 °C, AN decomposition is known to progress through a radical reaction pathway, where the HNO3 homolysis into NO2 and OH radicals constitutes the Rate Determining Step (RDS) (Reaction (R10)).21 Dissociation of AN (Reaction (R9)), urea decomposition (Reaction (R3)), and urea hydrolysis (Reactions (R11)) produce NH3, which further reacts with OH radicals or other oxidizing species to form the reactive NH2 (Reaction (R2)), NH, N2H, and N radicals26 (Fig. 5).


image file: c3ra47890d-f5.tif
Fig. 5 Schematic outline of the principal reaction pathways of aqueous UAN combustion. Reactions are reversible, the arrows indicate the prominent reaction direction. Several reactions are duplicated in the scheme for clarity. The nitrogen oxidation state is indicated for selected species.

As the pressure increases, the first nitrogen-containing pollutant to decrease was found to be NO2. Subsequently, a decrease in NO levels was observed above 5 MPa (Fig. 4B). The absolute levels of N2O decreased as well with increasing pressure (Fig. 4A). Still, N2O is the main nitrogen-containing pollutant detected at 25 MPa (Fig. 4B). As the reaction coordinate progresses, the nitrogen oxidation states gradually decrease from +5 (HNO3), to +4 (NO2), then to +2 (NO), and eventually +1 (N2O). This pathway eventually leads to nitrogen atom formation with a zero oxidation number – namely N2. This transformation route of the nitrogen-containing pollutants is consistent with the nitrogen oxidation state of each pollutant (Fig. 5).

3.5. Regulation view point

Emission regulation and standards need to be considered before any novel fuel such as the one presented in this work is utilized. To put the current results into perspective, the US Environmental Protection Agency (EPA) regulation for stationary power generation turbines was used.

The identified pollutants of aqueous UAN combustion were NOx, CO and NH3. The NOx family includes seven compounds,27 out of which only N2O, NO and NO2 were detected in this work. For power generation using natural gas and fuels other than natural gas, the NOx emission standards are 290 mg MJ−1 and 700 mg MJ−1, respectively.28 These values are attributed to new stationary power generation turbines producing useful output of less than 53 GJ h−1 (measured as high heat value of heat input at peak load). The corresponding emission standard of CO is 6.4 mg MJ−1 with regard to natural gas-fired turbines.29 An NH3 emission standard is not available for stationary power generation because it is not emitted by fossil fuel combustion.

The emissions of aqueous UAN combustion in the laboratory scale reactor described here were calculated using the collected data at 25 MPa and a fuel flow rate of 10 ml min−1. These emissions were found to be 127 mg MJ−1 of NOx, 8 mg MJ−1 of CO, and 17 mg MJ−1 of NH3. While the CO emission was slightly above the standard level, the NOx emission was significantly below the regulation standard.

The current reactor used in this work was not ideal due to a nonuniform temperature profile and a large distribution of the residence times. An improved reactor design and an implementation of a catalytic converter are expected to further reduce all of the pollutants much below the regulation levels.

4. Conclusions

In this paper we demonstrated a continuous and stable combustion of aqueous UAN at different pressures and fuel flow rates. The ignition of the monofuel took place inside the fuel inlet tube within the reactor. Residence time, fluctuations in fuel feed, and working pressure strongly affected the effluent gas composition.

Up to pressures of 5 MPa, a substantial decrease in absolute levels of all pollutants was observed, yet the distribution of the nitrogen-containing pollutants was approximately constant. At higher pressures, the absolute pollutant levels further decreased, yet the ratio of the nitrogen-containing pollutants changed significantly. Specifically, above 2.5 MPa NO2 levels fell below the detection limit.

We proposed a radical reaction mechanism which correlates with the experimental data. The nitrogen transformation route in the mechanism was consistent with the decreasing nitrogen oxidation state during the process. We found that a sustainable and efficient combustion of aqueous UAN requires an uninterrupted reactant flow in order to continuously replenish the radical pool.

Emissions of CO were slightly above regulation standards. However, the maximal N2 yield was 99.89%, and laboratory scale NOx emissions were below the regulation standards for stationary power generation turbines. An improved reactor design and catalytic treatment of effluent gases should be considered in order to further reduce NOx, NH3 and CO levels.

In summary, the aqueous UAN low carbon nitrogen-based alternative fuel seems to offer a very compelling technology for chemical hydrogen storage due to its relatively high energy density and ease of clean operation. Coupled to the future availability of abundant hydrogen from water splitting, this fuel facilitates the development of low carbon and non-carbon chemical hydrogen storage. Additional complete life cycle analysis work of these fuels is required.

Acknowledgements

The authors acknowledge the generous support of Mr. Ed Satell, Philadelphia, PA, and the Nancy and Stephen Grand Technion Energy Program (GTEP), as well as the Committee for Planning and Budgeting of the Council for Higher Education under the framework of the KAMEA Program.

Notes and references

  1. M. Beaudin, H. Zareipour, A. Schellenberglabe and W. Rosehart, Energy Sustainable Dev., 2010, 14(4), 302,  DOI:10.1016/j.esd.2010.09.007.
  2. J. A. Turner, Science, 1999, 285(5428), 687,  DOI:10.1126/science.285.5428.687.
  3. S. Succar and R. H. Williams, Compressed air energy storage: theory, resources, and applications for wind power, Princeton Environmental Institute Report, 2008.
  4. S. M. Schoenung, Characteristics and technologies for long-vs. short-term energy storage, Tech. Rep. SAND2001-0765, Sandia National Laboratories, New Mexico, 2001 Search PubMed.
  5. N. S. Lewis, Science, 2007, 315(5813), 798,  DOI:10.1126/science.1137014.
  6. L. W. Jones, Toward a Liquid Hydrogen Fuel Economy, Tech. Rep. UM-HE-70-2, Univ. of Michigan, Environmental Action for Survival, Ann Arbor, 1970 Search PubMed.
  7. Committee on Alternatives and Strategies for Future Hydrogen Production and Use, National Research Council, National Academy of Engineering, in The Hydrogen Economy: Opportunities, Costs, Barriers, and R&D Needs, The National Academies Press, Washington, DC, 2004, ISBN: 978-0309530682 Search PubMed.
  8. R. L. Cohen and J. H. Wernick, Science, 1981, 214(4525), 1081,  DOI:10.1126/science.214.4525.1081.
  9. K. H. Zapp, et al., in Ullmann's Encyclopedia of Industrial Chemistry, Wiley, Weinheim, Germany, 2000, vol. 3,  DOI:10.1002/14356007.a02_243.
  10. C. Oommen and S. R. Jain, J. Hazard. Mater., 1999, 67(3), 253,  DOI:10.1016/S0304-3894(99)00039-4.
  11. L. M. Medard, in Accidental Explosions, Wiley, Chichester, England, 1989, vol. 2, ch. 23, ISBN: 978-0470215326 Search PubMed.
  12. A. F. Makarov and A. S. Trunin, ISJAEE, 2005, 4(24), 42 Search PubMed.
  13. J. H. Meessen, in Ullmann's Encyclopedia of Industrial Chemistry, Wiley, Weinheim, Germany, 2010, vol. 37,  DOI:10.1002/14356007.a27_333.pub2.
  14. H. L. Fang and H. F. M. DaCosta, Appl. Catal., B, 2003, 46(1), 17,  DOI:10.1016/S0926-3373(03)00177-2.
  15. M. Koebel, M. Elsener and M. Kleemann, Catal. Today, 2000, 59(3–4), 335,  DOI:10.1016/S0920-5861(00)00299-6.
  16. M. C. Stumpe and H. Grubmüller, J. Phys. Chem. B, 2007, 111(22), 6220,  DOI:10.1021/jp066474n.
  17. J. A. Miller and C. T. Bowman, Prog. Energy Combust. Sci., 1989, 15(4), 287,  DOI:10.1016/0360-1285(89)90017-8.
  18. M. Koebel and E. O. Strutz, Ind. Eng. Chem. Res., 2003, 42(10), 2093,  DOI:10.1021/ie020950o.
  19. M. U. Alzueta, R. Bilbao, A. Millera, M. Oliva and J. C. Ibañez, Energy Fuels, 1998, 12(5), 1001,  DOI:10.1021/ef980055a.
  20. P. Glarborg and J. A. Miller, Combust. Flame, 1994, 99(3–4), 475,  DOI:10.1016/0010-2180(94)90039-6.
  21. K. R. Brower, J. C. Oxley and M. Tewari, J. Phys. Chem., 1989, 93(10), 4029,  DOI:10.1021/j100347a033.
  22. A. Lundström, B. Andersson and L. Olsson, Chem. Eng. J., 2009, 150(2–3), 544,  DOI:10.1016/j.cej.2009.03.044.
  23. J. A. Miller, et al., Symp. (Int.) Combust., [Proc.], 1985, 20(1), 673,  DOI:10.1016/S0082-0784(85)80557-9.
  24. J. H. Koper, O. G. Jansen and P. J. Van Denberg, Explosivstoffe, 1970, 18(8), 181 CAS.
  25. S. Cagnina, P. Rotureau, G. Fayet and C. Adamo, Phys. Chem. Chem. Phys., 2013, 26(15), 10849,  10.1039/c3cp50368b.
  26. I. Glassman and R. A. Yetter, in Combustion, Elsevier, Burlington, MA, 4th edn, 2008, ISBN: 978-0120885732 Search PubMed.
  27. U.S. Environmental Protection Agency, Nitrogen Oxides (NOx), Why and How they are Controlled, EPA Publication 456/F-99-006R, 1999 Search PubMed.
  28. U.S. Environmental Protection Agency, Standards of Performance for Stationary Combustion Turbines, Final Rule, Federal Register vol. 71, no. 129, p. 38505, 2006 Search PubMed.
  29. U.S. Environmental Protection Agency, Stationary Internal Combustion Sources, AP 42, 5th edn, 2000, vol. 1, ch. 3 Search PubMed.

This journal is © The Royal Society of Chemistry 2014