Carbon-based quantum dots for fluorescence imaging of cells and tissues
Pengju G. Luo
a,
Fan Yang
a,
Sheng-Tao Yang
*b,
Sumit K. Sonkar
a,
Liju Yang
c,
Jessica J. Brogliec,
Yun Liua and
Ya-Ping Sun
*a
aDepartment of Chemistry and Laboratory for Emerging Materials and Technology, Clemson University, Clemson, South Carolina 29634, USA. E-mail: syaping@clemson.edu
bCollege of Chemistry and Environment Protection Engineering, Southwest University for Nationalities, Chengdu 610041, China. E-mail: yangst@pku.edu
cDepartment of Pharmaceutical Sciences, Biomanufacturing Research Institute and Technology Enterprise, North Carolina Central University, Durham, NC 27707, USA
First published on 5th February 2014
Abstract
Carbon dots (or carbon quantum dots in some literature reports), generally small carbon nanoparticles with various surface passivation effects, have attracted widespread attention in recent years, with a rapidly increasing number of research publications. The reported studies covered many aspects of carbon dots, from the development of many new synthetic methodologies to an improved mechanistic elucidation and to the exploration of application opportunities, especially for those in the fluorescence imaging of cells and tissues. There have also been significant advances in the establishment of a shared mechanistic framework for carbon dots and other carbon-based quantum dots, graphene quantum dots in particular. In this article, representative recent studies for more efficient syntheses of better-performing carbon dots are highlighted along with results from explorations of their various bioimaging applications in vitro and in vivo. Similar fluorescence properties and potential imaging uses of some graphene quantum dots are also discussed, toward a more consistent and uniform understanding of phenomenologically different carbon-based quantum dots.
 Pengju G. Luo | Pengju G. Luo has been a faculty member at Sherman College of Chiropractic since 2006. He received his medical degree in Clinical Medicine from Tongji Medical University, Wuhan, China in 1997 and his Ph.D. in Microbiology from Clemson University in 2006. His current research interests are in the interdisciplinary areas of nanotechnology and biological and biomedical sciences, focusing on bioapplications of various nanomaterials such as nanoparticles, nanotubes, and carbon dots. |
 Fan Yang | Fan Yang obtained his B.S. degree in Chemistry from Zhejiang University, China in 2010. He is currently pursuing his Ph.D. at Clemson University under the supervision of Prof. Ya-Ping Sun. His research focus is on the synthesis of carbon dots for their applications in bioimaging and energy conversions. |
 Sheng-Tao Yang | Sheng-Tao Yang received his B.Sc. in 2006 and Ph.D. in 2011 at Peking University majoring in chemistry. During 2008–2009, he studied as a visiting student under Prof. Ya-Ping Sun's supervision in the Department of Chemistry at Clemson University. Since 2011, he works as a lecturer at College of Chemistry and Environment Protection Engineering, Southwest University for Nationalities. His current research focuses on the bioapplications and biosafety of carbon nanomaterials. |
 Sumit K. Sonkar | Sumit K. Sonkar received his Ph.D. in chemistry from the Indian Institute of Technology Kanpur, India in 2012. He was a postdoctoral scientist in Prof. Ya-Ping Sun's group at Clemson focusing on the development and characterization of carbon-based quantum dots for bioimaging and energy related applications. |
 Liju Yang | Dr Liju Yang is currently an associate professor in the Department of Pharmaceutical Sciences and the Biomanufacturing Research Institute and Technology Enterprise (BRITE) at North Carolina Central University (NCCU). She received her B.S. degree in Chemistry from Hangzhou Teachers College and M.S. degree in Analytical Chemistry from Hangzhou University, China, in 1991 and 1996, respectively. She received her Ph.D. degree in Biological and Agricultural Engineering from the University of Arkansas in Dec 2003, and did her postdoctoral research in the School of Electrical and Computer Engineering at Purdue University. She joined NCCU as a faculty member in Feb 2006. Her current research focuses on two areas: (i) the development of novel biosensors, biochips and microdevices for applications in food safety, drug discovery, and biomedical diagnostics; and (ii) nanomaterials interfacing with biological entities. |
 Ya-Ping Sun | Ya-Ping Sun earned his Ph.D. at Florida State University in 1989. After postdoctoral training at University of Texas at Austin, he joined the Clemson faculty in 1992. He has been the Frank Henry Leslie Chair Professor of Natural & Physical Sciences since 2003. His research interests are primarily in carbon-based nanomaterials. |
1. Introduction
Semiconductor nanocrystals of physical dimensions smaller than the exciton Bohr radius are commonly referred to as quantum dots (QDs) for the quantum confinement effect, manifested in terms of systematically predictable dependence of optical properties, especially fluorescence emission colors, on the nanocrystal dimension.1–3 More specifically, conventional semiconductor QDs have been widely pursued as superior fluorescence dyes for imaging and other biomedical applications.4–7 In fact, the rationale for the use of QDs over organic dyes is now generally accepted in the literature.8 Similarly bright and colorful fluorescence emissions have been found in other nanomaterials containing no conventional semiconductors, and those fluorescent nanomaterials are often considered, more phenomenologically perhaps, as QDs as well, despite the absence of any classical quantum confinement effect in most cases. Among more popular and promising recent additions to the loosely defined QD family are carbon-based QDs.9–12 Unlike conventional semiconductor QDs, whose typical contents of heavy metal elements such as cadmium or lead have generated much concerns with respect to in vivo or even in vitro uses,7,13–15 carbon-based QDs are pursued as nontoxic alternatives in the development of fluorescence imaging agents for various biomedical purposes.10–12Carbon-based QDs generally refer to brightly fluorescent carbon dots (Scheme 1, Fig. 1)9 and graphene QDs (GQDs).16,17 The former is based solely on defects in the carbon nanostructures,9–11,18,19 while the latter is mechanistically divided into two categories, with one depending on defects and the other on isolated π domains on graphene sheets.20 However, since the defect-derived fluorescence emissions in GQDs are more dominating, a strong case has been made that a significant portion of the observed fluorescence properties in GQDs may be understood in terms of the same mechanistic framework developed for carbon dots.21 Therefore, in this article we will focus on highlighting studies of carbon dots and their mechanistically similar GQDs as fluorescence bioimaging agents that are performance-wise competitive to those of conventional semiconductor QDs. The existing uses of these carbon nanomaterials in fluorescence imaging of cells and tissues are also highlighted, and issues and prospects in such applications discussed.
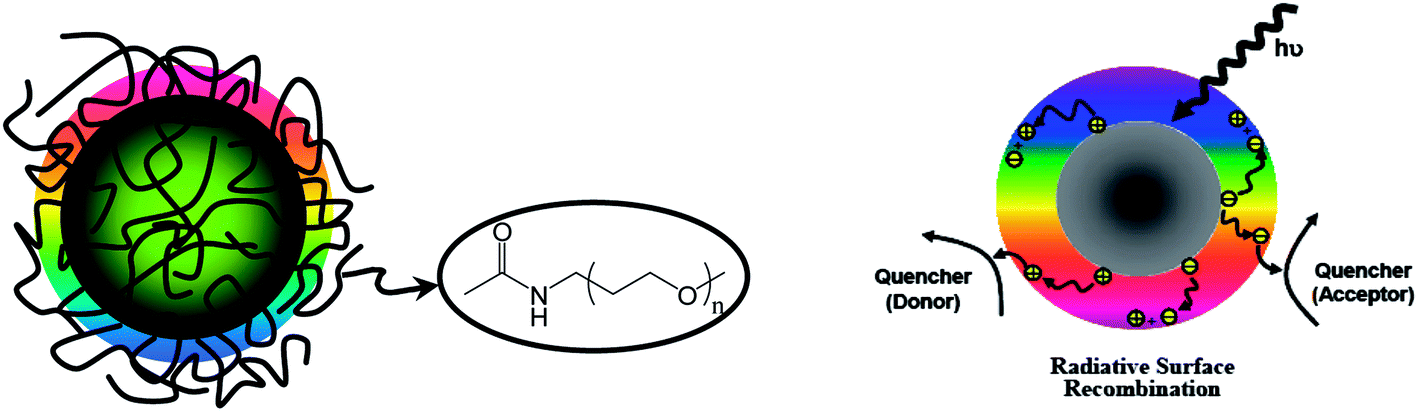 | ||
| Scheme 1 Left: a cartoon illustration on the simple amino-PEG-functionalized carbon dots, where the colored corona-like layer illustrates the origin of fluorescence emissions. Right: the presently more accepted mechanistic framework on surface-confined electrons and holes and their recombinations being responsible for the fluorescence emissions in carbon dots (which could be quenched by either electron acceptors or donors, as found experimentally). | ||
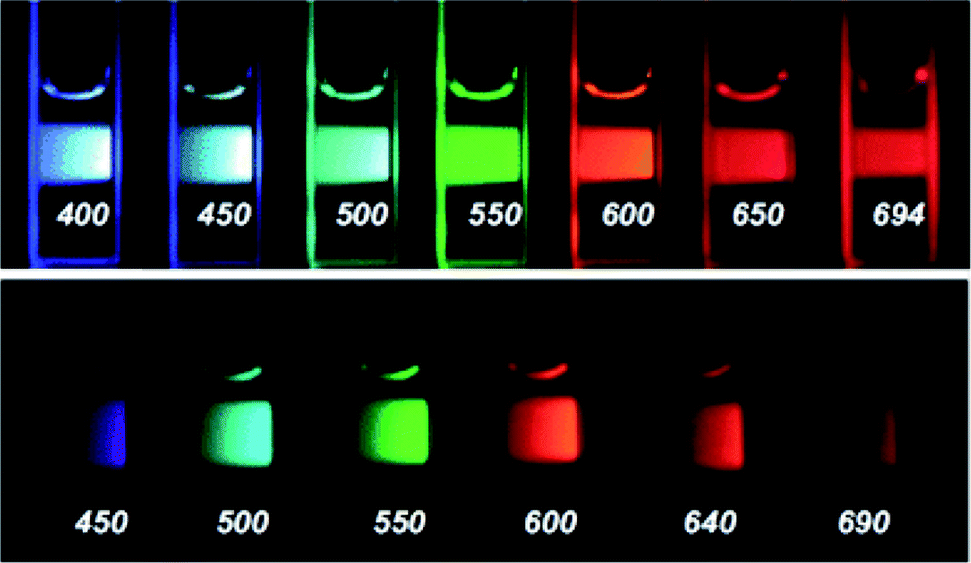 | ||
| Fig. 1 Aqueous solutions of the as-synthesized carbon dots excited at the indicated wavelengths in nm and photographed directly (top), and excited at 400 nm and photographed through band-pass filters of different wavelengths as indicated (bottom) (from ref. 9). | ||
2. Carbon dots
Carbon dots (also referred to as carbon quantum dots or C-Dots) are generally small carbon nanoparticles with various surface passivation via modification or functionalization.9–12,22,23 Ever since the original report on carbon dots in 2006,9 there have been extensive investigations by many research groups around the world, with major progress made in the development of synthetic strategies,12,24 in the structural and mechanistic understandings of carbon dots,21 and in the exploration of their potential applications.25,26The original finding of carbon dots was inspired by the results from studies of functionalized carbon nanotubes.9,12 For both single-walled and multiple-walled carbon nanotubes, the passivation of surface defects with the chemical functionalization resulted in bright and colorful fluorescence emissions at various excitation wavelengths from UV to near-IR.27–29 The inspiration was associated with the recognition that small carbon nanoparticles are full of surface defects, which upon effective surface passivation via chemical functionalization should be equally or more fluorescent over similar spectral regions. Indeed, it was found that the solutions of surface-functionalized small carbon nanoparticles, now called carbon dots (Scheme 1), exhibited bright and colorful fluorescence emissions over the visible and extending into the near-IR (Fig. 1).9,12,21 Carbon dots were also found as being strongly multiphoton fluorescent, with extremely large two-photon cross-sections observed in the pulsed laser excitation (800–900 nm) of carbon dots for visible fluorescence emissions.10 With their bright one- and multi-photon fluorescence emissions and other linear and nonlinear optical properties,30,31 carbon dots have been widely pursued for a variety of interesting and/or unique applications, with examples including bioimaging,32 photodynamic therapy,33 fluorescent probing and analysis,34 and photocatalysis.35 Since carbon dots are generally nontoxic (no more toxic than the selected surface functionalization molecules),36 and also generally high in photostability,9,12 their uses in fluorescence imaging of cells and tissues may prove to be particularly significant. For all of these potential applications, much effort has been made in the development of synthetic methodologies for the targeted properties and uses, which are highlighted as follows.
Synthesis
Since 2006,9 research groups worldwide have developed many physical and chemical methods for the production of carbon nanoparticles, which were used as precursors for carbon dots or suspended in various solvents for fluorescence measurements directly. Among more popular methods were laser ablation,9 electrochemical oxidization,37 chemical oxidation,38 hydrothermal carbonization,39 and pyrolysis.40 In a broad definition, carbon dots may include “naked” carbon nanoparticles in aqueous and other suspensions, in which multicolor fluorescence emissions under different excitation conditions have been reported by a number of research groups,41 though the observed emission quantum yields were generally low to very low for the truly naked.42–47 It was argued that even for the truly naked carbon nanoparticles in various suspensions, the solvent molecules were likely responsible for some limited yet meaningful particle surface passivation, thus somewhat brighter emissions in those solvents that such passivation effects were more significant.45 Therefore, generally speaking brighter fluorescence emissions were observed in carbon dots with the core carbon nanoparticles surface-passivated, either deliberately or by default from some synthesis methods.The original report on carbon dots was on functionalized small carbon nanoparticles, namely that the particle surface passivation was deliberate in terms of chemical functionalization.9 Experimentally, the precursor carbon nanoparticles were treated with nitric acid for the introduction of surface groups subsequently used for the functionalization chemistry. The functionalization agents included the now widely used oligomeric polyethylene glycol diamine (PEG1500N) and aminopolymer (PPEI-EI), and the resulting carbon dots exhibited bright fluorescence emissions of quantum yields up to 10% or higher.9 Since then, various precursor carbon nanoparticles were functionalized for brightly fluorescent carbon dots, including commercially available carbon nanopowders48 and carbon nanoparticles separated from candle soot,42 gas soot,49 lampblack,50 and other carbon nanomaterials.38
For the surface functionalization, a long list of molecules and species have been investigated, such as PEGs of different molecular weights,51,52 mercaptosuccinic acid,53 ethylenediamine,54 polyethylenimine (PEI),30 and oleylamine.55 It is probably no coincident that most of these surface passivation agents are molecules with amino moieties, which must be particularly effective in the desired passivation for brighter fluorescence emissions.
A more popular approach has been to combine the formation of precursor carbon nanoparticles with surface passivation, namely “one-pot” syntheses or their equivalents.32 These syntheses were sometimes misunderstood as being capable of producing brightly fluorescent carbon dots without surface passivation, though more likely the syntheses had the passivation effects built in without any separate procedures. For example, graphite56–58 and carbon nanotubes59 were electrochemically oxidized into carbon dots, in the presence of specific surface functional groups. More popular than electrochemical synthesis was the use of hydrothermal treatments, which were demonstrated as being effective in converting organic molecules into fluorescent carbon dots. Among organic precursors in the reported studies were glucose,60 EDTA,61 citric acid,62–64 thiomalic acid (TMA),65 1,3,5-trimethylbenzene (TMB),66 or even fullerene67,68 and somewhat unusual yet perfectly normal precursors such as orange juice.69 In one interesting study of fullerene-based carbon dots, fullerene was first conjugated with tetraethylene glycol (TEG), and the TEG–fullerene conjugates were aggregated into larger nanoparticles at higher concentrations (Fig. 2). The observed fluorescence color could be regulated by the conjugate concentration, with higher concentration red-shifting the fluorescence emission. However, the observed fluorescence quantum yields were all relatively low, less than 1%.68
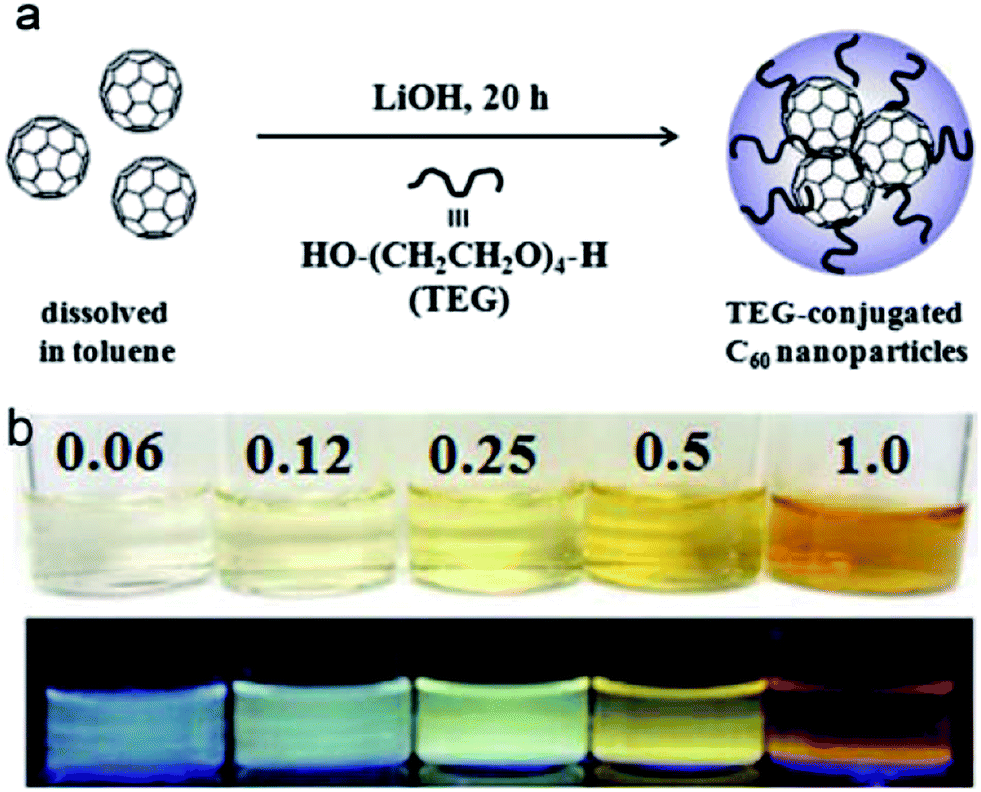 | ||
| Fig. 2 (a) The synthesis of TEG-conjugated fullerenes; and (b) photograph of the conjugates at different fullerene concentrations under white light (top) and under a UV lamp (365 nm, bottom) (from ref. 68). | ||
In addition to the popular hydrothermal syntheses, conceptionally similar sonication70 and microwave irradation71 techniques were also employed for the purpose. In all these methods, the carbonization was likely responsible for the formation of carbon nanoparticles, with the passivation effect due to the residual organic species in the resulting carbon dots. Nevertheless, while the fluorescence quantum yields of the carbon dots from these one-pot syntheses were significant, they were still generally lower than those in carbon dots prepared from the deliberate surface functionalization of precursor carbon nanoparticles.12
Yang et al. added templating effect to the synthesis of carbon dots from organic precursors, dubbed “soft-hard template approach”,66 to manipulate the dot sizes, compositions, crystalinities and fluorescence properties. The soft template was the copolymer Pluronic P123, and the hard template was the ordered mesoporous silica (OMS) SBA-15, with the organic precursors including 1,3,5-trimethylbenzene (TMB), diaminobenzene (DAB), pyrene (PY), and phenanthroline (PHA).
Greener syntheses
There has been much recent effort on developing greener production methods for carbon dots, valuable to the preparation for larger scale applications. A major feature in the reported productions was the use of biological species or natural products as precursors, including especially peptides and proteins and a variety of carbohydrates. Examples for proteins were meat products,72 natural silk,73 bovine serum albumin (BSA),74,75 egg shell membrane ash,76 hair fiber77 and gelatins,78 and those for carbohydrates included glycerol,79,80 chitosan,81,82 cellulose and cyclodextrin,41 and sucrose.83 In addition to the orange juice discussed above, other food products or byproducts used as precursors for carbon dots were pretty diverse, including other fruit juices,84 bread,85 caramels,86 honey,87 and sweet pepper.88 Even greener precursors were those from biomass and bio-wastes, such as grass,89 watermelon peel,90 plant leaves,91 plant bark (willow),92 and paper ash.93 Some representative studies are highlighted as follows.Wang et al. used the char from overcooked BBQ meat as precursor for carbon dots, with a purpose to demonstrate the versatility with respect to the dots in terms of their structures, composition, and properties (Fig. 3).72 The resulting carbon dots with PEG1500N for surface functionalization exhibited fluorescence quantum yields up to 40%. Although the expectation was for the carbon nanoparticles to be primarily from the carbonization of meet proteins, their chemical compositions were likely more complicated. Therefore, the high fluorescence performance of the carbon dots suggested that carbon dots are intrinsically versatile in the core structure and composition and performance-wise robust.72
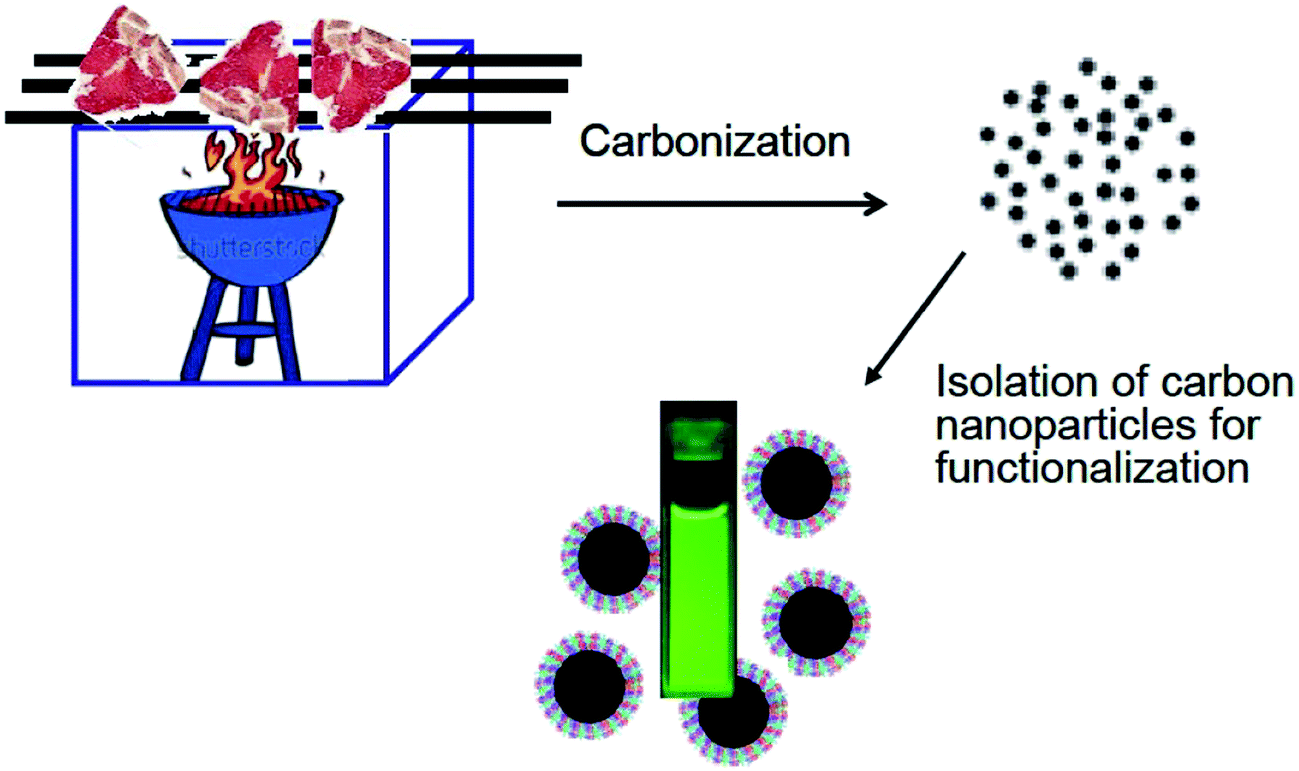 | ||
| Fig. 3 A cartoon illustration on the preparation of carbon dots from overcooked BBQ meat (adapted from ref. 72). | ||
Bhunia et al. synthesized carbon dots less than 10 nm in diameter from the carbonization of carbohydrates.94 There were two versions of the dots, hydrophobic and hydrophilic, both of which exhibited blue and green fluorescence emissions. The hydrophobic ones were produced by mixing different amounts of the carbohydrate with octadecylamine and octadecene for being heated up to 300 °C for up to 30 min. The hydrophilic ones were synthesized by heating aqueous solution of the carbohydrate at different pH values, including the use of concentrated sulphuric acid. The hydrophilic dots with yellow and red emissions were synthesized by mixing an aqueous solution of the carbohydrate with concentrated phosphoric acid and then heating at 80–90 °C for up to 60 min (Fig. 4).94
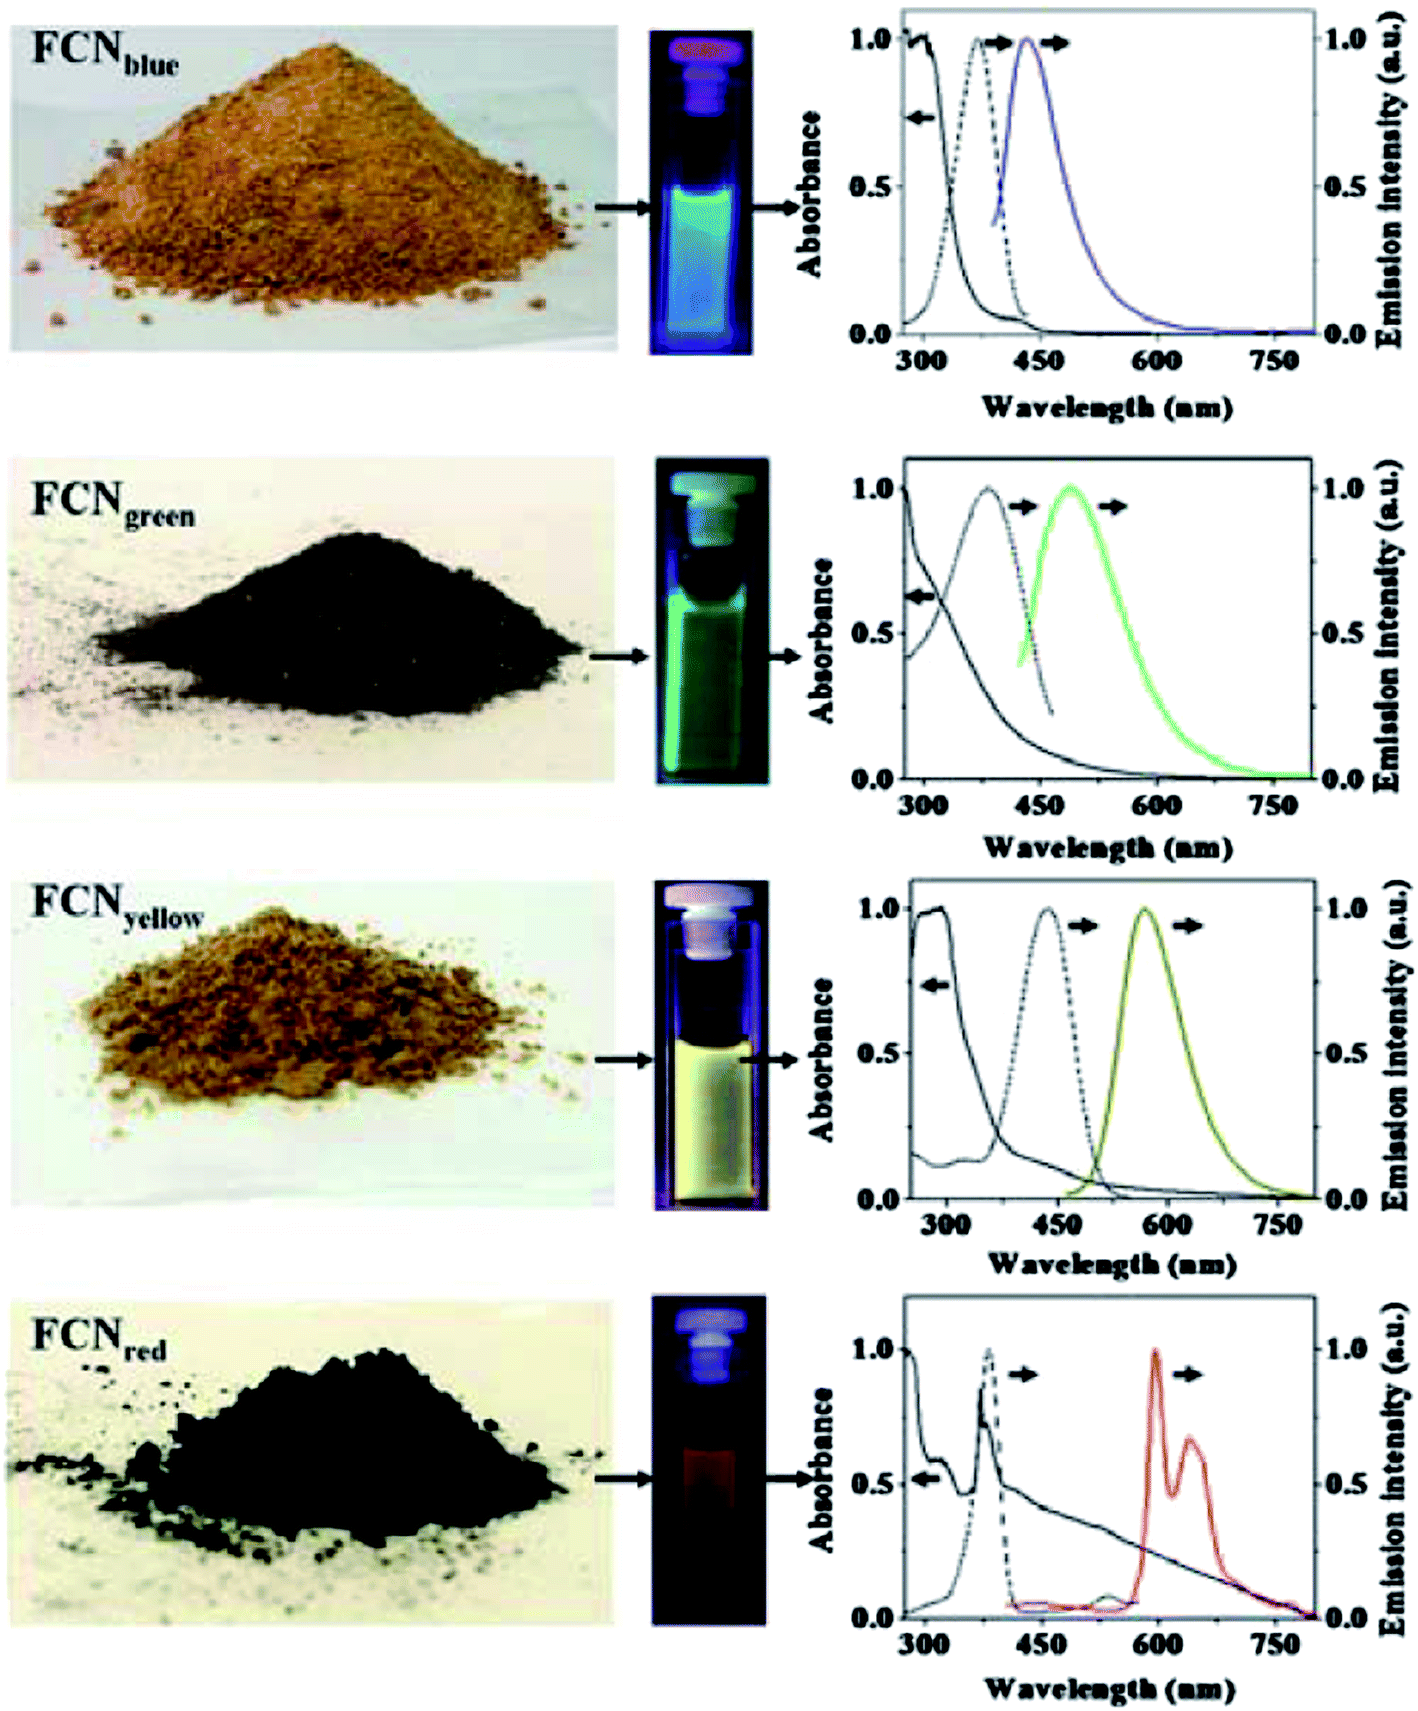 | ||
| Fig. 4 Digital images on gram-scale solid samples of fluorescent carbon nanoparticles (FCN), solutions under various excitations, and corresponding absorption (solid line left), excitation (dotted line), and emission (colored solid line right) spectra. Emission spectra were measured with excitation at 370 nm for FCNblue, 400 nm for FCNgreen, 425 nm for FCNyellow, and 385 nm for FCNred. All excitation spectra were recorded by monitoring at the respective emission maxima (from ref. 94). | ||
Wu et al. synthesized carbon dots from honey.87 The fluorescence emissions were enhanced by the surface passivation with hyperbranched polymers, with the enhancement was also observed in the near-IR spectral region. De et al. reported the synthesis of small carbon dots from banana juice, for which the procedure was simply heating the banana (Musa acuminata) juice at 150 °C for 4 h.84
Krysmann et al. demonstrated that carbon dots could be produced from soft tissue biomass.89 The pyrolytic decomposition of shredded grass at 300 °C in air resulted in the formation of well-defined carbogenic nanoparticles, which were further functionalized with amino molecules (ethanolamine, 2-aminoethane sodium sulfonate, and oleylamine) to yield hydrophilic and hydrophobic carbon dots. As reported, these carbon dots were particularly stable.89
Property manipulation and enhancement
There have been many reports on strategies aimed at manipulating the structural features and optical properties of carbon dots for improvements, especially with respect to increasing the fluorescence brightness and extending the emissions into red and near-IR special regions for enhanced bioimaging applications. Apparently higher fluorescence quantum yields in carbon dots could be achieved through more effective surface passivation of the core carbon nanoparticles95 and doping in the core96 and on the surface.22,97Carbon dots with deliberate surface passivation via chemical functionalization are generally more fluorescent.12 The samples as-prepared are typically mixtures of carbon dots with different fluorescence quantum yields, attributed to variations in the surface functionalization, which could be recognized in chromatography columns to enable fractionations for the harvesting of the highly fluorescent carbon dots.95 Wang et al. first applied a conventional size-exclusion gel column to the fractionation to obtain PEG1500N-functionalized carbon dots of fluorescence quantum yields 60% or higher, which were shown to be performance-wise competitive to the commercially supplied CdSe–ZnS QDs in the comparable spectral region.95 The fractionation approach has since been extended to include separation techniques such as selective centrifugation, HPLC, and capillary zone electrophoresis for harvesting carbon dots of better performance.98–100 For example, in the capillary zone electrophoresis, the negatively charged fraction was found to be lower in fluorescence quantum yield but higher in optical absorptivity, whereas positively charged and neutral fractions were of higher fluorescence quantum yields.100
Altering the chemical structure and/or composition in carbon dots has been a promising approach for property enhancements. In an early study, Sun et al. doped the core carbon nanoparticle surface with inorganic salts (ZnO, ZnS, or TiO2) before the chemical functionalization.22 The doped carbon dots (denoted as CZnO-Dots, CZnS-Dots, or CTiO2-Dots) exhibited much brighter fluorescence emissions than those of the dots without any doping. It was argued that the inorganic salts must have augmented the passivation effect when combined with the surface functionalization by organic molecules.22 The as-synthesized samples of the doped carbon dots were apparently mixtures as well, containing dots of close to quantitative fluorescence emissions. In a follow-up study, Anilkumar et al. fractionated the as-prepared sample of CZnS-Dots on a gel column to harvest carbon dots of observed fluorescence quantum yields more than 75% in the green, the spectral region matching well with that covered by green fluorescence proteins.97
Various other doping strategies have been explored.65,77,96,101 For example, Dong et al. prepared nitrogen- and sulfur doped carbon dots for high fluorescence quantum yields.96 The hydrothermal synthesis involved the use of citric acid and L-cysteine as precursors. Chandra et al. synthesized sulfur-doped carbon dots from TMA through pyrolysis in the presence of concentrated H2SO4 and then the isolation and polymerization with excess NH4OH.65,77 Jahan et al. reported B/N co-doped carbon dots with deliberate surface passivation for high fluorescence quantum yields. The synthesis was based on the hydrothermal processing of boric acid and N-(4-hydroxyphenyl)glycine in water.101
As reported originally,9 carbon dots are multicolor in fluorescence emissions. However, the available carbon dots are generally more fluorescent in the green and shorter wavelength regions, which are less desirable for their uses as bioimaging agents.32 Therefore, there has been significant recent effort on manipulating carbon dots for enhanced red and near-IR fluorescence emissions.94,102,103 For example, Bhunia et al. reported the hydrothermal synthesis of carbon dots from carbohydrate precursor for enhanced red fluorescence.94 Somewhat unusual, however, was the use of UV excitation for red emissions.
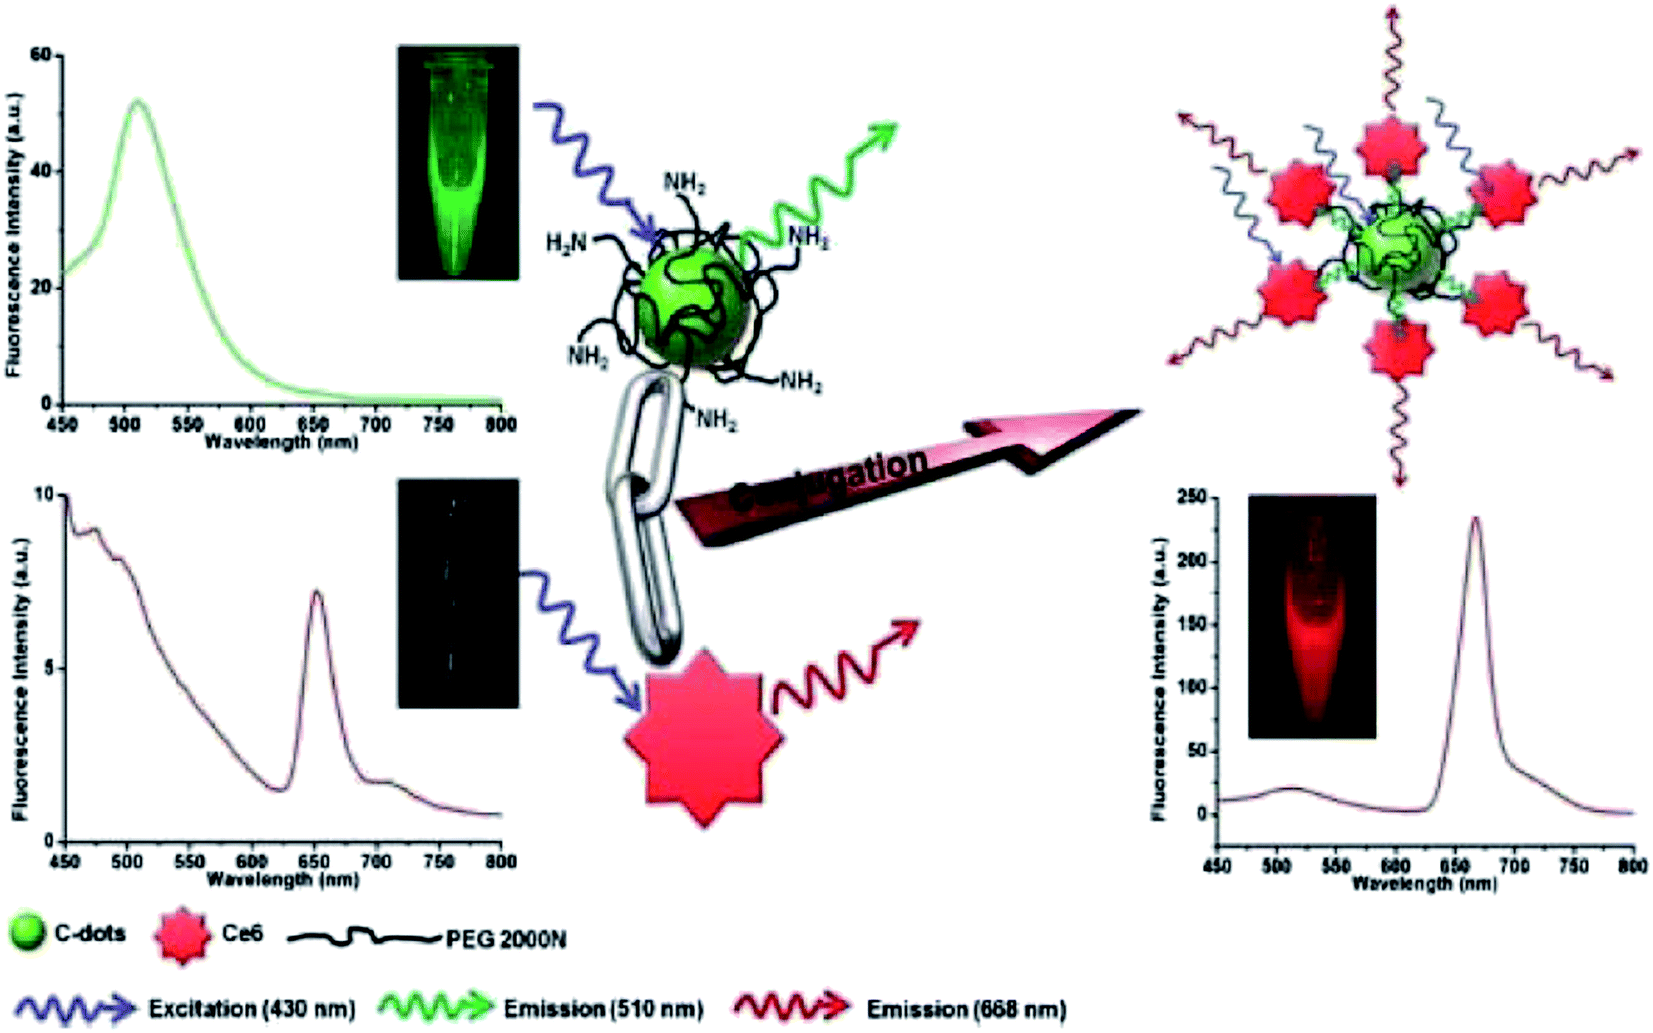
Huang et al. reported a different strategy to achieve longer-wavelength fluorescence emissions by attaching dyes of known red/near-IR fluorescence to carbon dots.102 The selected dye was ZW800 (fluorescent in the near-IR), and it was conjugated to PEG1500N-functionalized carbon dots in terms of the classical coupling chemistry. The ZW800-conjugated carbon dots exhibited bright fluorescence emissions in green and red/near-IR spectral regions. Similarly, Ce6 (chlorin e6)-conjugated carbon dots were prepared, in which the Förster resonance energy transfer (FRET) allowed the excitation at 430 nm to result in red fluorescence emissions (Fig. 5).103
 | ||
| Fig. 5 Förster (fluorescence) resonance energy transfer (FRET) process between carbon dots and Ce6 (from ref. 103). | ||
3. Fluorescence imaging of cells and tissues
There have been a number of studies on the use of carbon dots for fluorescence imaging of cells and tissues, from straightforward cell imaging to specific tissue targeting,39,41,69,81,83,85,93,104–113 and to theranostics for concurrent effects of bioimaging, drug release, and/or photodynamic therapy.75,79,114–116 Explorations on the in vivo imaging with various carbon dots have also been reported by several research groups.87,102,103,117–120Cellular uptake and fluorescence imaging
Carbon dots in most configurations are readily taken by cells, enabling fluorescence imaging of cells with both one- and multiple-photon excitations, as demonstrated in early studies of carbon dots.9,10,48 For more recent examples, Zhang et al. prepared dots from polydopamine (PDA-FONs) for cell imaging. At 405 nm and 458 nm excitations, bright green and yellow fluorescence emissions, respectively, were observed in the cytoplasm, but not in the cell nucleus.104 Yan et al. used carbon dots from cellulose and cyclodextrin via hydrothermal synthesis for cell imaging.41 Upon incubation with mouse melanoma cells (B16-F10) for 5 h, the carbon dots were taken up by the cells with the observation of meaningful blue, yellow, and red fluorescence emissions corresponding to different excitation wavelengths, though the imaging resolution was not high enough for a more precise determination of the locations for the dots.41 Zhang et al. reported the synthesis of aqueous compatible carbon dots in one-pot hydrothermal processing of nanodiamond.105 The carbon dots were internalized into the NIH-3T3 cells upon incubation, with green and yellow fluorescence emissions at 405 nm and 458 nm excitations, respectively, found in the cell cytoplasm.105 Wei et al. prepared carbon dots from paper ash and demonstrated that these dots could be efficiently taken up by human L02 hepatic cells, with rather low cytotoxicity.93In some imaging experiments, carbon dots were also found in the cell membranes. For example, Chen et al. prepared carbon dots by carbonizing sucrose with oil acid for imaging 16HBE cells. Green fluorescence emissions were observed around the cell membrane, in addition to the cytoplasm, though only much weaker fluorescence was detected in the cell nucleus.83 Zhang et al. used one-pot hydrothermal synthesis with bovine serum albumin (BSA) as the carbon source and 4,7,10-trioxa-1,13-tridecanediamine (TTDDA) as the surface passivation agent to prepare carbon dots for imaging colorectal carcinoma cells (SW1116).39 After incubation for only 3 h, the carbon dots were internalized into the cells, exhibiting blue fluorescence emissions around the cell membrane and cytoplasm region under UV excitation.39 Similarly, Ding et al. applied the hydrothermal synthesis to the preparation of TTDDA-passivated carbon dots.106 These dots were used to label HeLa cells, exhibiting low toxicity effect on the cells even at high concentrations of up to 5 mg mL−1.106
Carbon dots from natural products or more biocompatible precursors were also evaluated in cell imaging experiments. For example, Sahu et al. used carbon dots from orange juice in the imaging of MG-63 cells.69 Blue and green fluorescence emissions at 405 nm and 488 nm excitations, respectively, were observed in the cell cytoplasm, but no fluorescence found in cell nuclei.69 Sachdev et al. applied microwave-assisted pyrolysis to the one-step synthesis of PEG-4000 passivated carbon dots from chitosan.81 The carbon dots were evaluated for their potential bio-labeling uses in reference to S. aureus and recombinant green fluorescent protein (GFP)-expressing E. coli as model systems.81 Saxena et al. isolated water-soluble carbon dots from charred bread for the fluorescence imaging of human red blood cells.85 The carbon dots were found to be relatively nontoxic to the human erythrocytes, and even exhibited higher fluorescence quantum yields in the presence of the blood plasma, which was rationalized as being due to interactions of biomolecules in the blood plasma with the carbon dots.85 Saxena et al. also synthesized carbon dots from wood wool for fluorescence imaging over the full life cycle of different species of mosquitoes (Anopheles sp., Aedes sp. and Culex sp. larvae). The carbon dots at higher concentrations could have growth restriction effects, slowing down the metabolism in the larval stage of mosquitoes, thus preventing their reaching the pupae stage to eventually lead to the death of the mosquitoes (Fig. 6).107
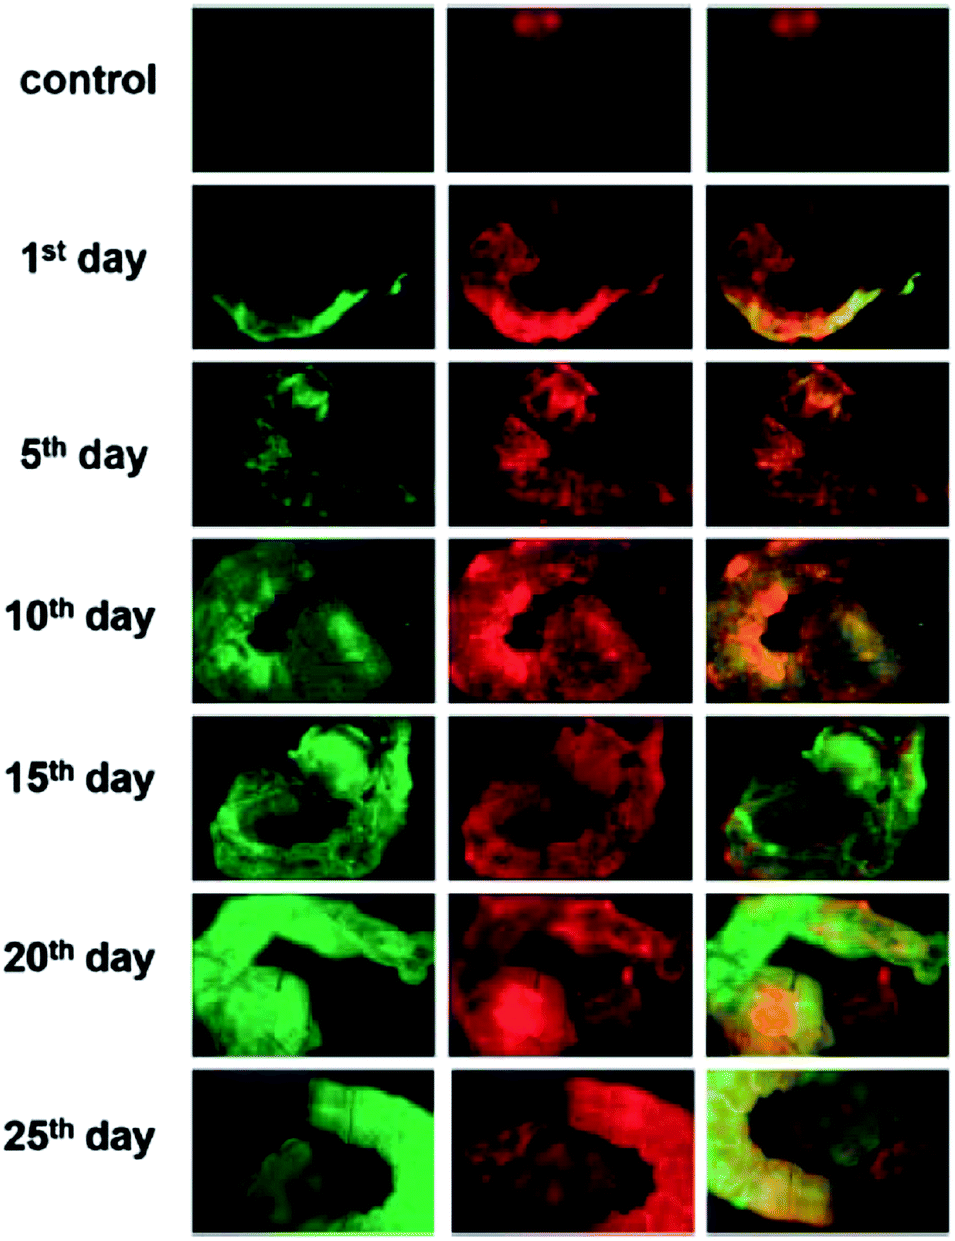 | ||
| Fig. 6 Growing larvae treated with 3.0 mg L−1 water-soluble carbon nanoparticles. The first row represents the auto fluorescence of the control mosquito larvae. The other six rows (from top to bottom) are fluorescence images on the indicated days for treated larvae of Culex sp. Left, middle and right column images are those observed under 488 nm, 561 nm and the merged image of 488/561 nm band pass filters, respectively (reproduced from ref. 107). | ||
Several reports highlighted the use of doped carbon dots for cell imaging. Xu et al. used N-doped carbon dots for the fluorescence labeling of HeLa cells and HepG2 cells. Multicolor fluorescence emissions corresponding to different excitation wavelengths were observed in the cell cytoplasm.108 Chandra et al. prepared sulphur-doped carbon dots from TMA. These dots could be readily dispersed in water, with high photostability. In the imaging of E. coli cells, blue fluorescence emissions were observed at 405 nm excitation. The negatively charged oxygen and sulfur groups in the doped carbon dots could apparently bind with positively charged DNA–PEI complexes, resulting in bright fluorescence.65 Wu et al. synthesized nitrogen-doped amphoteric carbon dots from natural silk (from Bombyx mori), as Bombyx mori silk contains a high percentage of nitrogen. The doped carbon dots were amphoteric, depending on the solution pH, and stable in resisting relatively harsh chemical environments. The use of these dots as probes for the fluorescence imaging of A549 cells was evaluated.73 A549 cells were also used in the study by Qu et al., with carbon dots from dopamine as precursor in the hydrothermal synthesis.109 Beyond cell imaging, the carbon dots were employed in the determination of Fe3+ ions in water samples and dopamine in human urine and serum samples, taking advantage of the distinctive catechol groups on the carbon nanoparticle surface.
With specific targeting
Han et al. used polyethyleneimine-modified carbon dots to examine the fluorescence labeling of HeLa cells. The carbon dots conjugated with the CEA8 antibody could label HeLa cells upon incubation for only 90 min, and the labeling was visualized by the green fluorescence contour of the cell shape. In the control experiment without the CEA8 antibody, carbon dots were not found under UV excitation.110Bhunia et al. applied the carbon dots from the carbonization of carbohydrates to the fluorescence imaging of HeLa cells.94 However, the dots had very low non-specific binding to cells, probably due to their small hydrodynamic sizes and low surface charge. Upon the dots being linked to TAT peptide or folate, their cellular uptake was significantly enhanced, with fluorescence emissions readily detected under a confocal microscope.94
Lee et al. prepared carbon dots with the maleimide-terminated TTA1 aptamer (targeting tenascin C proteins (Tnc) proteins) for the fluorescence imaging of cancer cells.111 Since Tnc proteins are highly expressed in HeLa cells and C6 cells, but rarely expressed in CHO cells, the TTA1–carbon dots were found to be significantly selective to HeLa cells and C6 cells, with only minor up-taking by CHO cells.111
Bioanalyses
Salinas-Castillo et al. prepared carbon dots via the pyrolysis of citric acid in the presence of PEI.30 The carbon dots were highly selective to Cu2+, and could readily be swallowed by NIH-3T3 cells. At 850 nm excitation the observed up-conversion fluorescence in the cells could be quenched partially with the addition of Cu2+, suggesting potential applications of these carbon dots in the intracellular detection of the copper cation.30Kong et al. used carbon dots for two-photon fluorescence imaging and biosensing.112 In the experiments the proton responsive molecule 4′-(aminomethylphenyl)-2,2′:6′,2′′-terpyridine (AE-TPY) was linked to carbon dots to be used as sensors for monitoring pH variations. At a lower pH, AE-TPY could bind with proton, resulting in stronger two-photon fluorescence in the carbon dots. Upon the incubation of the conjugates with A549 cells, fluorescence emissions from the carbon dots could be detected in the perinuclear regions of the cells. With the addition of choline CH3SO3-Ringer's solution to increase cellular cytosolic Na+, the intracellular pH decreased, accompanied by significantly increased fluorescence intensities. Then, the addition of 100 mM Na+ led to increased pH, thus lower fluorescence intensities. The utility of carbon dots as pH sensors was also demonstrated in A549 cancer cell tissue. The fluorescence intensities sharply increased when the pH was decreased from 7.8 to 6.4. In addition, the 3D two-photon fluorescence imaging of carbon dots was used to reveal the pH gradients over the depth of 65–185 μm in tissue.112
Shen et al. also used pH-sensitive carbon dots for cell imaging. Upon incubation with HeLa cells, the carbon dots could readily penetrate the cell membrane, with low cytotoxicity and favorable biocompatibility to stain the whole cells.113
Theranostics
There have been a number of reports on using carbon dots for theranostics to achieve the concurrent effects of bioimaging, drug release, photodynamic therapy, antimicrobial, and/or transfection.12 For example, Lai et al. prepared carbon dots from glycerol inside mesoporous silica nanoparticles for both fluorescence imaging and drug release.79 The carbon dots–SiO2 nanoparticles were further capped with PEG molecules to enhance the fluorescence brightness, stability, and biocompatibility. These PEGylated carbon dots–SiO2 nanoparticles were able to deliver the anticancer drug doxorubicin (DOX) into HeLa cells, exhibiting improved efficacy than that of free DOX. The fluorescence imaging was performed at different incubation times for the nanoparticles with HeLa cells. At 2 h incubation, most DOX was co-localized with carbon dots, as indicated by the purple fluorescence (a mixture of red from DOX and green from carbon dots); and at 24 h, red fluorescence due to DOX was found in the cell nuclei, while green fluorescence from carbon dots remained in the cytoplasm. The release of DOX was more pronounced post 48 h incubation.79In a conceptually similar approach, He et al. encapsulated carbon dots and Si nanoparticles in the mesoporous SiO2 for nanocomposites, denoted as C@Si–SiO2, to be used in fluorescence imaging and drug delivery.114 The C@Si–SiO2 was coated with PEG molecules and linked with targeting moieties hyaluronic acid for enhanced selectivity in the drug delivery. The resulting C@Si–SiO2 conjugate carrying the drug camptothecin (CPT) in MDA-MB-468 cells exhibited yellow fluorescence emissions in the cell cytoplasm. The blue fluorescence due to CPT was found to be shifted from the yellow fluorescence spots, with some blue CPT reached the cell nucleus, suggesting that CPT was released from the C@Si–SiO2 carrier. Consistent with the imaging results, the delivery system with targeting moieties showed specific cytotoxicity (therapeutic effect) toward MDA-MB-468 cells. In control experiments with MCF-7 and L929 cells, to which the conjugate was not targeted, there were only rather weak fluorescence signals in the cells and essentially no cytotoxicity effects.114
Wang et al. prepared hollow carbon dots through solvothermal treatment of BSA protein,75 where the pore size was estimated to be around 2 nm. The drug DOX was loaded onto the dots for both fluorescence imaging and delivery purposes. In A549 cells, the imaging results suggested the co-localization of carbon dots and DOX, with the dots mainly in the cytoplasm and DOX in the cell nuclei.75
Mitra et al. grafted carbon dots to ZnO nanorod (ZCNP) for antibacterial and bioimaging applications.115 The resulting nanohybrid was effectively introduced into S. aureus cell in simple incubation, as observed in the fluorescence imaging under a microscope. The antibacterial efficacy of the nanohybrid was evaluated on S. aureus (Gram-positive) and E. coli (Gram-positive), with the results suggesting high antibacterial activities for both and in a concentration dependent fashion.115
Kim et al. coupled carbon dots with gold nanoparticles for an assembly, which was then conjugated with PEI–pDNA for delivering DNA to cells. Fluorescence emissions from the assembly of carbon dots–gold nanoparticles could be quenched by pDNA, so that the release of pDNA could be probed by the recovery of fluorescence signals. The experimental results suggested that the assembly did enter the cells, with the carbon dots located in the cell cytoplasm and the released pDNA entering the cell nuclei, achieving significant transfection efficiency (Fig. 7).116 Pandey et al. used carbon dots to functionalize gold nanorod for the delivery of doxorubicin in a multi-modality fashion, including the drug delivery, photothermal therapy, and bioimaging on the same platform.117
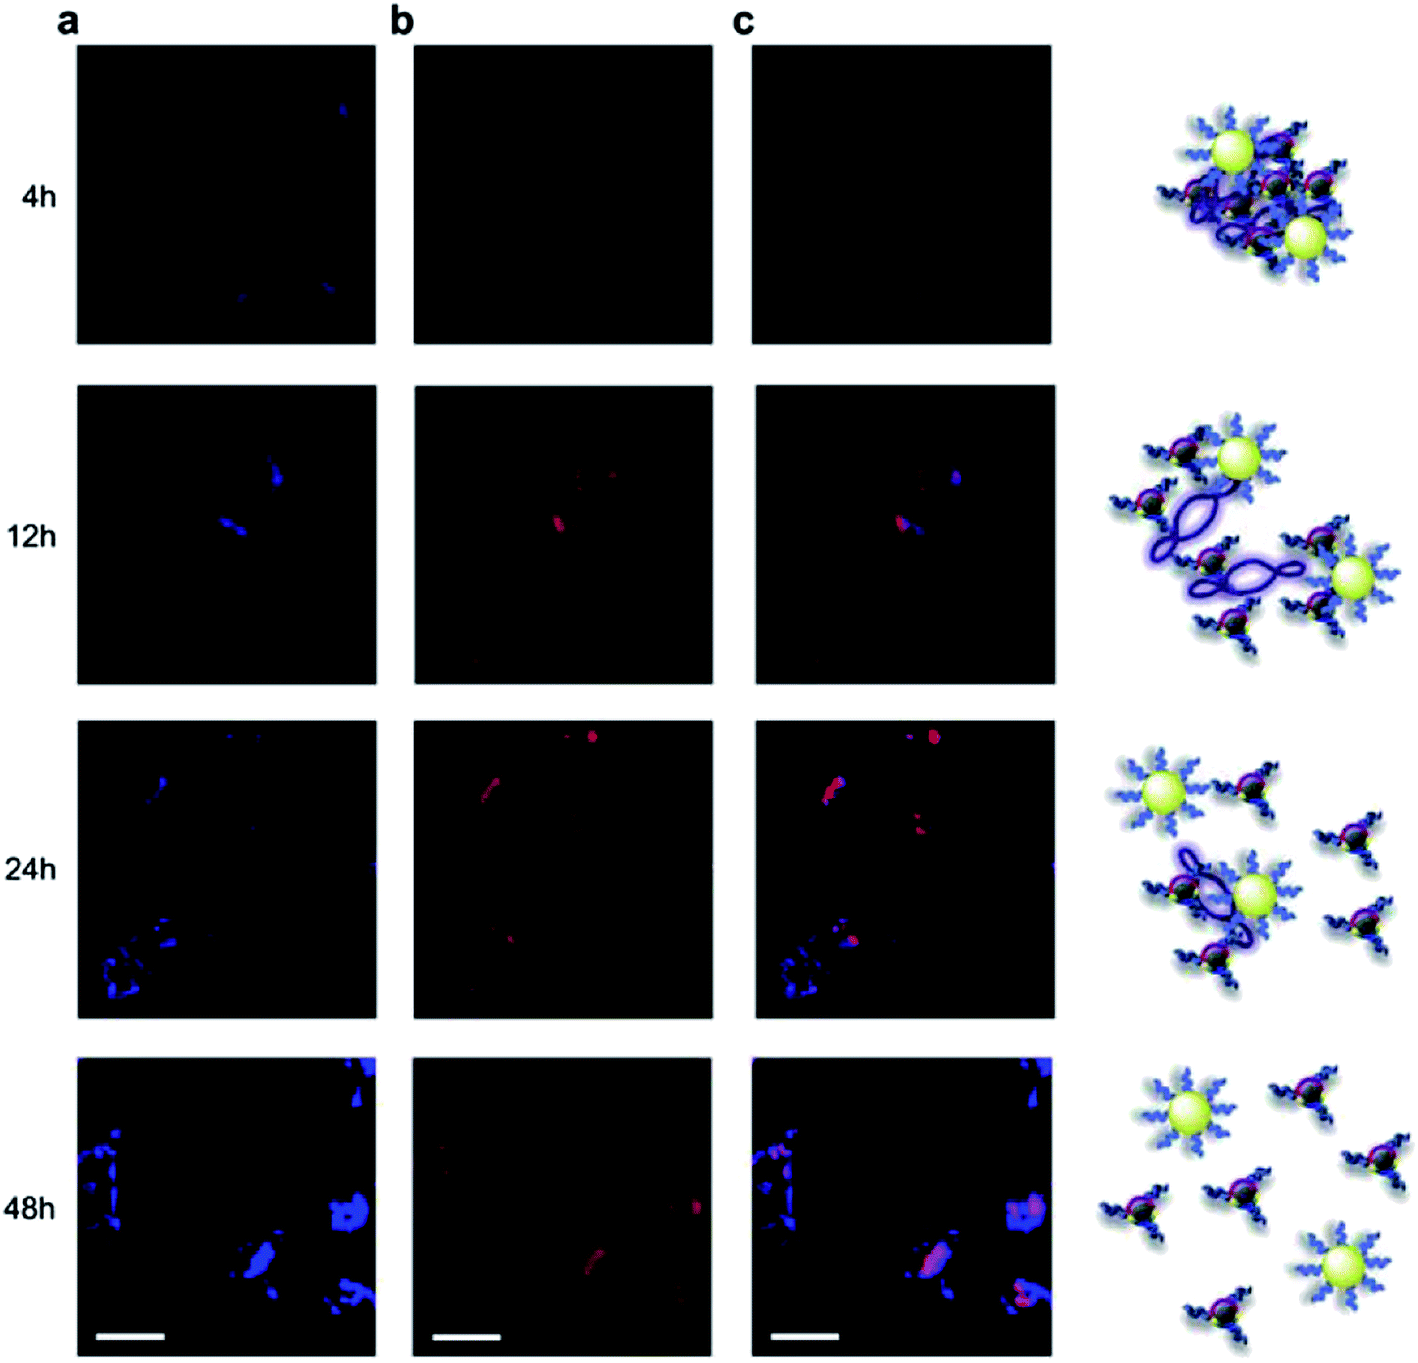 | ||
| Fig. 7 Cellular imaging of carbon dots–PEI/Au–PEI/pDNA assembly in HeLa cells. (a) Fluorescence of carbon dots–PEI (blue), (b) TOTO-iodide labeled pDNA (red), and (c) merged image at different time interval (from ref. 116). | ||
Fluorescence imaging in vivo
Carbon dots were demonstrated in earlier studies as being applicable to fluorescence imaging in vivo.11,118,119 Recent efforts have confirmed or extended the application potential. For example, Wu et al. used carbon dots from honey for in vivo imaging experiments in a mouse model, from which the results showed high contrast enhancement in auxiliary lymph node.87 As pointed by the authors, the rapid lymphatic transport of these dots might be a valuable property, offering greater convenience and reduced procedural expense, as well as improved surgical advantage as the subject is positioned on the table for easier resection.87Li et al. investigated the cellular uptake and biodistribution of carbon dots for optical imaging.120 The co-localization of carbon dots (blue fluorescence) and fluorescent markers (red fluorescence) was used to probe various cellular organelles, including lysosome/endosome, Golgi body, mitochondria, and endoplasmic reticulum. The results suggested that the carbon dots were largely trapped in lysosome/endosome, though their presence in Golgi body, mitochondria, and endoplasmic reticulum was also observed. For the imaging in vivo, the carbon dots were introduced into mice through intravenous injection. Organs were harvested and sliced for fluorescence imaging at 500 nm emission with 405 nm excitation. Blue fluorescence was observed in heart, liver, spleen, kidneys, lungs, brain, and small intestine, with the brightest being in the spleen sample.120
Srivastava et al. fabricated iron oxide-doped carbogenic nanocomposite (IO–CNC) for multi-modality (magnetic resonance (MR)/fluorescence) bioimaging. The IO–CNC preparation was the thermal decomposition of organic precursors in the presence of small Fe3O4 nanoparticles (average size 6 nm). The IO–CNC could be taken by RAW264.7 cells, and the fluorescence was mainly detected in the cell cytoplasm. For the imaging in vivo, the IO–CNC was introduced into rats through intravenous injection. Fluorescence signals due to the IO–CNC were observed in the spleen slide samples. The MRI imaging results suggested enhanced signals in the brain blood vessel under both T1 and T2 models (Fig. 8).121
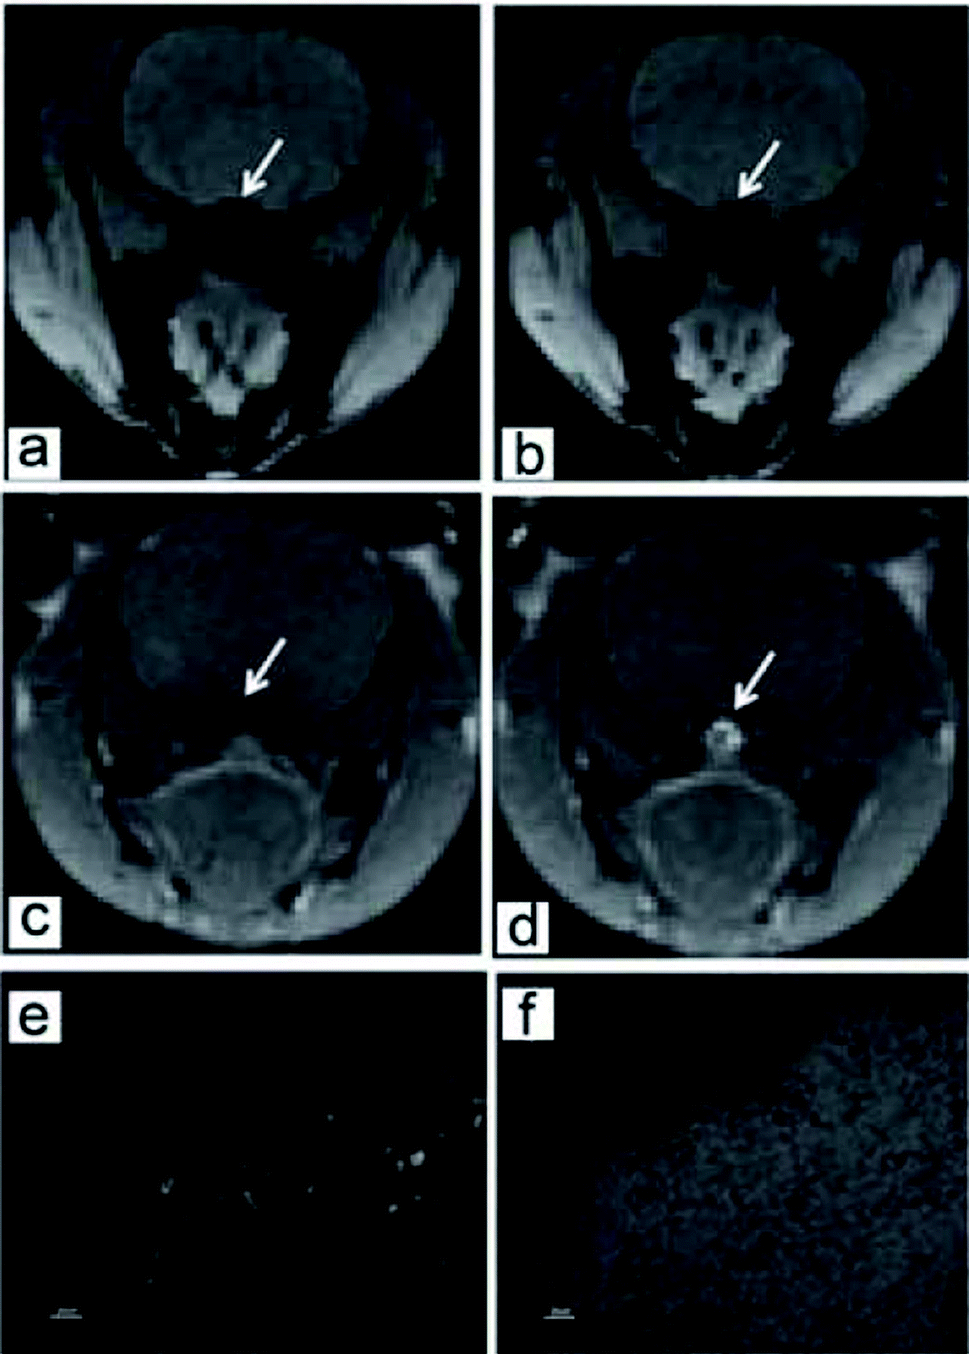 | ||
| Fig. 8 T2 (a and b) and T1 (c and d) images of magnetic carbon dots in rat brain before (a and c) and after (b and d) the injection. Fluorescence image (e) and white field (f) of rat spleen after the injection of magnetic carbon dots (from ref. 121). | ||
Huang et al. extended the spectral range of carbon dots to red/near-IR by attaching the fluorescence dye ZW800 to the dots.102 These red/near-IR fluorescent dots were tracked ex vivo and in vivo for their biodistribution, excretion, and passive tumor uptake by using both near-IR fluorescence and positron emission tomography imaging techniques. The carbon dots were efficiently and rapidly excreted from the body after injection in different routes. Their blood clearance was quick, only one hour post intravenous injection. The retention times were somewhat longer after subcutaneous and intramuscular injections. The carbon dots were slightly trapped in liver, spleen, and lungs at one hour post intravenous injection. Very bright fluorescence was observed in kidneys. No meaningful fluorescence was detected in aforementioned samples after 24 h. The urine accumulation followed the sequence of intravenous > intramuscular > subcutaneous injection routes. For the three injection models, tumor uptakes of the carbon dots were also found (Fig. 9).102 In a related study, Huang et al. attached the fluorescence dye Ce6 to carbon dots to impart red fluorescence emissions through FRET. Indeed, the conjugate of Ce6–carbon dots could be excited at 430 nm for red fluorescence emissions (668 nm). For imaging and photodynamic therapy, the conjugate could be swallowed by cells, and under laser irradiation the cell death was observed. After intravenous injection, the accumulation of the conjugate in tumor was detected. As a result probably, the laser treatment of the mice exposed to the conjugate of Ce6–carbon dots significantly inhibited the tumor growth.103
 | ||
| Fig. 9 Tumor uptake of ZW800–carbon dots after different routes of injection. (A) NIR fluorescence images of SCC-7 tumor-bearing mice acquired at 2, 4, 6, and 24 h post-injection: control (without injection); iv injection; sc injection; im injection (white arrow indicates tumor; red arrow indicates kidney). (B) Tumor region of interest analysis. Fluorescence signal unit: ×108 photons per cm2 per s1. (C) Ex vivo fluorescence images derived from the emission of carbon dots and ZW800 were acquired to confirm tumor uptake of particles (from ref. 102). | ||
4. Graphene quantum dots for bioimaging
More recently, fluorescent GQDs have attracted great interest.21,122–127 As carbon-based nanomaterials, GQDs share some spectroscopic and other characteristics with carbon dots. In fact, Cao et al. pointed out that GQDs commonly referred to in the literature could be understood in two separate yet related categories, with their corresponding fluorescence emissions due to bandgap transitions in isolated π-domains (or often called “sp2 islands”) or structural defects.21 However, the creation of sp2 islands is typically facilitated or accompanied by defects, especially for the fact that the defect-derived fluorescence is strong, so that the observed fluorescence emissions in GQDs are either dominated by or substantially contaminated with defect-related contributions. It led the conclusion that “it is all about defects” (Fig. 10),21 with the notion that a GQD may be considered to a significant extent as a two-dimensional collection of multiple carbon dots.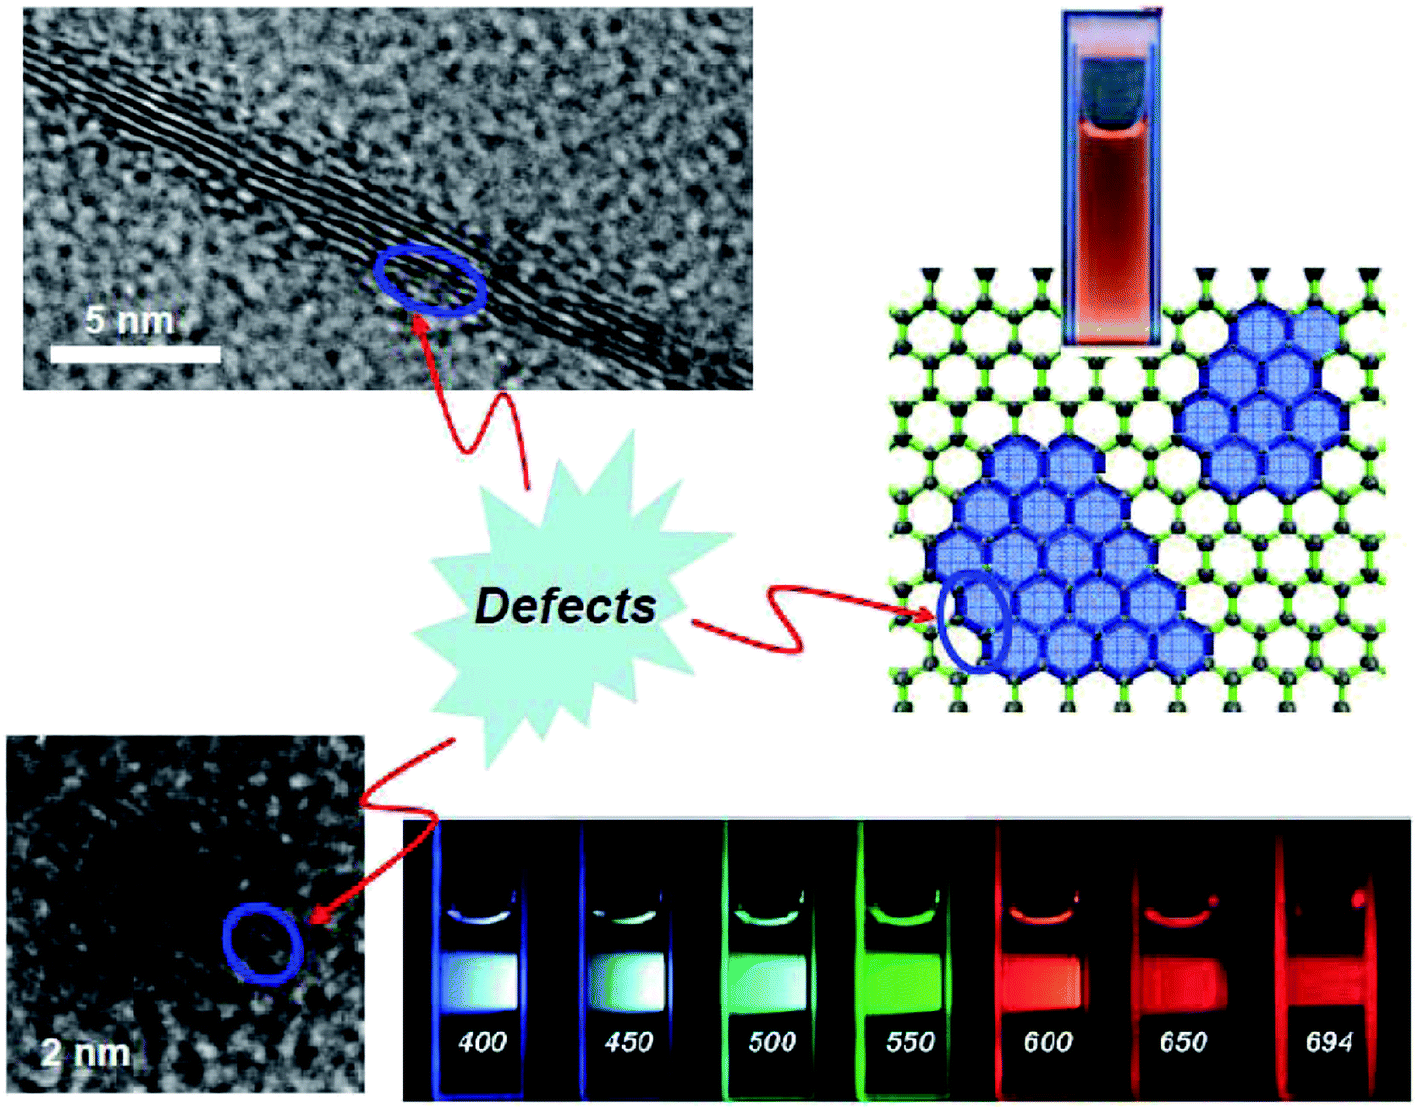 | ||
| Fig. 10 Top: (right) isolated sp2 islands in a graphene sheet and a photo showing the associated bandgap fluorescence in solution, and (left) a multiple-layer graphene piece with defects. Bottom: (left) a carbon nanoparticle with surface defects, and (right) fluorescence emission color variations in carbon dots (from ref. 21). | ||
GQDs were mostly prepared from graphene oxides (GOs),122–125 for which hydrothermal processing was widely adopted.124,125 In some cases, the as-processed sheets were reduced to further enhance the fluorescence, and more significant enhancements were achieved through the passivation of GQDs by polymers and other species.126,127 The functionalization chemistry was also used to alter the fluorescence colors of GQDs.128,129 In the work by Zhu et al., for example, GQDs were grafted with alkylamines, in comparison with those reduced by NaBH4. Fluorescence colors in the former were different from those in the latter, despite their similar sizes (Fig. 11).128
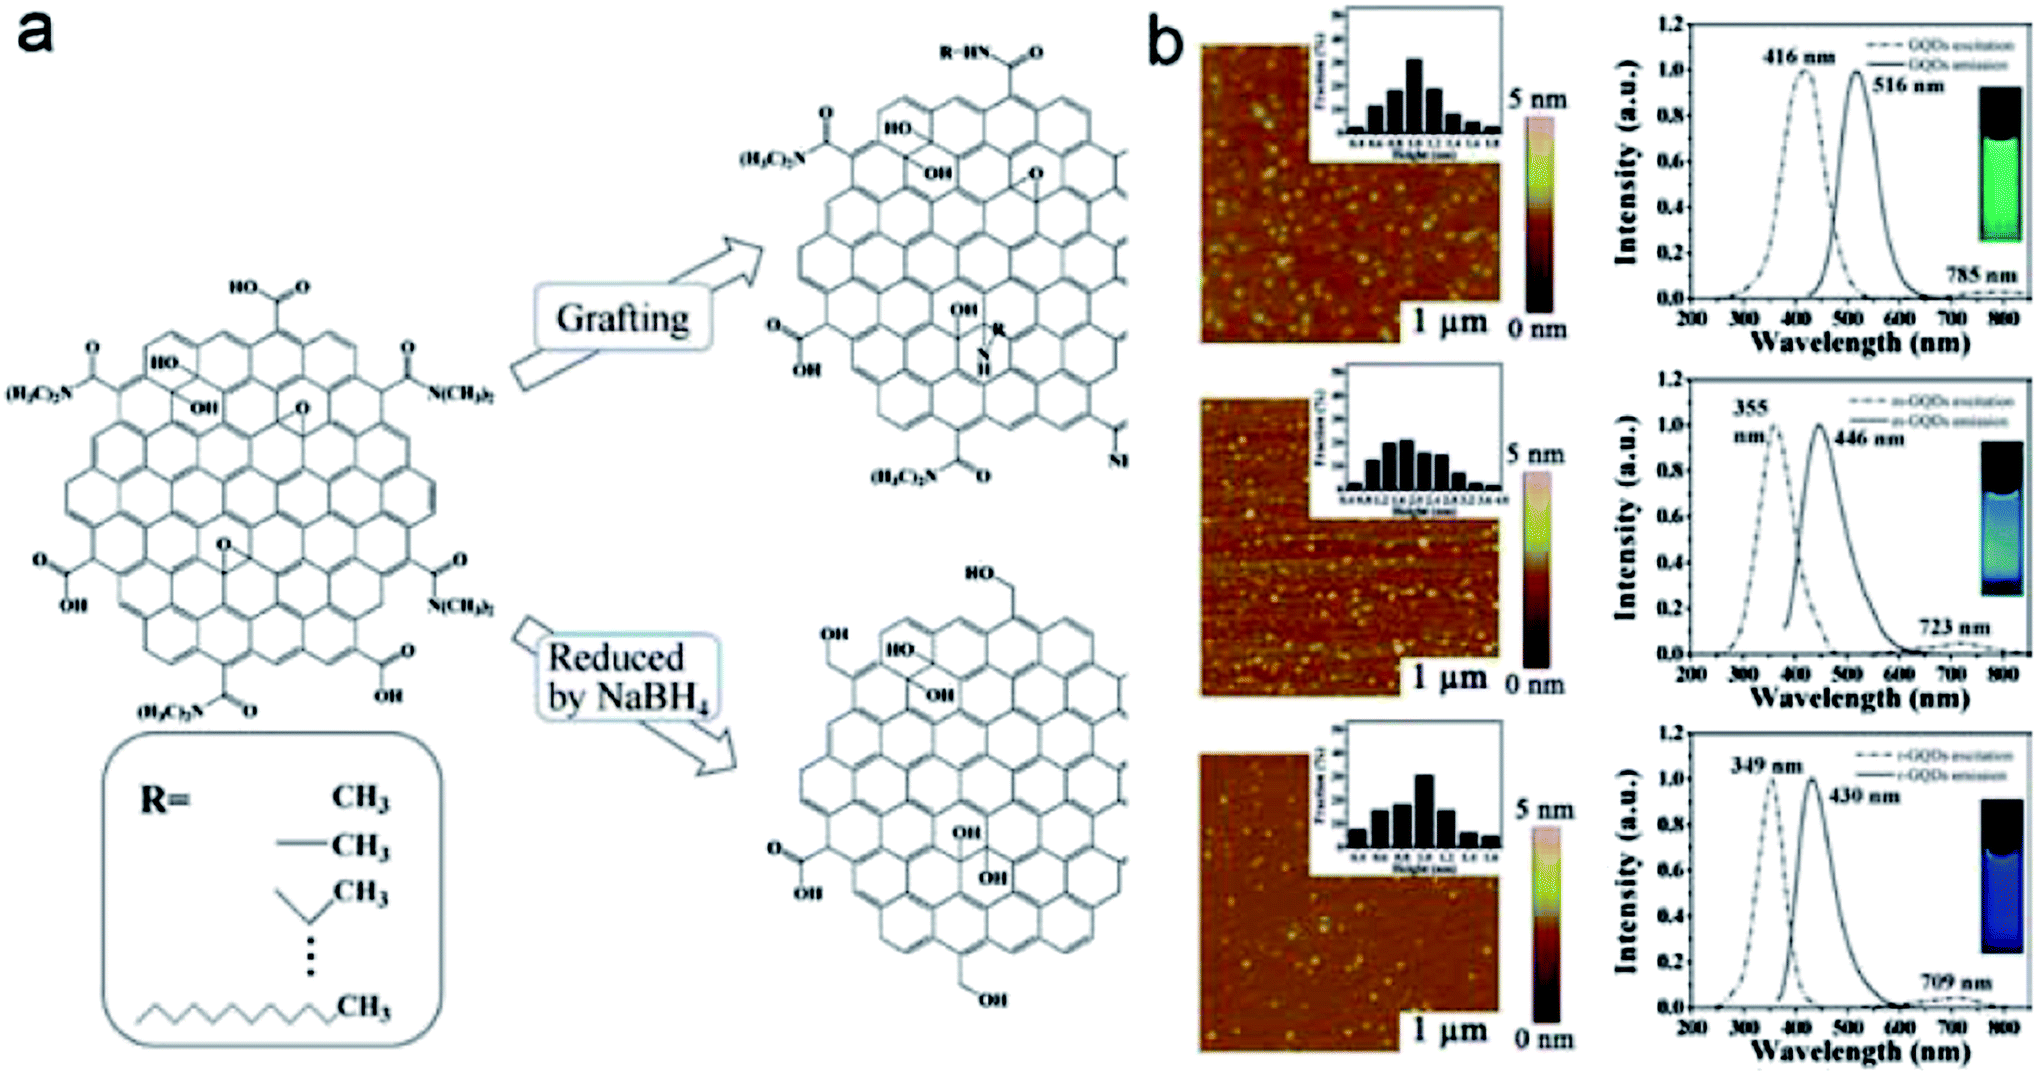 | ||
| Fig. 11 (a) Preparation routes of GQDs with different functionalizations. (b) AFM images (left) and FL spectra (right) of GQDs (from ref. 128). | ||
Bottom-up methods were also developed for the preparation of GQDs.130–132 For example, Liu et al. used hexa-peri-hexabenzocoronene (HBC) to synthesize GQDs,130 where HBC pieces were stacked and converted into graphite, followed by oxidization and functionalization. The resulting GQDs exhibited similar fluorescence characteristics to those found in carbon dots. Shen et al. functionalized GO-derived GQDs with PEG1500N, then the reduction with N2H4, and found significant upconversion fluorescence.18
GQDs were applied to fluorescence imaging of cells and tissues in a conceptually similar fashion to that with carbon dots highlighted above. For example, Zhu et al. reported that MG-63 cells could be labeled by GQDs, with green or yellow fluorescence emissions found in the cytoplasm at 405 nm or 488 nm excitation, respectively.133 The same group also used functionalized GQDs for cell imaging under upconversion fluorescence conditions.128 The results again suggested that the dots were localized in the cytoplasm of MC3T3 cells.
Peng et al. prepared GQDs from carbon fibers for imaging human breast cancer cell T47D.134 Upon the incubation for 4 h, agglomerated green GQDs were found to be surrounding each cell nucleus. Sun et al. used chemically and photochemically reduced GQDs to label A549 cells.135 Blue fluorescence was observed around the cell nucleus at 380 nm excitation. Zhang et al. also reported that GQDs were localized in the cell cytoplasm in the fluorescence imaging of HeLa cells.136
Hu et al. prepared N-doped GQDs by hydrothermal treatment of GOs in the presence of ammonia for the imaging of HeLa cells. The N–GQDs were again trapped in the cell cytoplasm, with bright green fluorescence emissions observed at 405 nm excitation.137 Pan et al. cut graphene into GQDs for cell imaging, and found that the GQDs were trapped in the nuclei of HeLa cells after 2 h incubation.138
Xie et al. used GQDs from the electrolysis of graphite in basic aqueous solution and then hydrazine hydrate reduction for imaging MCF-7 and A549 cells.139 Based on the observed yellow fluorescence emissions, GQDs readily entered the cells and localized in the cell cytoplasm, without significant attachment on the cell membrane. The same group also used the GQDs for the imaging of stem cells, including neurospheres cells (NSCs), and progenitor cells of pancreas and cardiac. The NSCs were visible as spheres consisting of a large nucleus surrounded by a small volume cytoplasm. No fluorescence was found in the cell nucleus. For progenitor cells of pancreas and cardiac, the fluorescence of GQDs was also found only in the cytoplasm.140
Nurunnabi et al. prepared fluorescent nanoparticles similar to GQDs for imaging in vivo. The nanoparticles were introduced into nude mice through intravenous injection, with fluorescence emissions observed in the entire body 30 min post-injection. The fluorescence intensities remained for about 8 h, and decreased slowly to become very weak after 16 h. The results of ex vivo imaging clearly showed the accumulation of the nanoparticles in liver, kidneys and spleen at 4 h post-exposure. Weak signals were also detected in heart and lungs. At 16 h post-exposure, the accumulation level decreased dramatically (Fig. 12).141
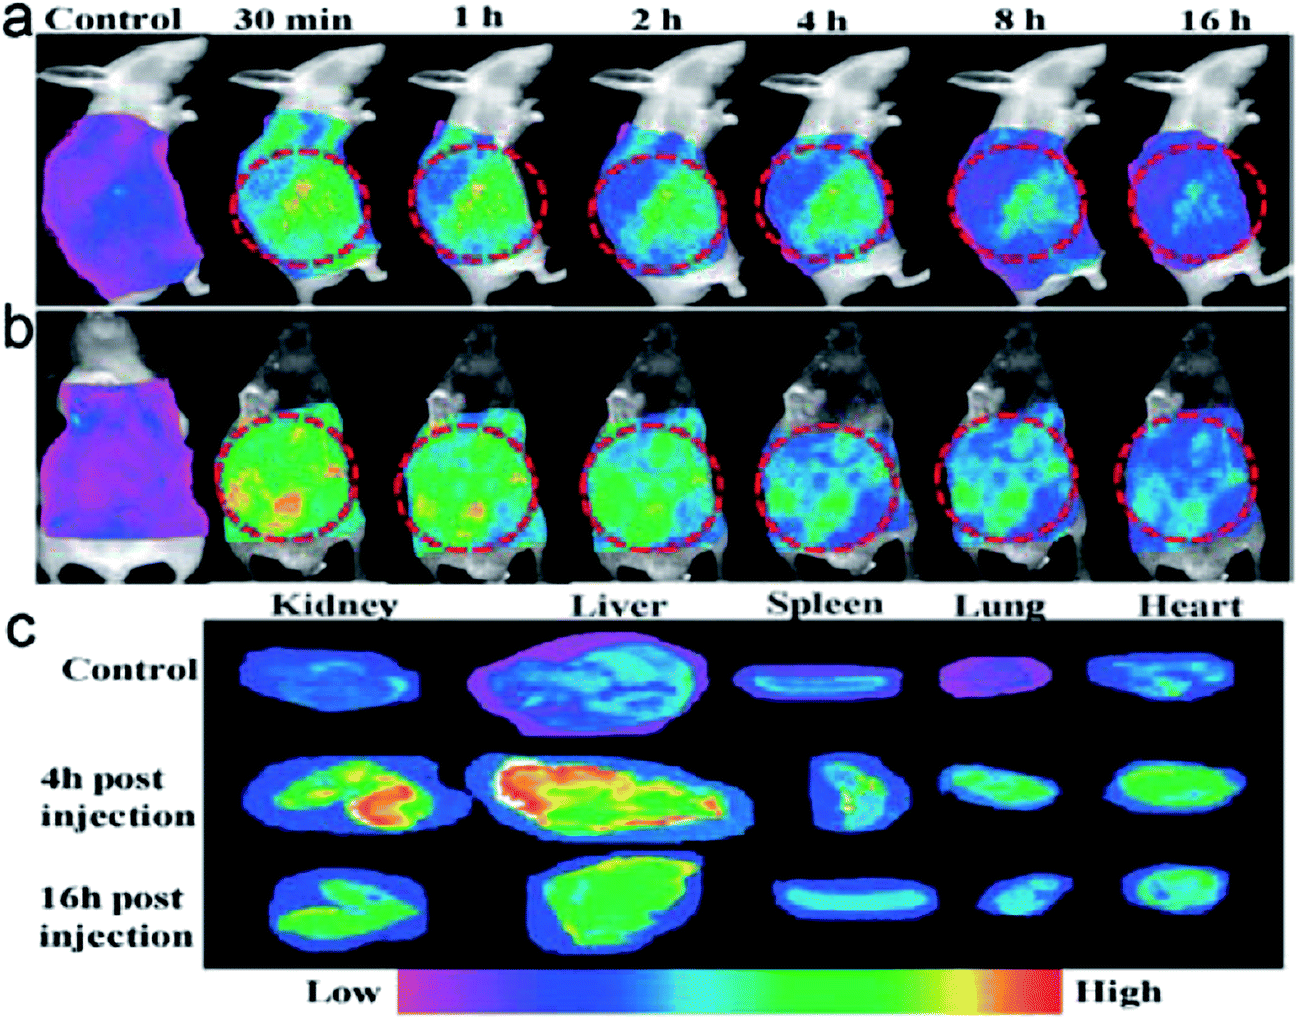 | ||
| Fig. 12 (a) Side and (b) front views of mice after intravenous injection of GQDs, and (c) ex vivo images of dissected organs (reproduced from ref. 141). | ||
Markovic et al. evaluated the potential of GQDs for photodynamic therapy.142 According to the fluorescence imaging results, the GQDs were localized in the cytoplasm of U251 cells, consistent with the results of TEM and FACS. The photoexcitation of the GQDs induced autophagy, suggesting phototoxicity for potential uses in photodynamic therapy.142
5. Summary and perspective
Just based on the number of recent publications alone, carbon-based QDs have clearly become a new class of optical nanomaterials that compete with conventional semiconductor QDs for popularity, promising potentially competitive, performance-wise, yet nontoxic fluorescence bioimaging agents. There has also been growing evidence suggesting the critical role of defects in carbon dots and GQDs dictating their observed fluorescence properties and photoinduced processes in general, despite the fact that GQDs were originally pursued as a collection of isolated π domains on a single-layer graphene sheet. Consequently, carbon dots in which defects in the carbon nanostructure are obviously most abundant may serve to represent the majority of the GQDs and other fluorescent carbon nanomaterials of QD-like characteristics phenomenologically and mechanistically.For fluorescence imaging of cells and tissues, carbon dots are advantageous in terms of their ready aqueous solubility, physicochemical and photochemical stabilities, high optical performance and non-blinking, and more importantly excellent biocompatibility. A further proliferation of investigations on potential bio-applications of carbon dots in imaging and beyond may be expected. For carbon dots of enhanced performance, new and possibly unconventional approaches may be explored for the synthesis of carbon dots with bright fluorescence emissions emphasized in the red/near-IR spectral regions, thus more effective in tissue penetration and reducing the interference from background fluorescence. This may represent a major challenge for the future scope of research in both the further development (including mechanistic elucidation) and application of carbon dots as a new class of fluorescence bioimaging agents. Also in need are brightly fluorescent carbon dots of various sizes, shapes, and surface functionalities, including specific targeting moieties, for live cell imaging at high resolution. More studies on the use of carbon-based QDs as a platform for dual- or multi-modality bioimaging agents are desired and expected.
Acknowledgements
Financial support from the U.S. National Science Foundation (0967423, Y.-P.S.), the U.S. Department of Agriculture (2014-67017-21706, L.Y. and Y.-P.S.), and the National Science Foundation of China (21307101, S.-T.Y.) is gratefully acknowledged. Y.L. was on leave with a visiting scholarship from the Technical Institute of Physics and Chemistry, Chinese Academy of Sciences.References
- A. P. Alivisatos, Science, 1996, 271, 933–937 CAS.
- R. Rossetii and L. Brus, J. Phys. Chem., 1982, 86, 4470–4472 CrossRef.
- M. G. Bawendi, M. L. Steigerwald and L. E. Brus, Annu. Rev. Phys. Chem., 1990, 41, 477–496 CrossRef CAS.
- M. Bruchez Jr, M. Moronne, P. Gin, S. Weiss and A. P. Alivisatos, Science, 1998, 281, 2013–2016 CrossRef CAS.
- W. C. W. Chan and S. Nie, Science, 1998, 281, 2016–2018 CrossRef CAS.
- J. K. Jaiswal and S. M. Simon, Trends Cell Biol., 2004, 14, 497–504 CrossRef CAS PubMed.
- X. Michalet, F. F. Pinaud, L. A. Bentolila, J. M. Tsay, S. Doose, J. J. Li, G. Sundaresan, A. M. Wu, S. S. Gambhir and S. Weiss, Science, 2005, 307, 538–544 CrossRef CAS PubMed.
- U. Resch-Genger, M. Grabolle and S. Cavliere-Jaricot, Nat. Methods, 2008, 5, 763–775 CrossRef CAS PubMed.
- Y.-P. Sun, B. Zhou, Y. Lin, W. Wang, K. A. S. Fernando, P. Pathak, M. J. Meziani, B. A. Harruff, X. Wang, H. Wang, P. G. Luo, H. Yang, M. E. Kose, B. Chen, L. M. Veca and S.-Y. Xie, J. Am. Chem. Soc., 2006, 128, 7756–7757 CrossRef CAS PubMed.
- L. Cao, X. Wang, M. J. Meziani, F. Lu, H. Wang, P. G. Luo, Y. Lin, B. A. Harruff, L. M. Veca, D. Murray, S.-Y. Xie and Y.-P. Sun, J. Am. Chem. Soc., 2007, 129, 11318–11319 CrossRef CAS PubMed.
- S.-T. Yang, L. Cao, P. G. Luo, F. Lu, X. Wang, H. Wang, M. J. Meziani, Y. Liu, G. Qi and Y.-P. Sun, J. Am. Chem. Soc., 2009, 131, 11308–11309 CrossRef CAS PubMed.
- P. G. Luo, S. Sahu, S.-T. Yang, S. K. Sonkar, J. Wang, H. Wang, G. E. LeCroy, L. Cao and Y.-P. Sun, J. Mater. Chem. B, 2013, 1, 2116–2127 RSC.
- X. Gao, Y. Cui, R. M. Levenson, L. W. K. Chung and S. Nie, Nat. Biotechnol., 2004, 22, 969–976 CrossRef CAS PubMed.
- R. A. Hardman, Environ. Health Perspect., 2006, 114, 165–172 CrossRef.
- J. Geys, A. Nemmar, E. Verbeken, E. Smolders, M. Ratoi, M. F. Hoylaerts, B. Nemery and P. H. M. Hoet, Environ. Health Perspect., 2008, 116, 1607–1613 CrossRef CAS PubMed.
- D. Pan, J. Zhang, Z. Li and M. Wu, Adv. Mater., 2010, 22, 734–738 CrossRef CAS PubMed.
- L. Li, G. Wu, G. Yang, J. Peng, J. Zhao and J.-J. Zhu, Nanoscale, 2013, 5, 4015–4039 RSC.
- J. Shen, Y. Zhu, C. Chen, X. Yang and C. Li, Chem. Commun., 2011, 47, 2580–2582 RSC.
- J. Shen, Y. Zhu, X. Yang, J. Zong, J. Zhang and C. Li, New J. Chem., 2012, 36, 97–101 RSC.
- G. Eda, Y. Y. Lin, C. Mattevi, H. Yamaguchi, H.-A. Chen, I.-S. Chen, C.-W. Chen and M. Chhowalla, Adv. Mater., 2010, 22, 505–509 CrossRef CAS PubMed.
- L. Cao, M. J. Meziani, S. Sahu and Y.-P. Sun, Acc. Chem. Res., 2013, 46, 171–180 CrossRef CAS PubMed.
- Y.-P. Sun, X. Wang, F. Lu, L. Cao, M. J. Meziani, P. G. Luo, L. Gu and L. M. Veca, J. Phys. Chem. C, 2008, 112, 18295–18298 CAS.
- Y. Dong, R. Wang, G. Li, C. Chen, Y. Chi and G. Chen, Anal. Chem., 2012, 84, 6220–6224 CrossRef CAS PubMed.
- H. Li, Z. Kang, Y. Liu and S.-T. Lee, J. Mater. Chem., 2012, 22, 24230–24253 RSC.
- Z. Lin, W. Xue, H. Chen and J.-M. Lin, Anal. Chem., 2011, 83, 8245–8251 CrossRef CAS PubMed.
- C.-I. Wang, A. P. Periasamy and H.-T. Chang, Anal. Chem., 2013, 85, 3263–3270 CrossRef CAS PubMed.
- J. E. Riggs, Z. Guo, D. L. Carroll and Y.-P. Sun, J. Am. Chem. Soc., 2000, 122, 5879–5880 CrossRef CAS.
- Y.-P. Sun, K. Fu, Y. Lin and W. Huang, Acc. Chem. Res., 2002, 35, 1096–1104 CrossRef CAS PubMed.
- Y. Lin, B. Zhou, R. B. Martin, K. B. Henbest, B. A. Harruff, J. E. Riggs, Z. X. Guo, L. F. Allard and Y.-P. Sun, J. Phys. Chem. B, 2005, 109, 14779–14782 CrossRef CAS PubMed.
- A. Salinas-Castillo, A.-A. Maria, P. Christian, C.-R. Maria, F. Belen, J. R.-R. Maria, M.-F. Alicia, L.-F. Alejandro, S.-G. Francisco, S.-F. Annelies and F. C.-V. Luis, Chem. Commun., 2013, 49, 1103–1105 RSC.
- W. F. Zhang, H. Zhu, S. F. Yu and H. Y. Yang, Adv. Mater., 2012, 24, 2263–2267 CrossRef CAS PubMed.
- J.-H. Liu, S.-T. Yang, X. Chen and H. Wang, Curr. Drug Metab., 2012, 13, 1046–1056 CrossRef CAS.
- C. Fowley, N. Nomikou, A. P. McHale, B. McCaughan and J. F. Callan, Chem. Commun., 2013, 49, 8934–8936 RSC.
- J. C. G. E. da Silva and H. M. R. Gonçalves, Trends Anal. Chem., 2011, 30, 1327–1336 CrossRef PubMed.
- L. Cao, S. Sahu, P. Anilkumar, C. E. Bunker, J. A. Xu, K. A. S. Fernando, P. Wang, E. A. Guliants, K. N. Tackett II and Y.-P. Sun, J. Am. Chem. Soc., 2011, 133, 4754–4757 CrossRef CAS PubMed.
- S.-T. Yang, X. Wang, H. Wang, F. Lu, P. G. Luo, L. Cao, M. J. Meziani, J.-H. Liu, Y. Liu, M. Chen, Y. Huang and Y.-P. Sun, J. Phys. Chem. C, 2009, 113, 18110–18114 CAS.
- Y. Dong, N. Zhou, X. Lin, J. Lin, Y. Chi and G. Chen, Chem. Mater., 2010, 22, 5895–5899 CrossRef CAS.
- Z. A. Qiao, Y. F. Wang, Y. Gao, H. W. Li, T. Y. Dai, Y. L. Liu and Q. S. Huo, Chem. Commun., 2010, 46, 8812–8814 RSC.
- Z. Zhang, J. Hao, J. Zhang, B. Zhang and J. Tang, RSC Adv., 2012, 2, 8599–8601 RSC.
- X. Zhai, P. Zhang, C. Liu, T. Bai, W. Li, L. Dai and W. Liu, Chem. Commun., 2012, 48, 7955–7957 RSC.
- H. Yan, M. Tan, D. Zhang, F. Cheng, H. Wu, M. Fan, X. Ma and J. Wang, Talanta, 2013, 108, 59–65 CrossRef CAS PubMed.
- H. Liu, T. Ye and C. Mao, Angew. Chem., Int. Ed., 2007, 46, 6473–6475 CrossRef CAS PubMed.
- J. Zhou, C. Booker, R. Li, X. Zhou, T.-K. Sham, X. Sun and Z. Ding, J. Am. Chem. Soc., 2007, 129, 744–745 CrossRef CAS PubMed.
- S. C. Ray, A. Saha, N. R. Jana and R. Sarkar, J. Phys. Chem. C, 2009, 113, 18546–18551 CAS.
- L. Cao, P. Anilkumar, X. Wang, J.-H. Liu, S. Sahu, M. J. Meziani, E. Myers and Y.-P. Sun, Can. J. Chem., 2011, 89, 104–109 CrossRef CAS PubMed.
- X. Li, H. Wang, Y. Shimizu, A. Pyatenko, K. Kawaguchi and N. Koshizaki, Chem. Commun., 2011, 47, 932–934 RSC.
- R. Shen, K. Song, H. Liu, Y. Li and H. Liu, ChemPhysChem, 2012, 13, 3549–3555 CrossRef CAS PubMed.
- Y. Wang, P. Anilkumar, L. Cao, J.-H. Liu, P. G. Luo, K. N. Tackett II, S. Sahu, P. Wang, X. Wang and Y.-P. Sun, Exp. Brain Res., 2011, 236, 1231–1238 CAS.
- L. Tian, D. Ghosh, W. Chen, S. Pradhan, X. J. Chang and S. W. Chen, Chem. Mater., 2009, 21, 2803–2809 CrossRef CAS.
- X.-J. Mao, H.-Z. Zheng, Y.-J. Long, J. Du, J.-Y. Hao, L.-L. Wang and D.-B. Zhou, Spectrochim. Acta, Part A, 2010, 75, 553–557 CrossRef PubMed.
- S.-L. Hu, K.-Y. Nie, J. Sun, J. Yang, N.-Q. Zhao and X.-W. Du, J. Mater. Chem., 2009, 19, 484–488 RSC.
- J. Zhang, W. Shen, D. Pan, Z. Zhang, Y. Fang and M. Wu, New J. Chem., 2010, 34, 591–593 RSC.
- H. Goncalves and E. J. da Silva, J. Fluoresc., 2010, 20, 1023–1028 CrossRef PubMed.
- S. Zhu, Q. Meng, L. Wang, J. Zhang, Y. Song, H. Jin, K. Zhang, H. Sun, H. Wang and B. Yang, Angew. Chem., Int. Ed., 2013, 52, 3953–3957 CrossRef CAS PubMed.
- H. Peng and J. Travas-Sejdic, Chem. Mater., 2009, 21, 5563–5565 CrossRef CAS.
- Q.-L. Zhao, Z.-L. Zhang, B. H. Huang, J. Peng, M. Zhang and D. W. Pang, Chem. Commun., 2008, 5116–5118 RSC.
- L. Y. Zheng, Y. W. Chi, Y. Q. Dong, J. P. Lin and B. B. Wang, J. Am. Chem. Soc., 2009, 131, 4564–4565 CrossRef CAS PubMed.
- J. Lu, J. X. Yang, J. Z. Wang, A. L. Lim, S. Wang and K. P. Loh, ACS Nano, 2009, 3, 2367–2375 CrossRef CAS PubMed.
- D. B. Shinde and V. K. Pillai, Chem.–Eur. J., 2012, 18, 12522–12528 CrossRef CAS PubMed.
- Z.-C. Yang, M. Wang, A. M. Yong, S. Y. Wong, X.-H. Zhang, H. Tan, A. Y. Chang, X. Li and J. Wang, Chem. Commun., 2011, 47, 11615–11617 RSC.
- P.-C. Hsu and H.-T. Chang, Chem. Commun., 2012, 48, 3984–3986 RSC.
- A. B. Bourlinos, A. Stassinopoulos, D. Anglos, R. Zboril, M. Karakassides and E. P. Giannelis, Small, 2008, 4, 455–458 CrossRef CAS PubMed.
- A. B. Bourlinos, A. Stassinopoulos, D. Anglos, R. Zboril, V. Georgakilas and E. P. Giannelis, Chem. Mater., 2008, 20, 4539–4541 CrossRef CAS.
- F. Wang, M. Kreiter, B. He, S. Pang and C.-Y. Liu, Chem. Commun., 2010, 46, 3309–3311 RSC.
- S. Chandra, P. Patra, S. H. Pathan, S. Roy, S. Mitra, A. Layek, R. Bhar, P. Pramanik and A. Goswami, J. Mater. Chem. B, 2013, 1, 2375–2382 RSC.
- Y. Yang, D. Wu, S. Han, P. Hu and R. Liu, Chem. Commun., 2013, 49, 4920–4922 RSC.
- M. X. Gao, C. F. Liu, Z. L. Wu, Q. L. Zeng, X. X. Yang, W. B. Wu, Y. F. Li and C. Z. Huang, Chem. Commun., 2013, 49, 8015–8017 RSC.
- J. Jeong, J. Jung, M. Choi, J. W. Kim, S. J. Chung, S. Lim, H. Lee and H. Chung, Adv. Mater., 2012, 24, 1999–2003 CrossRef CAS PubMed.
- S. Sahu, B. Behera, T. K. Maiti and S. Mohapatra, Chem. Commun., 2012, 48, 8835–8837 RSC.
- H. Li, X. He, Y. Liu, H. Huang, S. Lian, S.-T. Lee and Z. Kang, Carbon, 2011, 49, 605–609 CrossRef CAS PubMed.
- A. Jaiswal, S. S. Ghosh and A. Chattopadhyay, Chem. Commun., 2012, 48, 407–409 RSC.
- J. Wang, S. Sahu, S. K. Sonkar, K. N. Tackett II, K. W. Sun, Y. Liu, H. Maimaiti, P. Anilkumar and Y.-P. Sun, RSC Adv., 2013, 3, 15604–15607 RSC.
- Z. L. Wu, P. Zhang, M. X. Gao, C. F. Liu, W. Wang, F. Leng and C. Z. Huang, J. Mater. Chem. B, 2013, 1, 2868–2873 RSC.
- S. S. Wee, Y. H. Ng and S. M. Ng, Talanta, 2013, 116, 71–76 CrossRef CAS PubMed.
- Q. Wang, X. Huang, Y. Long, X. Wang, H. Zhang, R. Zhu, L. Liang, P. Teng and H. Zheng, Carbon, 2013, 59, 192–199 CrossRef CAS PubMed.
- Q. Wang, X. Liu, L. Zhang and Y. Lv, Analyst, 2012, 137, 5392–5397 RSC.
- D. Sun, R. Ban, P.-H. Zhang, G.-H. Wu, J.-R. Zhang and J.-J. Zhu, Carbon, 2013, 64, 424–434 CrossRef CAS PubMed.
- Q. Liang, W. Ma, Y. Shi, Z. Li and X. Yang, Carbon, 2013, 60, 421–428 CrossRef CAS PubMed.
- C.-W. Lai, Y.-H. Hsiao, Y.-K. Peng and P.-T. Chou, J. Mater. Chem., 2012, 22, 14403–14409 RSC.
- C. Liu, P. Zhang, X. Zhai, F. Tian, W. Li, J. Yang, Y. Liu, H. Wang, W. Wang and W. Liu, Biomaterials, 2012, 33, 3604–3613 CrossRef CAS PubMed.
- A. Sachdev, I. Matai, S. U. Kumar, B. Bhushan, P. Dubey and P. Gopinath, RSC Adv., 2013, 3, 16958–16961 RSC.
- Y. H. Yang, J. H. Cui, M. T. Zheng, C. F. Hu, S. Z. Tan, Y. Xiao, Q. Yang and Y. L. Liu, Chem. Commun., 2012, 48, 380–382 RSC.
- B. Chen, F. Li, S. Li, W. Weng, H. Guo, T. Guo, X. Zhang, Y. Chen, T. Huang, X. Hong, S. You, Y. Lin, K. Zeng and S. Chen, Nanoscale, 2013, 5, 1967–1971 RSC.
- B. De and N. Karak, RSC Adv., 2013, 3, 8286–8290 RSC.
- M. Saxena and S. Sabyasachi, Mater. Express, 2013, 3, 201–209 CrossRef CAS PubMed.
- M. Palashuddin Sk, A. Jaiswal, A. Paul, S. S. Ghosh and A. Chattopadhyay, Sci. Rep., 2012, 2, 383 Search PubMed.
- L. Wu, M. Luderer, X. Yang, C. Swain, H. Zhang, K. Nelson, A. J. Stacy, B. Shen, G. M. Lanza and D. Pan, Theranostics, 2013, 3, 677–686 CrossRef CAS PubMed.
- B. Yin, J. Deng, X. Peng, Q. Long, J. Zhao, Q. Lu, Q. Chen, H. Li, H. Tang, Y. Zhang and S. Yao, Analyst, 2013, 138, 6551–6557 RSC.
- M. J. Krysmann, A. Kelarakis and E. P. Giannelis, Green Chem., 2012, 14, 3141–3145 RSC.
- J. Zhou, Z. Sheng, H. Han, M. Zou and C. Li, Mater. Lett., 2012, 66, 222–224 CrossRef CAS PubMed.
- L. Zhu, Y. Yin, C.-F. Wang and S. Chen, J. Mater. Chem. C, 2013, 1, 4925–4932 RSC.
- X. Qin, W. Lu, A. M. Asiri, A. O. Al-youbi and X. Sun, Catal. Sci. Technol., 2013, 3, 1027–1035 CAS.
- J. Wei, J. Shen, X. Zhang, S. Guo, J. Pan, X. Hou, H. Zhang, L. Wang and B. Feng, RSC Adv., 2013, 3, 13119–13122 RSC.
- S. K. Bhunia, A. Saha, A. R. Maity, S. C. Ray and N. R. Jana, Sci. Rep., 2013, 3, 1473 CrossRef CAS PubMed.
- X. Wang, L. Cao, S.-T. Yang, F. S. Lu, M. J. Meziani, L. L. Tian, K. W. Sun, M. A. Bloodgood and Y.-P. Sun, Angew. Chem., Int. Ed., 2010, 49, 5310–5314 CrossRef CAS PubMed.
- Y. Dong, H. Pang, H. B. Yang, C. Guo, J. Shao, Y. Chi, C. M. Li and T. Yu, Angew. Chem., Int. Ed., 2013, 52, 7800–7804 CrossRef CAS PubMed.
- P. Anilkumar, X. Wang, L. Cao, S. Sahu, J. H. Liu, P. Wang, K. Korch, K. N. Tackett II, A. Parenzan and Y.-P. Sun, Nanoscale, 2011, 3, 2023–2027 RSC.
- S. Pandey, A. Mewada, G. Oza, M. Thakur, N. Mishra, M. Sharon and M. Sharon, Nanosci. Nanotechnol. Lett., 2013, 5, 775–779 CrossRef CAS PubMed.
- J. C. Vinci, I. M. Ferrer, S. J. Seedhouse, A. K. Bourdon, J. M. Reynard, B. A. Foster, F. V. Bright and L. A. Colon, J. Phys. Chem. Lett., 2013, 4, 239–243 CrossRef CAS.
- Q. Hu, M. C. Paau, Y. Zhang, W. Chan, X. Gong, L. Zhang and M. M. F. Choi, J. Chromatogr. A, 2013, 1304, 234–240 CrossRef CAS PubMed.
- S. Jahan, F. Mansoor, S. Naz, J. Lei and S. Kanwal, Anal. Chem., 2013, 85, 10232–10239 CrossRef CAS PubMed.
- X. Huang, F. Zhang, L. Zhu, K. Y. Choi, N. Guo, J. Guo, K. N. Tackett II, P. Anilkumar, G. Liu, Q. Quan, H. S. Choi, G. Niu, Y.-P. Sun, S. Lee and X. Chen, ACS Nano, 2013, 7, 5684–5693 CrossRef CAS PubMed.
- P. Huang, J. Lin, X. Wang, Z. Wang, C. Zhang, M. He, K. Wang, F. Chen, Z. Li, G. Shen, D. Cui and X. Chen, Adv. Mater., 2012, 24, 5104–5110 CrossRef CAS PubMed.
- X. Zhang, S. Wang, L. Xu, Y. Ji, L. Feng, L. Tao, S. Li and Y. Wei, Nanoscale, 2012, 4, 5581–5584 RSC.
- X. Zhang, S. Wang, C. Zhu, M. Liu, Y. Ji, L. Feng, L. Tao and Y. Wei, J. Colloid Interface Sci., 2013, 397, 39–44 CrossRef CAS PubMed.
- H. Ding, L.-W. Cheng, Y.-Y. Ma, J.-L. Kong and H.-M. Xiong, New J. Chem., 2013, 37, 2515–2520 RSC.
- M. Saxena, S. K. Sonkar and S. Sarkar, RSC Adv., 2013, 3, 22504–22508 RSC.
- Y. Xu, M. Wu, Y. Liu, X.-Z. Feng, X.-B. Yin, X.-W. He and Y.-K. Zhang, Chem.–Eur. J., 2013, 19, 2276–2283 CrossRef CAS PubMed.
- K. Qu, J. Wang, J. Ren and X. Qu, Chem.–Eur. J., 2013, 19, 7243–7249 CrossRef CAS PubMed.
- B. Han, W. Wang, H. Wu, F. Fang, N. Wang, X. Zhang and S. Xu, Colloids Surf., B, 2012, 100, 209–214 CrossRef CAS PubMed.
- C. H. Lee, R. Rajendran, M.-S. Jeong, H. Y. Ko, J. Y. Joo, S. Cho, Y. W. Chang and S. Kim, Chem. Commun., 2013, 49, 6543–6545 RSC.
- B. Kong, A. Zhu, C. Ding, X. Zhao, B. Li and Y. Tian, Adv. Mater., 2012, 24, 5844–5848 CrossRef CAS PubMed.
- L. Shen, L. Zhang, M. Chen, X. Chen and J. Wang, Carbon, 2013, 55, 343–349 CrossRef CAS PubMed.
- Q. He, M. Ma, C. Wei and J. Shi, Biomaterials, 2012, 33, 4392–4402 CrossRef CAS PubMed.
- S. Mitra, S. Chandra, D. Laha, P. Patra, N. Debnath, A. Pramanik, P. Pramanik and A. Goswami, Mater. Res. Bull., 2012, 47, 586–594 CrossRef CAS PubMed.
- J. Kim, J. Park, H. Kin, K. Singha and W. J. Kim, Biomaterials, 2013, 34, 7168–7180 CrossRef CAS PubMed.
- S. Pandey, M. Thakur, A. Mewada, D. Anjarlekar, N. Mishra and M. Sharon, J. Mater. Chem. B, 2013, 1, 4972–4982 RSC.
- L. Cao, S.-T. Yang, X. Wang, P. G. Luo, H.-H. Liu, S. Sahu, Y. Liu and Y.-P. Sun, Theranostics, 2012, 2, 295–301 CrossRef CAS PubMed.
- H. Tao, K. Yang, Z. Ma, J. Wan, Y. Zhang, Z. Kang and Z. Liu, Small, 2012, 8, 281–290 CrossRef CAS PubMed.
- N. Li, X. Liang, L. Wang, Z. Li, P. Li, Y. Zhu and J. Song, J. Nanopart. Res., 2012, 14, 1177 CrossRef.
- S. Srivastava, R. Awasthi, D. Tripathi, M. K. Rai, V. Agarwal, V. Agrawal, N. S. Gajbhiye and R. K. Gupta, Small, 2012, 8, 1099–1109 CrossRef CAS PubMed.
- L.-L. Li, J. Ji, R. Fei, C.-Z. Wang, Q. Lu, J.-R. Zhang, L.-P. Jiang and J.-J. Zhu, Adv. Funct. Mater., 2012, 22, 2971–2979 CrossRef CAS.
- S. Kim, S. W. Hwang, M.-K. Kim, D. Y. Shin, D. H. Shin, C. O. Kim, S. B. Yang, J. H. Park, E. Hwang, S.-H. Choi, G. Ko, S. Sim, C. Sone, H. J. Choi, S. Bae and B. H. Hong, ACS Nano, 2012, 6, 8203–8208 CrossRef CAS PubMed.
- J.-M. Bai, L. Zhang, R.-P. Liang and J.-D. Qiu, Chem.–Eur. J., 2013, 19, 3822–3826 CrossRef CAS PubMed.
- S. Zhu, J. Zhang, X. Liu, B. Li, X. Wang, S. Tang, Q. Meng, Y. Li, C. Shi, R. Hu and B. Yang, RSC Adv., 2012, 2, 2717–2720 RSC.
- Z. Qu, X. Zhou, L. Gu, R. Lan, D. Sun, D. Yu and G. Shi, Chem. Commun., 2013, 49, 9830–9832 RSC.
- H. Tetsuka, R. Asahi, A. Nagoya, K. Okamoto, I. Tajima, R. Ohta and A. Okamoto, Adv. Mater., 2012, 24, 5333–5338 CrossRef CAS PubMed.
- S. Zhu, J. Zhang, S. Tang, C. Qiao, L. Wang, H. Wang, X. Liu, B. Li, Y. Li, W. Yu, X. Wang, H. Sun and B. Yang, Adv. Funct. Mater., 2012, 22, 4732–4740 CrossRef CAS.
- S. H. Jin, D. H. Kim, G. H. Jun, S. H. Hong and S. Jeon, ACS Nano, 2013, 7, 1239–1245 CrossRef CAS PubMed.
- R. Liu, D. Wu, X. Feng and K. Mullen, J. Am. Chem. Soc., 2011, 133, 15221–15223 CrossRef CAS PubMed.
- L. Tang, R. Ji, X. Cao, J. Lin, H. Jiang, X. Li, K. S. Teng, C. M. Luk, S. Zeng, J. Hao and S. P. Lau, ACS Nano, 2012, 6, 5102–5110 CrossRef CAS PubMed.
- J. Shen, Y. Zhu, X. Yang and C. Li, Chem. Commun., 2012, 48, 3686–3699 RSC.
- S. Zhu, J. Zhang, C. Qiao, S. Tang, Y. Li, W. Yuan, B. Li, L. Tian, F. Liu, R. Hu, H. Gao, H. Wei, H. Zhang, H. Sun and B. Yang, Chem. Commun., 2011, 47, 6858–6860 RSC.
- J. Peng, W. Gao, B. K. Gupta, Z. Liu, R. Romero-Aburto, L. Ge, L. Song, L. B. Alemany, X. Zhan, G. Gao, S. A. Vithayathil, B. A. Kaipparettu, A. A. Marti, T. Hayashi, J.-J. Zhu and P. M. Ajayan, Nano Lett., 2012, 12, 844–849 CrossRef CAS PubMed.
- H. Sun, L. Wu, N. Gao, J. Ren and X. Qu, ACS Appl. Mater. Interfaces, 2013, 5, 1174–1179 CAS.
- L. Zhang, Y. Xing, N. He, Y. Zhang, Z. Lu, J. Zhang and Z. Zhang, J. Nanosci. Nanotechnol., 2012, 12, 2924–2928 CrossRef CAS PubMed.
- C. Hu, Y. Liu, Y. Yang, J. Cui, Z. Huang, Y. Wang, L. Yang, H. Wang, Y. Xiao and J. Rong, J. Mater. Chem. B, 2013, 1, 39–42 RSC.
- D. Pan, L. Guo, J. Zhang, C. Xi, Q. Xue, H. Huang, J. Li, Z. Zhang, W. Yu, Z. Chen, Z. Li and M. Wu, J. Mater. Chem., 2012, 22, 3314–3318 RSC.
- L. Xie, W. Fu, Y. Ma, H. Zhang and M. Fan, Acta Chim. Sin., 2012, 70, 2169–2172 Search PubMed.
- M. Zhang, L. Bai, W. Shang, W. Xie, H. Ma, Y. Fu, D. Fang, H. Sun, L. Fan and M. Han, J. Mater. Chem., 2012, 22, 7461–7467 RSC.
- M. Nurunnabi, Z. Khatun, G. R. Reeck, D. Y. Lee and Y.-K. Lee, Chem. Commun., 2013, 49, 5079–5081 RSC.
- Z. M. Markovic, B. Z. Ristic, K. M. Arsikin, D. G. Klisic, L. M. Harhaji-Trajkovic, B. M. Todorovic-Markovic, D. P. Kepic, T. K. Kravic-Stevovic, S. P. Jovanovic, M. M. Milenkovic, D. D. Milivojevic, V. Z. Bumbasirevic, M. D. Dramicanin and V. S. Trajkovic, Biomaterials, 2012, 33, 7084–7092 CrossRef CAS PubMed.
| This journal is © The Royal Society of Chemistry 2014 |