Graphene anchored with ZrO2 nanoparticles as anodes of lithium ion batteries with enhanced electrochemical performance

Haiping Xua, Shuai Yuana, Zhuyi Wang*a, Yin Zhaoa, Jianhui Fangb and Liyi Shi*a
aResearch Centre of Nanoscience and Nanotechnology, Shanghai University, Shanghai 200444, China. E-mail: bamboo2009@shu.edu.cn; shiliyi@shu.edu.cn; Tel: +86 21 66136082
bDepartment of Chemistry, Shanghai University, Shanghai 200444, China

Received 15th December 2013 , Accepted 14th January 2014

First published on 15th January 2014


Abstract

A green and facile strategy was reported to synthesize the composite of graphene decorated with ZrO2 nanoparticles as a good candidate for the anode material of lithium-ion batteries. ZrO2 nanoparticles are uniformly anchored on the surface of graphene with an average size of 5.5 nm. This graphene/ZrO2 composite shows high specific capacity, high coulomb efficiency, excellent rate performance and cycling stability due to the sandwich-like stable structure with ZrO2 as the inert pillar supporting graphene, which offers more active sites for Li+ insertion. The strong interaction between graphene and ZrO2 plays a key role in maintaining the structure stability against the irreversible volume change during Li+ insertion/extraction.

1. Introduction

Lithium-ion batteries (LIBs) are the predominant power sources for the electronic instruments, and have been considered as one of the most promising alternates for applications in emerging smart grids and hybrid electric vehicles (HEVs) compared with other energy storage systems.1–5 However, low power density, safety problems, severe capacity decaying and especially short cycling life are blocking the LIBs for large-scale application.6–8 The cycle life and rate performance of LIBs strongly depend on electrode materials.9–11

Compared with alloys,12 metal oxides,13–18 metal sulfides,19 Si-based materials,20,21 and their composites, the carbon-based materials attract increasing attention because of their good rate and superior cycling performance, excellent conductivity and better safety, even though the storage amount of lithium ions is small. As a new-star carbon material, graphene (GR) possesses lots of advantages such as large specific surface, cheap and easy preparation from graphite.22,23 However, GR is not widely used in LIBs alone because of low efficiency to produce graphene with high quality and the agglomeration between GR layers during the lithiation/delithiation process. Many reports have shown that avoiding the self-restacking of graphene layer with some spacers can significantly improve the electrochemical performance of graphene due to the increase in the surface area and the opening of channels for Li-ion transport.10,24

Recently, one focus is the synthesis of transition metal oxide compositing with graphene due to their synergistic property.24–29 For example, graphene/MOx (M = Sn, Ti, Fe, Co, Ni, Mn, V…) composites present enhanced lithium storage capacity, good rate capability.21,30–39 Although larger capacity is obtained by using these composites as electrode materials, their capacities decay seriously after several cycles, indicating the formation of solid electrolyte interface (SEI) film during the cycling test.21 Firstly, the formation of SEI film leads to the capacity decay during the initial charging–discharging process. Secondly, the interaction between MOx and GR is not strong enough. The particles exfoliate easily from GR substrate during charging and discharging process. Thirdly, large volume expansion of metal oxide still exists during the lithium insertion/extraction process. So, it is still a key issue to find electrode materials with stable structures.

It should be feasible to solve the above problems by hybrid graphene with an inert and stable material during the lithium insertion/extraction process. Based on the band structure and electrochemical properties of MOx, zirconium dioxide (ZrO2) is screened out as an inert material. It is expected that preparing graphene/ZrO2 (GRZ) composite will improve the cycle and rate performances of GR as electrode materials in LIBs.

Recently, there are only several efforts on preparing GRZ nanocomposites by electrodeposition method applied in the detection of organophosphorus agents and biosensor,40,41 and by atomic layer deposition (ALD) applied in electrochemical capacitor.42 Although these methods offer the advantages of controlled synthesis with desired properties, they are still suffering from the limitation of low cost, green, environmental friendly and good dispersity without particles agglomeration. So it still deserves to explore new methods to synthesize GRZ nanocomposites with strong interaction, well nanoparticles distribution, and environmental friendship. Furthermore, it is necessary to apply the GRZ as electrode materials in the lithium ion battery to evaluate its cycling performance and reveal the working mechanism of GRZ structure on lithium ion battery.

In this work, a simple and green route was designed to synthesize GRZ with highly dispersed ZrO2 nanocrystals on the surface of graphene. Furthermore, the effect of the novel stable structure of the composite on the diffusion of lithium ions to the electrode surface, and the electrochemical properties as the electrode materials in LIBs were investigated. At last, the working mechanism of GRZ was discussed.

2. Experimental

2.1. Preparation of graphene oxide

Graphene oxide was prepared from graphite flakes using a modified Hummers method.43,44 Typically, 3.0 g graphite (G), 1.5 g NaNO3 and 75 mL H2SO4 were mixed and stirred vigorously in a flask immersed in an ice-water bath. Then 9.0 g KMnO4 were slowly added into the solution in 1 h. After the ice bath was removed and the above mixture was continuously stirred for 2 h at 35 °C in a water bath. Then 140 mL doubly distilled water was added into the mixture under vigorous stirring. After the temperature was increased to 98 °C, the mixture was further treated with 120 mL of deionized water (60 °C) and 25 mL of H2O2 (30 wt%) and stirred for additional 2 h at room temperature. Graphite oxide was obtained by centrifugation and washing by a mixed aqueous solution of 5 wt% H2SO4/5 wt% HCl for three times. The obtained graphite oxide was redispersed in deionized water and sonicated for several hours to obtain graphene oxide (GO).

2.2. Reduction of graphene oxide (GO)

The obtained GO (0.05 g) and 0.1 g catechol were dissolved in 75 mL water, and then sonicated for 2 h. Subsequently, the dispersion was transferred to a 100 mL Teflon-lined stainless steel autoclave for hydrothermal treatment at 140 °C for 24 h. After reaction, the autoclave was naturally cooled to room temperature. The products were centrifuged and washed with ethanol and deionized water for several times, respectively, and then dried under vacuum at 70 °C for 24 h to obtain graphene (GR).

2.3. Preparation of graphene/ZrO2 (GRZ)

The composites of GR decorated with ZrO2 nanoparticles were synthesized simply by an in situ one-step hydrothermal method. Briefly, 0.05 g GR was added into 75 mL 0.01 mol L−1 ZrOCl2·8H2O solution for ultrasonic treatment to form a dispersion. Subsequently, the dispersion was loaded in a 100 mL Teflon-lined stainless steel autoclave for hydrothermal treatment at 180 °C for 24 h. The products were centrifuged and washed by ethanol and deionized water for several times, respectively. After drying at 70 °C for 24 h, the final composites of graphene/ZrO2 (GRZ) were obtained. Meanwhile, different concentrations of ZrOCl2·8H2O composited with 0.05 g GR had been carried out, including 0.0025 mol L−1, 0.005 mol L−1, 0.01 mol L−1, 0.015 mol L−1, 0.02 mol L−1. The products with the increasing ZrO2 content were denoted as GRZ-1, GRZ-2, GRZ-3, GRZ-4, GRZ-5, respectively, and the mass ratio of graphene in these five samples were confirmed to be 48.5%, 29.2%, 18.6%, 13.5%, 7.9% by the heat treatment of them at 750 °C, respectively. Pure ZrO2 was also prepared by the similar procedure with the absence of GR.45,46

2.4. Materials characterization

The morphologies and structures of the prepared GO, GR and GR/ZrO2 were characterized by X-ray diffraction (XRD, Rigaku D/max-2550V, Cu Ka radiation), field-emission scanning electron microscopy (FE-SEM, JSM-6700F), transmission electron microscopy (TEM, JEOL JEM-200CX), and high-resolution transmission electron microscope (HRTEM, JEM-2010F). Fourier transform infrared (FT-IR) spectra were collected by a BIO-RAD FTS 135 FT-IR spectrophotometer using the KBr pellet method. Raman spectra were obtained with Raman microscope (INVIA). Energy-dispersive X-ray (EDX) mapping (JEM-2100F) was used to characterize the homogeneity of different elements. X-ray photoelectron spectra (XPS) were obtained with a Kratos Analytical Axis UltraDLD spectrometer with monochromatized Mg Kα X-ray radiation. The C 1s line (284.6 eV) was taken as a reference to calibrate the shift of binding energy due to electrostatic charging.

2.5. Electrochemical measurements

Working electrodes were fabricated as follows: 80 wt% of the active material, 10 wt% of the conductive agent (acetylene black), and 10 wt% of the binder (poly(vinylidene difluoride), PVDF) were homogenously mixed in N-methyl-2-pyrrolidinone (NMP) and pasted on a copper foil. The electrochemical properties of the working electrodes were measured using two-electrode CR2016 coin-type cells with lithium foil serving as both counter and reference electrodes under ambient temperature. The electrolyte was 1 M LiPF6 solution in EC/DMC/EMC (ethylene carbonate/dimethyl carbonate/ethyl methyl carbonate, 1/1/1, w/w/w, Zhangjiagang Guotai-Huarong New Chemical Materials Co., Ltd). Galvanostatic discharge–charge tests were carried out using a LAND-CT2001A test system. The coin cells were discharged and charged at different current densities (50 mA g−1, 100 mA g−1, 200 mA g−1, 300 mA g−1, 500 mA g−1, 800 mA g−1) in the fixed voltage range of 0–3.0 V. The first cycle discharging was kept at 50 mA g−1. Cyclic voltammetry was performed on a CHI660E electrochemical workstation over the potential range of 0–3.0 V vs. Li/Li+ with a scan rate of 1 mV s−1.

3. Results and discussion

The synthesis process for the composites of highly dispersed ZrO2 nanocrystals on graphene sheets was schematically described in Fig. 1. Firstly, GO was reduced by catechol during the first hydrothermal treatment. The oxygenic groups combining with catechol were deoxidated due to the strong reducibility of catechol. During the second hydrothermal process, the tetramer of zirconium hydroxides formed and polymerized on the surface of GR to get GRZ with Zr–O–C bonds between ZrO2 nanocrystals and graphene.
image file: c3ra47653g-f1.tif
Fig. 1 Schematic illustration for the synthesis process of GRZ composites.

Fig. 2 shows XRD, Raman and FT-IR spectra of graphite (G), graphene oxide (GO), graphene (GR), ZrO2 and GR/ZrO2 composite (GRZ-3). Sample G, GO and GR exhibit their own typical characteristic peaks. A strong intense peak (001) at 2θ = 10.4° was shown in GO, while the natural graphite at 2θ = 26.7°, which is attributed to the presence of oxygen-containing functional groups on carbon nanosheets after the oxidation of G.40,47 After the reduction of GO by catechol, the characteristic peak at 10.4° disappears, and a (002) characteristic peak at 24.9° appears, indicating that the oxygen-containing functional groups of GO are effectively removed and GO converts into GR successfully. The preparation of GO by Hummer method introduces –OH and –COOH onto every layer of GO as active sites for the introduction of the reductant. As depicted in Fig. 1, the catechol molecules intercalate onto the surface of GO by chemical bonding between phenolic hydroxyl of catechol and –OH or –COOH. Additionally, the π–π stacking intercalation of catechol molecules is in favour of reducing GO. The XRD pattern of GRZ-3 (Fig. 2(b)) shows characteristic peaks of monoclinic ZrO2 (JCPDS card no. 3717484). The diffraction peak of GR at 24.9° overlaps with the characteristic peak of ZrO2. The calculated d002-spacing of GRZ-3 (3.67 Å) is larger than that of GR (3.4 Å), which may result from the appearance of zirconium oxide species between GR interlayers.24,48


image file: c3ra47653g-f2.tif
Fig. 2 (a), (b) XRD patterns and (c) Raman patterns and (d) FT-IR spectra of G, GO, GR, ZrO2 and GRZ-3.

Raman spectroscopy is an effective way to characterize carbonaceous materials, especially the sp2 and sp3 hybridized carbon atoms involved in GR. Fig. 2(c) displays the Raman spectra of G, GO, GR and GRZ-3. The spectrum of GO and GR clearly shows two broad peaks at 1342 cm−1 and 1580 cm−1, which are ascribed to the D band and G band of them, respectively. The D band is an indication of the defects and disorder vibrations of sp3 carbon atoms, and the G band is related to the vibration of sp2 carbon atoms in a graphitic 2D hexagonal lattice.24 Therefore, the intensity ratio of D band to G band (ID/IG) reflects the concentration of defects in GO and GR. In this case, the MD/IG of the GR is 1.34, which is significantly higher than that (0.93) of GR reduced by hydrazine hydrate.49,50 The increase of D/G ratio suggests the reduction of GO due to the π–π conjugation between sp2 C in GO and sp2 C in catechol, which is consistent with the XRD results.

In Fig. 2(d), GO shows strong absorption assigned to the carbon oxygen bonds in the wavenumber region of 900–1800 cm−1.50,51 The peaks at 1721 cm−1, and 1053.2 cm−1 and 1680 cm−1 are attributed to the characteristic absorption of –COOH, C–O and C[double bond, length as m-dash]C, respectively. The broad absorption band located at 3421 cm−1 is assigned to the stretching vibration of –OH. However, the characteristic peaks for GR become weaker in the wavenumber region of 900–1800 cm−1. The absorption located at 1721 cm−1 and 1053.2 cm−1 even disappear. These results demonstrate the successful reduction of the oxygen-containing functional groups of GO by catechol during the hydrothermal treatment.52 The FT-IR spectrum of ZrO2 exhibits the absorption peaks corresponding to the stretching vibration of O–H (∼3300 cm−1), and the stretching vibration of Zr–O (500–1000 cm−1). Compared with pure ZrO2, new absorption peaks in the range of 800–1200 cm−1 belonging to C–O–Zr bond appear in GRZ-3 and other GRZ composites (Fig. S1), indicating the interaction between ZrO2 nanocrystals and GR by chemical bonds.

Fig. 3 shows the XPS results of GO, GR and GRZ-3. C1s of GO and GR is deconvoluted into peaks related to different oxygen-containing functional groups (Fig. 3(a) and (c)). The main peak located at about 284.5 eV is attributed to non-oxygenated ring carbon atoms, while the other peaks at 286.2, 287.8 and 289.1 eV are assigned to the oxygen-containing groups (C–OH), (C[double bond, length as m-dash]O) and (O[double bond, length as m-dash]C–OH), respectively.53 GR shows the weaker intensity of oxygen-containing groups compared with GO, and the intensity of C–C peak increases simultaneously due to catechol embedding into GR layers. The atomic ratios of carbon to oxygen in GO and GR are 2.13 and 7.76, respectively. These changes indicate that most of the oxygenated functional groups are successfully reduced and GR is formed accordingly, which agrees well with the FT-IR analysis results. A new peak belonging to C–Zr (281.9 eV) appears in GRZ-3 along with non-oxygenated carbon C–C (284.5 eV), C–OH (286.1 eV), carbonyl group C[double bond, length as m-dash]O (287.5 eV) (Fig. 3(e)).24,48 O 1s of GO and GR (Fig. 3(b) and (d)) is deconvoluted into two peaks located at 532.2 eV and 533.1 eV, which are ascribed to C[double bond, length as m-dash]O and C–O–C/C–OH, respectively. Except for these two peaks, GRZ-3 shows an additional peak at 530.8 eV belonging to Zr–O (Fig. 3(f)). The shift of the C 1s and O 1s peaks of GRZ-3 composite is ascribed to Zr offering some electrons to O and C. Fig. 3(g) presents the separated XPS spectrum of Zr 3d peaks. The binding energy of 180.8 eV, 182.2 eV, 183.4 eV and 185 eV are ascribed to Zr–C, stoichiometric Zr–OH, Zr–O–C and Zr3d5/2, respectively, which manifests a normal state of Zr4+ in the monoclinic type ZrO2.54,55 According to the XPS and XRD results, the inert ZrO2 nanocrystals may combine with GR sheets by Zr–O–C and Zr–C bonds, which will promote the stable structure of GR/ZrO2 composites.


image file: c3ra47653g-f3.tif
Fig. 3 (a), (c) and (e) the separated spectra of C 1s region of GO, GR and GRZ-3, respectively; (b), (d) and (f) the separated spectra of O 1s region of GO, GR and GRZ-3, respectively; (g) the spectra of Zr 3d and (h) the survey scan spectra of GRZ-3.

Fig. 4(a) shows a typical SEM image of GR, revealing ruffled morphology consisting of a thin wrinkled structure. The plate structure indicates that the innate crumple of GR might develop into wavy structures in the macroscopic scale.56,57 Fig. 4(b) shows a TEM image of the typical transparent GR, and a rippled and crumpled sheet structure can be observed, confirming that the reduced GR nanosheet was fully exfoliated from the graphite in the hydrothermal process. The aromatic structure of catechol and GR can form the strong π–π conjugated intercalation, which can efficiently facilitate the interlayer separation of GR plates. However, small parts of GR sheets are still fold and bent due to elastic deformation. The TEM image of pure ZrO2 shown in Fig. 4(c) exhibits aggregated nanoparticles due to large surface energy and small size. According to the TEM image of GRZ-3 composite shown in Fig. 4(d), ZrO2 nanoparticles are well dispersed on the surface of GR with an average size of 5.5 nm, indicating the uniform hybridization of GR with ZrO2 nanocrystals.58 The high surface area of graphene can provide a good support for anchoring ZrO2 nanoparticles, and make ZrO2 nanoparticles well dispersed in GR and prevent their aggregation. Less crumpled and rippled structures in the composite compared with GR also indicate that ZrO2 nanocrystals disperse uniformly on GR sheets and between the layers of them. Less wrinkled areas and flat sheets endue GR with larger surface area, which is helpful for the capacity and rate performance. Combining the FT-IR and XPS analysis results, it can be deduced that ZrO2 nanoparticles are attached on the surface of GR by covalent bonds. After ultrasonic treatment for TEM measurement, the integrated GR nanosheets are still fully decorated by ZrO2 nanoparticles, which also indicates the strong covalent interaction between ZrO2 and GR. TEM images of different samples prepared by changing the concentration of ZrOCl2 (Fig. S2) also show the formation of composites of ZrO2 nanoparticles on GR. The synthesis of ZrO2/GR composites can be considered by the following process: in the aqueous solution of ZrOCl2, tetramer complexes [Zr(OH)2·4H2O]48+ form as major species by eqn (1). When GR was added into the above aqueous solution, [Zr(OH)2·4H2O]48+ was adsorbed onto the negative charged oxygen-containing functional groups of GR via electrostatic attraction force. During the hydrothermal treatment, tetramer complexes go through a polymerization process by eqn (2) to form polymeric species [Zr(OH)2+x·(4 − x)H2O]4(8−4x)+. When the concentration of polymeric species reaches the critical supersaturation level, ZrO2 crystal nuclei form spontaneously and then evolve into ZrO2 nanocrystals.59,60

 
4ZrOCl2 + 20H2O ↔ [Zr(OH)2·4H2O]48+ + 8Cl (1)
 
[Zr(OH)2·4H2O]48+ ↔ [Zr(OH)2+x·(4 − x)H2O]4(8−4x)+ + 4xH+ (2)


image file: c3ra47653g-f4.tif
Fig. 4 (a) low magnification SEM image of GR (inset: high magnification) and (b), (c), (d) TEM images of GR, ZrO2 and GRZ-3 (Inset in (d): the corresponding size distribution histogram of ZrO2).

Fig. 5 shows the HRTEM images of G, GR and GRZ-3. A lattice spacing of 0.26 nm corresponds to the (002) plane of graphite (Fig. 5(b)). The fast Fourier transform (FFT) pattern confirms that graphite powder has good crystallinity indexed as (002), as evidenced by the XRD results. In contrast, the HRTEM results of GR does not present clear lattice fringe. One reason is that GR is more transparent, which makes it difficult to be distinguished from the background of carbon film on the copper mesh. Another reason may be attributed to the thin wrinkled structure of GR. The FFT of the lattice image of GR exhibits typical rings of GR as shown in the inset of Fig. 5(d). The interplanar spacing of GR measured from HRTEM is consistent with the XRD results. Fig. 5(e) shows that ZrO2 nanocrystals locate on the surface of GR without clear interface, which also confirms that the ZrO2 crystals are fixed on the surface of GR by strong interaction. In Fig. 5(f), three sets of crystal lattice fringes of ZrO2 nanocrystals with the interlayer distances of 0.29 nm, 0.26 nm and 0.23 nm, should be attributed to the spacing of the (111), (200) and (120) planes of monoclinic ZrO2 crystals, respectively.61 The FFT pattern of GRZ-3 is (111) and (120) planes, respectively.


image file: c3ra47653g-f5.tif
Fig. 5 (a), (b) HRTEM images of G; (c), (d) HRTEM images of GR; (e), (f) HRTEM images of GRZ-3 (Insets: the Fast Fourier Transformation patterns of HRTEM).

In order to further investigate the distribution and composition of the GRZ, energy-dispersive X-ray (EDX) mapping analysis was adopted. Fig. 6 shows that Zr, C and O elements are homogeneously distributed throughout the samples, confirming the ZrO2 nanocrystals being well distributed in the GR sheet matrix, which agrees well with the TEM analysis.


image file: c3ra47653g-f6.tif
Fig. 6 EDX elemental maps of GRZ-3: (a) SEM image; (b) full elemental map; (c), (d), (e) EDX elemental maps of C, Zr and O; (f) EDX energy spectrum.

Based on the above analysis, the GRZ composites with homogeneous components distribution and strong interaction between graphene and ZrO2 were successfully synthesized by an environmental friendly method. To know the lithium storage performance of the composites working as anode materials in lithium ion battery, more electrochemical analysis and measurements were carried out.

In Fig. 7(a), the CV curve of GR shows obvious peaks at 0.59 V and 1.59 V when the batteries were charged and discharged at the scan rate of 1 mV s−1, indicating the formation of SEI film in the initial charging–discharging process. GRZ-3 electrode material shows cathodic peaks (first sweep) located around ∼0.6 V with a shoulder at about ∼1.6 V which is attributed to the formation of LiC2 as well as the SEI film, and this result is also consistent with the CV results of GR.24


image file: c3ra47653g-f7.tif
Fig. 7 (a) Cyclic voltammograms of GR, ZrO2 and GRZ-3 at a scan rate of 1 mV s−1; (b) cyclic voltammograms of GRZ-3 at different scan rates.

In Fig. 7(b), the most noteworthy thing is that the cathodic and anode peaks of GRZ-3 disappear with increasing the scan rate from 1 mV s−1 to 200 mV s−1 in the voltage range of 0–3 V. The shape of CV curves retains high analogous rectangle without obvious peaks, which also means that the electrochemical reaction becomes relatively reversible and the structure of the composite material is relatively stable, even when the scan rate was increased to 200 mV s−1. Fig. S3 presents the CV curves of GRZ-3 at 1 mV s−1 with several cycles. The first and subsequent cycles are almost similar, demonstrating that the electrochemical reaction becomes relatively reversible after the first cycle. The stable structure of GRZ composite anode material during cycling with CV test, even though at large scan rate, can be expected to prevent the agglomeration between GR layers during the charging and discharging processes and improve the cycling performance of LIBs.

The charging and discharging tests for the samples were carried out in the voltage range of 0–3 V (vs. Li/Li+) at the constant current density of 50 mA g−1 for 200 cycles at room temperature (Fig. 8(a)). The profiles of the composites for different cycles (1st, 50th, 100th, 150th, 200th) show a typical insertion and extraction performance. In the first cycle, the discharge curve has a peak at ∼1.6 V (vs. Li/Li+), which is in good agreement with the CV measurement. The GRZ-3 composite electrode shows the capacities of 472 and 460 mA h g−1 for the first discharge and charge, respectively. The profile implies the presence of at least two different Li storage sites in GRZ-3 composite compared with GR. The capacity for the voltage less than 0.5 V (vs. Li/Li+) should be ascribed to lithium embedding into GR layers. However, the disappearance of a voltage peak indicates a disordered stacking of graphene sheets during cycling, leading to the geometrically and electrochemically nonequivalent Li+ ion sites. The similar results in the previous report described that Li+ ions are electrochemically adsorbed on the GR sheets which are ranked like “falling cards”.53 The differential capacity versus voltage plots of GRZ-3 composite (Fig. S4) show that there are two broad peaks at ∼0.4 V and ∼1.6 V in the charging curves, and these two peaks indicate the formation of LiC2 and the SEI film.24 The broad peak located at ∼1.6 V becomes flat with the increase of cycle number, indicating that lithium ions insertion/extraction process becomes more and more reversible upon cycling. The coulomb efficiencies of GR, ZrO2 and GRZ-3 (Fig. S5) at the first cycle are 126.4%, 104.6% and 105.6%, respectively. The irreversible capacity loss in the first cycle is due to the formation of a solid electrolyte interface (SEI) layer, and the coulomb efficiency tends to 100% for ZrO2 and GRZ-3 with the increasing cycles, which is the most powerful evidence manifesting that ZrO2 plays a crucial role in stabilizing the structure of GRZ-3 composite.


image file: c3ra47653g-f8.tif
Fig. 8 (a) Charge–discharge curves of GRZ-3 at 50 mA g−1; (b) cycle performance of GR, ZrO2 and GRZ-3; (c) charge–discharge curves of GRZ-3 at different current densities; (d) the rate capabilities of GR, ZrO2 and GRZ-3 at different current densities (50 mA g−1, 100 mA g−1, 200 mA g−1, 300 mA g−1, 500 mA g−1, 800 mA g−1, 50 mA g−1).

The capacity versus cycle number plots is shown in Fig. 8(b). For pure ZrO2 and GR samples, the reversible specific capacities after 200 cycles are 12.5 mA h g−1 and 82.8 mA h g−1, respectively. However, the reversible specific capacity of GRZ-3 composite is 351 mA h g−1 after 200 cycles, retaining 75% of original specific capacity without any obvious fading changes after 200 cycles. It can be clearly noted that the specific capacity of GRZ-3 increases a lot compared with the pure GR. These results suggest that inert ZrO2 nanocrystals embedded into GR layers, restraining the agglomeration of GR sheets and facilitating the transportation of lithium ions in the process of lithium ions storage. The excellent cycling stability also indicates that the prepared GRZ-3 composite is suitable for the anode material of LIBs.

Fig. 8(c) presents the charge–discharge profiles for GRZ-3 at different rate. The specific capacity of GRZ-3 decays with the increasing current density. What should be noticed is that the rate capacity of GRZ-3 is still as high as 104.6 mA h g−1 at the current density of 800 mA g−1. The excellent rate performance of GRZ-3 indicates that the structure of the composite is relatively stable, even when it was charged–discharged under the high rate, which further confirms that ZrO2 nanocrystals in the GRZ composite play an important role in suppressing the agglomeration of GR layers during Li-ion insertion or extraction processes.

The rate capability of the different materials was evaluated at various current rates as shown in Fig. 8(d). The GRZ-3 composite shows about one time enhanced rate performance compared with GR at all current densities except for 50 mA g−1, which may be related to the reduced Li-ion diffusion length and the increased surface area of GRZ composite.

In order to gain further understanding of the excellent electrochemical performances of GRZ composite compared with individual GR and ZrO2, electrochemical impedance spectroscopy (EIS) measurements were carried out on batteries after the 1st and 200th cycles. An equivalent circuit of fitting analysed data is also shown in Fig. 9(g) in conformity with the reported researches.24,54 The Nyquist plots exhibit three distinct parts consisting of a semicircle in the high frequency region, a semicircle in the intermediate frequency region and a sloped line in the low frequency region, further attesting the electrochemical stability of these electrode materials. From the fitting circuit, Re stands for the internal resistance of the half-battery, Rf and CPE1 represent the contact resistance and constant phase element of solid electrolyte interface (SEI) film, Rct and CPE2 present the charge-transfer resistance and constant phase element of the electrode/electrolyte interface, and ZW stands for the Warburg impedance related to the lithium ion diffusion process.


image file: c3ra47653g-f9.tif
Fig. 9 (a), (c) and (e) Nyquist plots of GR, ZrO2 and GRZ-3 after 1st and 200th cycles; (b), (d) and (f) partial enlarged view of Nyquist plots of GR, ZrO2 and GRZ-3 after 1st and 200th cycles; (g) equivalent circuit of GRZ-3 sample after 1st and 200th; (h) Nyquist plots of different GRZ composites after 200th cycles.

The EIS of GR, ZrO2 and GRZ-3 are shown in Fig. 9(a), (c) and (e), and the partial enlarged Nyquist plots of GR, ZrO2 and GRZ-3 are shown in Fig. 9(b), (d) and (f). Their charge transfer resistances (Rct) after the first charge and discharge process are 62.4 Ω, 95.6 Ω and 32.3 Ω, respectively. After the 200th cycles, the Rct of GRZ-3 composite is 40.4 Ω, and this slight increase of Rct is ascribed to the good contact between GR layers and ZrO2 nanocrystals suppressing the agglomeration of GR layers. However, the Rct of GR and ZrO2 increases to 149.5 Ω and 221.3 Ω, respectively. The significant increase of resistance and the unstable formation of SEI film may lead to the drastic decay of capacity. Therefore, the stable structure of graphene layers separated and supported by ZrO2 is undoubtedly the key factor for the capacity retention on cycling, especially at high discharge–charge rates. The impedance spectra of different GRZ composites in Fig. 9(h) show that the impedance of GRZ-3 is the lowest among all composites.

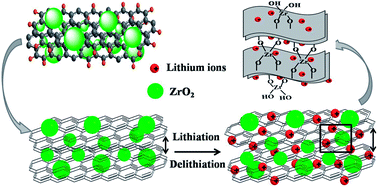
Such excellent cycle stability and rate performance of the composite are believed to derive from the novel structure of the composites, as shown in Fig. 10. When the composite was charged and discharged, lithium ions will insert and extract the layers of GR. After Li+ ion insertion, the volume of the composite will expand a little larger than before. However, it can return back to the original volume during the delithiation process.


image file: c3ra47653g-f10.tif
Fig. 10 Schematic diagram showing paths for lithium ions in GRZ composites.

There may be three reasons leading to the superior electrochemical performance of GRZ composite materials compared with pure GR. Firstly, ZrO2 may work as the inert stable pillar separating and supporting GR layers through Zr–O–C bond, which can limit the volume expansion effectively and promote the transportation of lithium ions. Secondly, ZrO2 nanocrystals could suppress the agglomeration of GR sheets during lithium ions insertion/extraction, and the loose stacking of GR sheets offers large contact area between the composite and electrolyte. Thirdly, ZrO2 has negligible lattice change when it is charged and discharged.

4. Conclusions

A green and facile method was designed to synthesize graphene/ZrO2 composites (GRZ), in which ZrO2 nanocrystals are anchored tightly on the graphene sheets and work as rigid and stable pillars to keep the layer structure of graphene. The novel structure of GRZ is stable when charged and discharged as a LIB anode material, which results in the excellent cycling stability for 200th without obvious capacity decay, and good rate performance of 110 mA h g−1 when it was charged at the current density of 800 mA g−1. The results prove that the assumption to improve the performance of graphene materials as LIB anode materials by some stabilizer is feasible and instructive to design more efficient LIB electrode materials.

Acknowledgements

The authors acknowledge the support of the Shanghai Leading Academic Discipline Project (S30107), National Natural Science Foundation of China (51202138), Natural Science Foundation of Shanghai (13ZR1454400, 12ZR1410500) and the Dongguan Science and Technology Bureau (2012108102029).

Notes and references

  1. M. Armand and J. M. Tarascon, Nature, 2008, 451, 652–657 CrossRef CAS PubMed.
  2. H. G. Jung, S. T. Myung, C. S. Yoon, S. B. Son, K. H. Oh, K. Amine, B. Scrosati and Y. K. Sun, Energy Environ. Sci., 2011, 4, 1345–1351 CAS.
  3. P. G. Bruce, B. Scrosati and J. M. Tarascon, Angew. Chem., Int. Ed., 2008, 47, 2930–2946 CrossRef CAS PubMed.
  4. Y. L. Cao, L. F. Xiao, W. Wang, D. Choi, Z. M. Nie, J. G. Yu, L. V. Saraf, Z. G. Yang and J. Liu, Adv. Mater., 2011, 23, 3155–3160 CrossRef CAS PubMed.
  5. L. W. Ji, Z. Lin, M. Alcoutlabi and X. W. Zhang, Energy Environ. Sci., 2011, 4, 2682–2699 CAS.
  6. K. S. Park, A. Benayad, D. J. Kang and S. G. Doo, J. Am. Chem. Soc., 2008, 130, 14930–14931 CrossRef CAS PubMed.
  7. Z. D. Huang, X. M. Liu, S. W. Oh, B. Zhang, P. C. Ma and J. K. Kim, J. Mater. Chem., 2011, 21, 10777–10784 RSC.
  8. L. F. Shen, C. Z. Yuan, H. J. Luo, X. G. Zhang, K. Xu and Y. Y. Xia, J. Mater. Chem., 2010, 20, 6998–7004 RSC.
  9. S. Iijima, Nature, 1991, 354, 56–58 CrossRef CAS.
  10. G. M. Zhou, D. W. Wang, F. Li, L. L. Zhang, N. Li, Z. S. Wu, L. Wen, G. Q. Lu and H. M. Cheng, Chem. Mater., 2010, 22, 5306–5313 CrossRef CAS.
  11. H. D. Liu, G. Yang, X. F. Zhang, P. Gao, L. Wang, J. H. Fang, J. Pinto and X. F. Jiang, J. Mater. Chem., 2012, 22, 11039–11047 RSC.
  12. B. Wang, X. L. Wu, C. Y. Shu, Y. G. Guo and C. R. Wang, J. Mater. Chem., 2010, 20, 10661–10664 RSC.
  13. Z. S. Wu, W. C. Ren, L. Wen, L. B. Gao, J. P. Zhao, Z. P. Chen, G. M. Zhou, F. Li and H. M. Cheng, ACS Nano, 2010, 4, 3187–3194 CrossRef CAS PubMed.
  14. J. Xiao, D. W. Choi, L. Cosimbescu, P. Koech, J. Liu and J. P. Lemmon, Chem. Mater., 2010, 22, 4522–4524 CrossRef CAS.
  15. H. B. Wu, A. Q. Pan, H. H. Hng and X. W. Lou, Adv. Funct. Mater., 2013, 23(45), 5669–5674 CrossRef CAS.
  16. J. L. Cheng, H. L. Xin, H. M. Zheng and B. Wang, J. Power Sources, 2013, 232, 152–158 CrossRef CAS PubMed.
  17. M. Nasibi, M. A. Golozar and G. Rashed, J. Power Sources, 2012, 206, 108–110 CrossRef CAS PubMed.
  18. S. H. Liu, Z. Y. Wang, C. Yu, H. B. Wu, G. Wang, Q. Dong, J. S. Qiu, A. Eychmüller and X. W. Lou, Adv. Mater., 2013, 25, 3462–3467 CrossRef CAS PubMed.
  19. D. Deng, M. G. Kim, J. Y. Lee and J. Cho, Energy Environ. Sci., 2009, 2, 818–837 CAS.
  20. J. I. Lee, N. S. Choi and S. Park, Energy Environ. Sci., 2012, 5, 7878–7882 CAS.
  21. J. S. Cheng and J. Du, CrystEngComm, 2012, 14, 397–400 RSC.
  22. B. Wang, H. B. Wu, L. Zhang and X. W. Lou, Angew. Chem., Int. Ed., 2013, 52, 4165–4168 CrossRef CAS PubMed.
  23. Y. Idota, T. Kubota, A. Matsufuji, Y. Maekawa and T. Miyasaka, Science, 1997, 276, 1395–1397 CrossRef CAS.
  24. C. H. Xu, B. H. Xu, Y. Gu, Z. G. Xiong, J. Sun and X. S. Zhao, Energy Environ. Sci., 2013, 6, 1388–1414 CAS.
  25. G. C. Huang, T. Chen, Z. Wang, K. Chang and W. X. Chen, J. Power Sources, 2013, 235, 122–128 CrossRef CAS PubMed.
  26. P. G. Li, M. Lei, X. F. Wang, H. L. Tang and W. H. Tang, J. Alloys Compd., 2008, 474, 463–467 CrossRef PubMed.
  27. J. Heising and M. G. Kanatzidis, J. Am. Chem. Soc., 1999, 121, 11720–11732 CrossRef CAS.
  28. A. Rothschild, J. Sloan and R. Tenne, J. Am. Chem. Soc., 2000, 122, 5169–5179 CrossRef CAS.
  29. H. D. Liu, P. Gao, J. H. Fang and G. Yang, Chem. Commun., 2011, 47, 9110–9112 RSC.
  30. D. W. Song, Q. H. Wang, Y. P. Wang, Y. J. Wang, Y. Han, L. Li, G. Liu, L. F. Jiao and H. T. Yuan, J. Power Sources, 2010, 195, 7462–7465 CrossRef CAS PubMed.
  31. S. M. Paek, E. J. Yoo and I. Honma, Nano Lett., 2009, 9, 72–75 CrossRef CAS PubMed.
  32. J. F. Liang, Y. Zhao, L. Guo and L. D. Li, ACS Appl. Mater. Interfaces, 2012, 4, 5742–5748 CAS.
  33. S. Y. Han, I. Y. Kim, K. Y. Jo and S. J. Hwang, J. Phys. Chem. C, 2012, 116, 7269–7279 CAS.
  34. X. Huang, J. Chen, H. Yu, R. Cai, S. J. Peng, Q. Y. Yan and H. H. Hng, J. Mater. Chem. A, 2013, 1, 6901–6907 CAS.
  35. X. L. Yang, K. C. Fan, Y. H. Zhu, J. H. Shen, X. Jiang, P. Zhao and C. Z. Li, J. Mater. Chem., 2012, 22, 17278–17283 RSC.
  36. L. Q. Tao, J. T. Zai, K. X. Wang, Y. H. Wan, H. J. Zhang, C. Yu, Y. L. Xiao and X. F. Qian, RSC Adv., 2012, 2, 3410–3415 RSC.
  37. J. J. Duan, Y. Zheng, S. Chen, Y. H. Tang, M. Jaroniecd and S. Z. Qiao, Chem. Commun., 2013, 49, 7705–7707 RSC.
  38. Y. X. Tang, X. H. Rui, Y. Y. Zhang, T. M. Lim, Z. L. Dong, H. H. Hng, X. D. Chen, Q. Y. Yan and Z. Chen, J. Mater. Chem. A, 2013, 1, 82–88 CAS.
  39. S. S. Zhang, K. Xu and T. R. Jow, J. Power Sources, 2006, 160, 1349–1354 CrossRef CAS PubMed.
  40. D. Du, J. Liu, X. Zhang, X. Cui and Y. Lin, J. Mater. Chem., 2011, 21, 8032–8037 RSC.
  41. J. Gong, X. Miao, H. Wan and D. Song, Sens. Actuators, B, 2012, 162, 341–347 CrossRef CAS PubMed.
  42. J. Liu, X. B. Meng, Y. H. Hu, D. S. Geng, M. N. Banis, M. Cai, R. Y. Li and X. L. Sun, Carbon, 2013, 52, 74–82 CrossRef CAS PubMed.
  43. T. Q. Lin, Y. F. Tang, Y. M. Wang, H. Bi, Z. Q. Liu, F. Q. Huang, X. M. Xie and M. H. Jiang, Energy Environ. Sci., 2013, 6, 1283–1290 CAS.
  44. W. S. Hummers and R. E. Offeman, J. Am. Chem. Soc., 1958, 80, 1339 CrossRef CAS.
  45. Z. Y. Wang, Y. Lu, S. Yuan, L. Y. Shi, Y. Zhao, M. H. Zhang and W. Deng, J. Colloid Interface Sci., 2013, 396, 9–15 CrossRef CAS PubMed.
  46. Y. Lu, Z. Y. Wang, S. Yuan, L. Y. Shi, Y. Zhao and W. Deng, RSC Adv., 2013, 3, 11707–11714 RSC.
  47. P. C. Lian, X. F. Zhu, S. Z. Liang, Z. Li, W. S. Yang and H. H. Wang, Electrochim. Acta, 2010, 55, 3909–3914 CrossRef CAS PubMed.
  48. S. Park, J. An, I. Jung, R. D. Piner, S. J. An, X. Li, A. Velamakanni and R. S. Ruoff, Nano Lett., 2009, 9, 1593–1597 CrossRef CAS PubMed.
  49. O. A. Vargas, C. A. Caballero and J. Morales, Nanoscale, 2012, 4, 2083–2092 RSC.
  50. P. G. Ren, D. X. Yan, X. Ji, T. Chen and Z. M. Li, Nanotechnology, 2011, 22, 055705 CrossRef PubMed.
  51. K. C. Leonard, W. E. Suyama and M. A. Anderson, Langmuir, 2012, 28, 6476–6484 CrossRef CAS PubMed.
  52. M. Nasibi, M. A. Golozar and G. Rashed, J. Power Sources, 2012, 206, 108–110 CrossRef CAS PubMed.
  53. J. Hu, H. Li and X. Huang, Solid State Ionics, 2007, 178, 265–271 CrossRef CAS PubMed.
  54. J. S. Xue and J. R. Dahn, J. Electrochem. Soc., 1995, 142, 3668–3677 CrossRef CAS PubMed.
  55. T. L. Barr, J. Phys. Chem., 1978, 82, 1801–1810 CrossRef CAS.
  56. Y. S. Luo, J. S. Luo, J. Jiang, W. W. Zhou, H. P. Yang, X. Y. Qi, H. Zhang, H. J. Fan, Y. W. Yu, C. M. Li and T. Yu, Energy Environ. Sci., 2012, 5, 6559–6566 CAS.
  57. E. J. Yoo, J. Kim, E. Hosono, H. S. Zhou, T. Kud and I. Honma, Nano Lett., 2008, 8, 2277–2282 CrossRef CAS PubMed.
  58. J. C. Meyer, A. K. Geim, M. I. Katsnelson, K. S. Novoselov, T. J. Booth and S. Roth, Nature, 2007, 446, 60–63 CrossRef CAS PubMed.
  59. J. Lu, J. B. Zang, S. X. Shan, H. Huang and Y. H. Wang, Nano Lett., 2008, 8, 4070–4074 CrossRef CAS PubMed.
  60. K. Matsui and M. Ohgai, J. Am. Ceram. Soc., 2000, 83, 1386–1392 CrossRef CAS.
  61. I. Kasatkin, F. Girgdies, T. Ressler, R. A. Caruso, J. H. Schattka, J. Urban and K. Weiss, J. Mater. Sci., 2004, 39, 2151–2157 CrossRef CAS.

Footnote

Electronic supplementary information (ESI) available: FT-IR patterns of GRZ-1, GRZ-2, GRZ-3, GRZ-4 and GRZ-5; TEM of GRZ-1, GRZ-2, GRZ-4 and GRZ-5; CV of GRZ-3 at 1 mV s−1; Coulomb efficiencies of GR, ZrO2 and GRZ-3. See DOI: 10.1039/c3ra47653g

This journal is © The Royal Society of Chemistry 2014