DOI:
10.1039/C3RA47617K
(Paper)
RSC Adv., 2014,
4, 12353-12361
Effects of morphology on the thermoelectric properties of Al-doped ZnO†
Received
13th December 2013
, Accepted 14th February 2014
First published on 17th February 2014
Abstract
The nanoparticles of Al-doped ZnO were successfully grown into rod-like and platelet-like morphologies by soft chemical routes. These powders were consolidated using spark plasma sintering (SPS) technique. The samples consolidated from rods and platelets exhibited characteristic structures with preferential orientation while the sample consolidated from nanoparticles did not show any sign of preferential orientation. The measured ZT values along the preferred orientation directions were found to be 0.16 and 0.25 at 1223 K for the samples consolidated from rods and platelets, respectively. The sample consolidated from nanoparticles exhibited fine grains and highly distributed nanoprecipitates, resulting in a ZT value of 0.3 at 1223 K due to the lower thermal conductivity resulting from nanostructuring. Using the simple parabolic band model and Debye–Callaway thermal transport model, the anisotropic properties of the nanostructured samples were elucidated and the influence of the grain size and nanoprecipitates on the electron and phonon transport was analyzed and discussed in detail.
Introduction
Thermoelectricity provides a promising opportunity for recovering electrical power from waste heat.1–4 It improves the energy efficiency of many systems and reduces CO2 emission. For industrial processes like those involving petroleum, steel manufacturing, transportation etc., there is an abundance of exploitable high temperature (above 500 °C) waste heat, which may be converted to usable electrical power by high temperature thermoelectric power generation. The conversion efficiency of a thermoelectric power generator is related to the dimensionless figure-of-merit (ZT) of the constituent thermoelectric materials, depending on the intrinsic transport properties (i.e., the Seebeck coefficient (S), electrical conductivity (σ), and thermal conductivity (κ)) of the materials as ZT = S2σT/κ.
There are a few potential candidates for high temperature thermoelectric waste-heat recovery applications. Na doped PbTe–SrTe (4 mol%) holds the record for the highest thermoelectric ZT value of 2.2 at 915 K,5 and SiGe,6,7 half-heusler alloys,8,9 multiple-filled skutterudites10,11 were also reported to show ZT values near or surpassing 1. However, a few issues like the price, toxicity and stability in air hinders the large-scale applications of these materials. Oxide thermoelectric materials are alternatives to these materials, and their constituting elements are generally more abundant, cheaper, and less toxic. However, relatively lower ZT values (usually lower than 0.7) are a challenging problem and urge further improvements.12 The state-of-the-art p-type oxide thermoelectric materials are the layered cobaltates, such as Ca3Co4O9−δ, which has been reported to show ZT values of 0.45 at 1000 K and 0.65 at 1247 K.13,14 For n-type oxide thermoelectric materials, the highest ZT so far is 0.65 at 1247 K obtained by bulk Zn0.96Al0.02Ga0.02O.15
ZnO is a wide direct band gap semiconductor with high electron mobility and thermal conductivity. It exhibits the most diverse and abundant configurations of nanostructures16–21 and can be used for a wide range of applications including thermoelectrics. In technological and engineering perspectives, nanostructuring has been proven to provide an effective way to improve thermoelectric efficiency,22,23 and it has already been applied to ZnO-based materials.24–26 Doping ZnO with Al at an optimum concentration resulted in one of the highest values of power factor among thermoelectric oxides due to its excellent charge carrier transport properties.27,28 By introducing nanostructures using ZnO nanoparticles, Al-doped ZnO could obtain a low thermal conductivity of ∼2 W m−1 K−1 at room temperature and a projected ZT ∼ 0.44 at 1000 K was reported.24
However, the complex correlations between the nanostructures and the thermoelectric properties of Al-doped ZnO were not yet fully elucidated. In order to quantitatively estimate the effect of the structural features including nanograins and nanoprecipitates on the electrical and thermal transport in a bulk Al-doped ZnO, we synthesized samples with uniform and textured grains instead of random grains by means of using spark plasma sintering in combination of starting particles with different morphologies: rods, platelets and nanoparticles. The thermoelectric properties of the samples were carefully measured and analyzed with considerations of anisotropy. Microstructure information was used in the model analysis as well. The suppression of lattice thermal conductivity by introducing nanostructures was demonstrated and discussed using a phonon transport simulation.
Experimental
Preparation of samples
The Al-doped ZnO nanoparticles were synthesized by a forced-hydrolysis method. Zinc acetylacetonate and aluminum nitrate at a molar ratio of 98![[thin space (1/6-em)]](https://www.rsc.org/images/entities/char_2009.gif) :2 were dissolved in ethanol, and the solution was then refluxed. Another ethanol solution containing sodium hydroxide was added dropwise into the zinc acetylacetonate solution and the mixture was then refluxed for 1 h. After the reaction was completed, white precipitates were centrifugally washed several times with de-ionized water and ethanol. The resultant nanoparticles were then used as seeds for the synthesis of Al-doped ZnO rods and platelets, as well as starting particles for sintering. The Al-doped ZnO rods were synthesized using the nanoparticles as a seed by hydrothermal method at 160 °C for 20 h in a solution of 0.49 M ZnCl2, 0.01 mM AlCl3, (Zn/Al = 98:2) and 0.1 mM PEG20000 after adjusting the pH value to 7–8 using aqueous ammonia. The Al-doped ZnO platelets were also synthesized using the nanoparticles as a seed by hydrothermal method at 95 °C for 24 h in a solution of 0.49 M Zn(CH3COO)2·H2O, 0.01 M Al(NO3)3, (Zn/Al = 98:2), 0.1 M NaOH, and 0.17 mM sodium citrate. After hydrothermal process, the formed precipitates were centrifugally washed several times with de-ionized water and ethanol, and then dried in vacuum. Fig. 1 shows the schematic representation of formation of ZnO rods and platelets by hydrothermal synthesis. The reason why the nanoparticles were grown into rods is because in the wurtzite ZnO structure, the (001) surfaces are either Zn2+- or O2−- terminated, and during the growth process, these polarized planes attract OH− or Zn2+ ions, whereby the crystal growth along the 〈001〉 direction occurs much faster than on the other surfaces of the crystal.29 On the other hand, in the case of the platelets, covering the (001) surfaces by citrate ligands30 hindered the crystal growth along the 〈001〉 direction and the growth along other directions is relatively preferred, thereby resulting in a hexagonal plate-like shape.
:2 were dissolved in ethanol, and the solution was then refluxed. Another ethanol solution containing sodium hydroxide was added dropwise into the zinc acetylacetonate solution and the mixture was then refluxed for 1 h. After the reaction was completed, white precipitates were centrifugally washed several times with de-ionized water and ethanol. The resultant nanoparticles were then used as seeds for the synthesis of Al-doped ZnO rods and platelets, as well as starting particles for sintering. The Al-doped ZnO rods were synthesized using the nanoparticles as a seed by hydrothermal method at 160 °C for 20 h in a solution of 0.49 M ZnCl2, 0.01 mM AlCl3, (Zn/Al = 98:2) and 0.1 mM PEG20000 after adjusting the pH value to 7–8 using aqueous ammonia. The Al-doped ZnO platelets were also synthesized using the nanoparticles as a seed by hydrothermal method at 95 °C for 24 h in a solution of 0.49 M Zn(CH3COO)2·H2O, 0.01 M Al(NO3)3, (Zn/Al = 98:2), 0.1 M NaOH, and 0.17 mM sodium citrate. After hydrothermal process, the formed precipitates were centrifugally washed several times with de-ionized water and ethanol, and then dried in vacuum. Fig. 1 shows the schematic representation of formation of ZnO rods and platelets by hydrothermal synthesis. The reason why the nanoparticles were grown into rods is because in the wurtzite ZnO structure, the (001) surfaces are either Zn2+- or O2−- terminated, and during the growth process, these polarized planes attract OH− or Zn2+ ions, whereby the crystal growth along the 〈001〉 direction occurs much faster than on the other surfaces of the crystal.29 On the other hand, in the case of the platelets, covering the (001) surfaces by citrate ligands30 hindered the crystal growth along the 〈001〉 direction and the growth along other directions is relatively preferred, thereby resulting in a hexagonal plate-like shape.
 |
| | Fig. 1 Schematic representation of ZnO rods and platelets formation by hydrothermal synthesis. | |
Eight grams of each of the as-prepared Al-doped rods, platelets, and nanoparticles was individually loaded into a cylindrical graphite die of 12.7 mm in diameter, horizontally shaken for a few minutes and then pressed at an applied pressure of 50 MPa. A schematic of the preparation process is shown in Fig. 2. A spark plasma sintering (SPS) system of Dr Sinter 515S (Syntex Inc., Japan) was used to consolidate the samples. The following SPS parameters used were those optimized in our previous work31,32 as follows: constant uniaxial pressure, 50 MPa; holding temperature, 1223 K; holding time, 8 min; constant ramping rate, 130 K min−1. The consolidated bulk samples using the rods, platelets and nanoparticles as starting particles will be denoted as ‘Rod’, ‘Platelet’ and ‘Nanoparticle’ samples, respectively. For all the samples after SPS densification, the densities were measured as ∼90% of the theoretical density.
 |
| | Fig. 2 Schematics of the consolidation process for (a) rods, (b) platelets and (c) nanoparticles, respectively. The consolidated samples of the rods and platelets were cut and characterized along both perpendicular (⊥p) and parallel (‖p) directions to the pressure axis. The anisotropy of the consolidated sample of the nanoparticles was negligible. | |
Measurements
Disc-shaped Rod and Platelet samples with a thickness of ∼1.1 cm were cut into rectangular and square shapes, both parallel (‖p) and perpendicular (⊥p) to the pressure direction, as shown in Fig. 2, in order to measure the electrical conductivity (σ), Seebeck coefficient (S), carrier concentration (n), and thermal conductivity (κ) along the same direction for the determination of ZT in the specific directions. As for the Nanoparticle sample, the anisotropy was found to be negligible. For all the samples, the electrical conductivity and Seebeck coefficient were measured simultaneously using an RZ-2001i (OZAWA, Japan) from room temperature up to 1223 K in air. The Hall measurement was carried out at room temperature by van der Pauw method with a superconducting magnet (5.08 T). The thermal conductivity (κ) was determined from the thermal diffusivity (α), the mass density (ρ) and the specific heat capacity (Cp) according to the equation κ = αρCp. The thermal diffusivity was obtained by the laser flash method (Netzsch LFA-457, Germany), the mass densities of the samples were measured by Archimedes' method using water with surfactant, and the specific heat capacity was measured using a differential scanning calorimeter (Netzsch DSC 404C, Germany). The sound velocity in the samples was measured using ultrasonic sing-around method33 on an Ultrasonic Industries Co. Ltd., UVM-2. X-ray diffraction (XRD) pattern was obtained using a Bruker D8 diffractometer (Bruker, Germany) with Cu-Kα radiation. A scanning electron microscope (SEM, Supra; Carl Zeiss, Inc., Germany) was used to observe the microstructures of the samples. TEM analysis was conducted in the bright-field mode using a transmission electron microscope (model JEM-3000F) operating at an acceleration voltage of 200 kV. Elemental maps were obtained in STEM mode using EDS microanalysis.
Results and discussions
Structural properties
Rod samples. SEM images of the Al doped ZnO rods are shown in Fig. 3a. The hydrothermally grown crystals appear to have a hexagonal rod-like morphology with a preferential growth along the 〈001〉 axis. The rods were measured to be ∼25 μm in length and ∼4 μm in width. Transmission electron microscopy (TEM) and selected-area electron-diffraction of the rods (see Fig. 3b and c) indicate that each ‘rod’ is single crystalline in the wurtzite structure, as confirmed also by powder X-ray diffraction of the rods (see Fig. S1 in ESI†). Fig. 3d and e show the fracture surface of the consolidated bulk sample. The surface perpendicular to the pressure axis (denoted as Rod (⊥p)) consists of rod-shaped ZnO grains with an average size of ∼10 μm in length and ∼4 μm in width (see Fig. 3d). Some fine particles with sizes varying from 100 nm to 300 nm were observed to precipitate mostly along the gain boundaries as shown in the inset of Fig. 3d and e. EDX analysis shows that the precipitates are enriched in Al (see Fig. S3 in ESI†). The precipitates were either formed during the hydrothermal treatment or during sintering as a byproduct of the reaction between ZnO and Al2O3 as previously discussed in our earlier work.32 Similar precipitates were also observed and identified as ZnAl2O4 gahnite phase using TEM by Nam et al.25 The fracture surface parallel to the pressure axis (denoted as Rod (‖p)) consists of fine grains of ∼4 μm in size, which is similar to the width of the rods. It is also shown in the inset of Fig. 3d and e that the size and distribution of the precipitates are similar regardless of the directions of the fracture surfaces.
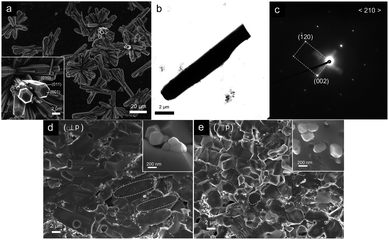 |
| | Fig. 3 (a) SEM images of hydrothermally grown Al-doped ZnO rods. (b) TEM image of a single rod and (c) its electron diffraction pattern along the 〈210〉 direction, indicating the wurtzite structure. SEM images of the fracture surfaces of the Rod sample (d) perpendicular (⊥p) and (e) parallel (‖p) to the pressure axis. | |
Platelet samples. Hexagonally shaped platelets were synthesized with an average diameter and thickness of 800 nm and 100 nm, respectively, as shown in Fig. 4a. A TEM image and selected-area electron diffraction of a single platelet indicate the existence of a single crystal with a wurtzite structure (see Fig. 4b and c). Fig. 4d and e show the fracture surface of the bulk sample consolidated from Al doped ZnO platelets. The fracture surface perpendicular to the pressure axis (denoted as Platelet (⊥p)) consists of uniform grains with similar sizes as those seen in Fig. 4a. Nanosized precipitates and nano voids with an average size of 30 nm can be seen in the insets of Fig. 4d and e. The surface parallel to the pressure axis (denoted as Platelet (‖p)) reveals a laminated structure as a result of compressing the ZnO platelets, indicating the preferential orientation of the grains (see Fig. 4e).
 |
| | Fig. 4 (a) SEM images of hydrothermally grown Al doped ZnO platelets. (b) A TEM image of a single platelet and (c) its electron diffraction pattern along the 〈001〉 direction, indicating the wurtzite structure. SEM images of the fracture surfaces of the Platelet sample (d) perpendicular (⊥p) and (e) parallel (‖p) to the pressure axis. | |
Nanoparticle samples. Fig. 5a shows the HRTEM image of the Al doped ZnO nanoparticles. It reveals that each nanoparticle is a single crystal in the wurtzite structure, which is also consistent with the powder X-ray diffraction data, as shown in Fig. S1 in ESI.† The average particle size is estimated to be ∼8 nm by using XRD Rietveld refinement and it is consistent with the TEM observation (see Fig. 5b). The EDX mapping by STEM reveals the existence of Al-containing nanoparticles (see Fig. S2b in ESI†). The as-prepared ZnO nanoparticles in the present study are similar in sized to that of Meulenkamp's work,34 which are much smaller than those fabricated by Jood et al.24 and Nam et al.25 Fig. 5d and e show the fractured surface of the bulk sample consolidated from Al-doped ZnO nanoparticles (denoted as Nanoparticle). Besides the ZnO grains with the size of several hundred nanometers, there exist highly distributed nano precipitates with sizes from 10 to 15 nm, both within the ZnO grain interiors or along the grain boundaries. Compared with other Al-doped ZnO nanocomposites synthesized by Jood et al. and Nam et al., the nanoprecipitates shown in this work is 10 to 20 times smaller in size,24,25 presumably due to the much smaller precursors in combination with a short densification time of SPS used in this work.
 |
| | Fig. 5 (a) An HRTEM image of Al-doped ZnO nanoparticles. (b) A TEM image of the nanoparticles and (c) its selected-area electron diffraction pattern. (d) An SEM image of a bulk consolidated fracture surface of the Nanoparticle sample consolidated from nanoparticles. (e) A high magnification SEM image of the Nanoparticle sample showing highly dispersed nanoprecipitates within the ZnO nanograins. | |
X-ray diffraction patterns of the consolidated samples are shown in Fig. 6. All observed XRD peaks can be assigned to those of pure ZnO phase (ICDD card PDF#36-1451), though the relative intensity of some peaks may vary due to the preferred orientation. For example, the intensity ratio of the (002)/(100) peaks in Rod (⊥p) was ≪ 1, while that of Platelet (⊥p) was ≫ 1. To evaluate the degree of orientation of the samples, the volume fraction of a-axis-oriented grains, α(100), and that of c-axis-oriented grains, α(001), in the samples were calculated using the following equations:35
| | |
α(100) = ∑(In00/I*n00)/∑(Ihkl/I*hkl)
| (1) |
| | |
α(001) = ∑(I00n/I*00n)/∑(Ihkl/I*hkl)
| (2) |
where
Ihkl is measured intensity of the (
hkl) peak and
I*hkl is the intensity of the randomly oriented powders. The results of the degrees of orientation are shown in the inset of
Fig. 6. The Rod (‖p) and Platelet (⊥p) have higher degrees of (001) grains orientation. The degrees of (100) grains orientation are higher for the Rod (⊥p) and the Platelet (‖p) samples. The Nanoparticle sample consolidated from ZnO nanoparticles shows negligible anisotropy in this analysis as expected. It also reveals that the preferred orientation of the Platelet sample is stronger than the Rod sample. The results showed in the inset of
Fig. 6 are consistent with the SEM observation.
 |
| | Fig. 6 X-ray diffraction patterns of the samples. The inset shows the degrees of orientation and the unit cell volume. The red and blue columns indicate the degrees of (100) orientation and (001) orientation, respectively. | |
The lattice parameters were from the Rietveld refinement of the XRD patterns. The results of unit cell volume are plotted in the inset in Fig. 6. The decrease of the unit cell volume is probably due to the substitutions of Al3+ at the Zn site, as the ionic radius of Al3+ (0.039 nm, 4-fold coordination) is much smaller than that of Zn2+ (0.060 nm, 4-fold coordination).36 The smaller unit cell volume of the Rod sample suggests a possibility of a larger substitution fraction. A direct consequence of a larger substitution fraction is a higher carrier concentration, which will be discussed in the following section.
Thermoelectric properties
The electrical conductivity (σ) of the consolidated samples is shown in Fig. 7. The Rod and Platelet samples showed a metallic conduction behavior. The electrical conductivity measured along different directions varied due to the preferred orientation of the Rod and Platelet samples. Both samples showed a higher σ along the 〈⊥p〉 direction, by a factor of 1.7 and 2.5 for Rod and Platelet samples, respectively, than along the 〈‖p〉 direction. The Rod (⊥p) sample showed a high conductivity of 6409 S cm−1 at room temperature, higher than any other σ values reported from Al-doped ZnO.25–27,32 The Nanoparticle sample showed a semiconductor-like electrical conductivity. The σ value increased with increasing temperature due to the thermal excitation of shallow donors at ∼45.6 meV below the conduction band-edge, as derived from the activation energy of the electrical conductivity.24
 |
| | Fig. 7 Temperature dependence of the electrical conductivity of the samples, a clear anisotropy of the Rod and Platelet samples being observed. | |
A room temperature Hall measurement was carried out to determine the carrier concentration (n) of the samples. As shown in Fig. 8, the carrier concentration did not show anisotropy for these samples. The charge carrier concentration of the Rod sample is higher than that of the Platelet sample. There is a possibility of the different substitution fraction of Al3+ ions at the Zn sites in these two samples. This substitution not only causes the shrinkage of the unit cell, but also donates excessive electrons for conduction. As the shrinkage increases, the electron carrier concentration increases as well (see Fig. 6 and 8). The n values of these samples are higher than 1020 cm−3, indicating that they are degenerate semiconductors. The carrier mobility along the 〈⊥p〉 direction was found to be more than two times higher than that along the 〈‖p〉 direction for both Rod and Platelet samples. These findings suggest that the grain boundary scattering plays a key role for the difference in the carrier mobility in accordance with the microstructure observation. It is also noteworthy to point out that a higher mobility of 65 cm2 V−1 s−1 was obtained for Platelet (⊥p) as compared with 45 cm2 V−1 s−1 for Rod (‖p), although the average grain size of Platelet (⊥p) is smaller. This can be explained by the higher degrees of orientation in Platelet (⊥p), and hence the grain boundaries in Platelet (⊥p) may have less impact on the transport of electrons, similar observations has been previously reported.37–39 Presumably affected by intensive boundary and impurity defect scattering, the carrier mobility of the Nanoparticle sample was the smallest among all the samples in this study. The n value of the Nanoparticle sample was also found to be the smallest. This tendency is consistent with the previous discussion on the Al3+ ion substitutions. A lower substitution fraction may cause a smaller shrinkage of the unit cell volume, as well as a lower electron carrier concentration.
 |
| | Fig. 8 The carrier concentration and carrier mobility of the samples at room temperature. The inset shows the monotonic increase of the power factor with increasing carrier mobility. | |
Fig. 9a shows the temperature dependence of the Seebeck coefficients (S) of the samples. The S values for the Rod and Platelet samples showed negligible anisotropy. This behavior is consistent with the theoretical calculations based on the Boltzmann transport theory.40 According to the Pisarenko relation for degenerated semiconductors,
| |
 | (3) |
where
kB is the Boltzmann constant,
T is the absolute temperature,
h is Planck's constant,
q is the unit charge of electron,
m* is the effective mass. As smaller
n results in bigger |
S|, the Platelet samples had a larger |
S| values than the Rod samples. By plotting the room temperature
S vs. n−2/3,
m* of the samples can be estimated to be between 0.43
me and 0.35
me, as shown in the inset of
Fig. 9a. The estimation of the effective mass is consistent with the results obtained by Kim
et al.41 However, the Pisarenko relation is based on carrier degeneracy, and hence
m* for the Nanoparticle sample is only a rough approximation. According to the measured
n and estimated
m* values, a simple parabolic band model
42 can be applied by employing the following equations:
| |
 | (4) |
| |
 | (5) |
| |
 | (6) |
where
Fλ(
ξ) is the Fermi integral and
ξ is the reduced electrochemical potential.
λ is a scattering parameter and 0 is assumed for acoustic phonon scattering, 1 for optical phonons scattering, and 2 for ionized impurity scattering.
42 At room temperature, the calculated
S values as a function of carrier concentration are shown in
Fig. 9b. The three lines correspond to the three different scattering mechanisms. The
S values for the Rod and Platelet samples corresponds very well with the calculation when
λ = 0, indicating that the acoustic phonon scattering is the dominating scattering mechanism. The
S value for Nanoparticle sample lies below the calculated values for all the above scattering mechanisms, implying strong scattering by highly distributed grain boundaries and densely dispersed nanoprecipitates.
 |
| | Fig. 9 (a) Temperature dependence of the Seebeck coefficient of the samples. The inset shows the plot of the room temperature Seebeck coefficient vs. (carrier concentration)−2/3. The colored diagonal lines correspond to the theoretical relationship when m*/me = 0.43 and 0.35 according to the Pisarenko relation. (b) The Seebeck coefficient plotted as a function of the carrier concentration. The solid colored lines are the calculated values for λ = 0, 1, and 2, denoting electron scattering by acoustic phonons, optical phonons, and ionized impurities respectively. | |
Fig. 10a shows the thermal conductivity as a function of temperature for all the samples. The measured data of the thermal diffusivity and specific heat at a constant pressure are shown in Fig. S4 and S5 in ESI.† The apparent effect of anisotropy on the thermal conductivity can be observed from the Rod and Platelet samples. The κ values measured along the pressure axis (‖p) for both samples are relatively smaller compared with the values measured perpendicular to the pressure axis (⊥p) over the whole temperature range. The Nanoparticle sample showed significantly small κ values of 8.46 W m−1 K−1 at 373 K and 3.21 W m−1 K−1 at 1223 K, which are roughly 1/5 and 1/2 as large as those for the Rod (⊥p) sample at 373 K and 1223 K, respectively. These small κ values are comparable to those previously reported for the Al-doped ZnO nanocomposites.24–26 For the reference, the theoretical lower limit of the lattice thermal conductivity, κmin, for Zn0.98Al0.02O was calculated to be 1.22 W m−1 K−1 as shown in Fig. 10a. To estimate the lattice contribution κL to the total κ, the following equation was applied:
| | |
κL = κ − κe = κ − LoσT
| (7) |
where
κe is the electron component of
κ. The degenerate limit of the Lorenz number is given by
Lo = (π
2kB2/3)/
q2 = 2.45 × 10
−8 W Ω K
−2, and is valid only at high degeneracy regardless of the carrier scattering mechanism. At high temperatures, this value typically results in an overestimation of
κe. In this case, the following equation was used for the calculation of
Lo:
42| |
 | (8) |
where
Fn denotes
Fn(
ξ). The results of these calculations for the different morphologies are shown in the inset of
Fig. 10a. The
Lo values are consistently smaller than the degenerate limit and monotonically decrease with increasing temperature. By using
eqn (7), the
κL values can be extracted, as shown in
Fig. 10b. The values of
κL are somehow similar to the values of
κ, indicating that the lattice component dominates the thermal conductivity for all the samples. The Nanoparticle sample shows the lowest
κL among all the samples in this study, and a clear anisotropy of
κL can be observed for the Rod and Platelet samples. The Debye–Callaway model
43–46 was used to calculate the lattice thermal conductivity using parameters obtained by microscopy (see ESI
†). The calculated values are shown as solid lines in
Fig. 10b, agreeing well with the experimental data. The calculations indicated that the anisotropy of
κL for the Rod and Platelet samples was mainly caused by grain boundaries. The grain sizes along the pressure axis are nearly 5 to 8 times smaller than those in the perpendicular direction, which resulted in a smaller phonon mean free path along this direction. The calculation also clearly shows the temperature-dependent anisotropic behavior of
κL for the Rod and Platelet samples, where
κL along the (⊥p) and (//p) directions differs noticeably at 300 K, but the difference became smaller and unobvious above 800 K. As for the Nanoparticle sample, very low
κ can be attributed to the strong phonon scattering from nano-grains, point defects and densely dispersed nanoprecipitates.
 |
| | Fig. 10 (a) Temperature dependence of the thermal conductivity of the samples. The inset shows the calculated Lorenz number of the samples as a function of temperature. The lower limit of the lattice thermal conductivity, κmin, for Zn0.98Al0.02O was calculated using Cahill's equation (dashed line). (b) Temperature dependence of lattice thermal conductivity of the samples. The solid color lines are the calculated values using the Debye–Callaway model. | |
To further analyze the effects of grain boundaries and nanoprecipitates on phonon scattering, κL at three different temperature (273 K, 673 K, and 1223 K) was plotted as a function of grain size using the Debye–Callaway model (as shown in Fig. 11a). The calculated values agree with the experimental values in this study. By changing the grain size from 100 μm to 10 nm, κL at 273 K reduced significantly, but κL at 1223 K was hardly affected. This is consistent with some results reported previously, showing that the nano-scaled grains have a limited effect to reduce lattice thermal conductivity at high temperature region, where the phonon–phonon scattering dominates.47,48 As for the phonon scattering by nanoprecipitates, κL vs. nanoprecipitates particle concentration was also plotted as shown in Fig. 11b κL at both 273 K and 1223 K decreased noticeably with increasing particle concentration. The phonon scattering by grain boundaries and nanoprecipitates can be illustrated by plotting the phonon mean free path (MFP) vs. normalized phonon frequency (ħω/KBT) as shown in Fig. 11c and d. The dashed lines are the reference MFP values without neither grain boundary scattering nor nanoprecipitate scattering. When grain boundary scattering takes place, given the grain size of 400 nm, the phonon MFP at the low frequency region reduces significantly, leaving the high frequency phonons nearly unaffected (see the blue area in Fig. 11c); when nanoprecipitates scattering takes place, given the size of 10 nm and concentration of 1.4 × 10²⁰ m−3, the phonon MFP at both intermediate and high frequency regions decreases moderately (see the red area Fig. 11c). At 1223 K, however, the grain boundary scattering becomes very limited, while the scattering from nanoprecipitates is still very well pronounced (see the red area in Fig. 11d). It indicates that, the grain boundaries selectively depress the phonon spectrum at the low frequency region, while the nanoprecipitates selectively depress the phonon spectrum at the intermediate and high frequency region. By combining the two scattering mechanisms, the entire phonon spectrum can be effectively dampened. The Nanoparticle sample could have benefited from the combined scattering mechanisms. The low frequency phonons were scattered by nanograins, and the middle to high frequency phonons were scattered by point defects and highly dispersed nanoprecipitates. Thus the sample showed the strongly suppressed lattice thermal conductivity. The above observations and discussion are consistent with the work by Biswas et al.5
 |
| | Fig. 11 Calculated lattice thermal conductivity plotted as a function of (a) grain size, and (b) nanoprecipitate particle concentration at different temperatures. The calculated mean free path (MFP) of the phonons was plotted as a function of normalized phonon frequency at (c) 273 K and (d) 1223 K. The dots in (a) are experimental values of Rod (⊥p), Rod (‖p), Plate (⊥p), and Plate (‖p), with grain sizes of 10 μm, 2 μm, 600 nm and 150 nm, respectively; the dashed lines in (c) and (d) are the reference MFP values without phonon scattering by neither grain boundaries nor nanoprecipitates, and the solid lines are predicted values when phonon scattering by either nanoprecipitates or grain boundaries dominates. | |
The ZT values thus obtained are shown in Fig. 12. Due to the preferential orientation of the Rod and Platelet samples, they showed different ZT values along the different measured directions. The (⊥p) direction of both samples showed higher ZT values than the (‖p) direction, reaching 0.2 to 0.25 at 1223 K. The Platelet sample showed higher ZT values than the Rod sample along either measurement directions. The Nanoparticle sample was benefited from low κ of 3.2 W m−1 K−1 at 1223 K, and its electrical conductivity and Seebeck coefficient increased significantly with increasing temperature, attaining a power factor of 7.97 × 10⁻⁴ W m−1 K−2 at 1223 K. Thus the sample showed a peak ZT of 0.3 at 1223 K, which is comparable to the ZT values achieved by Al-doped ZnO bulk materials26,27 but somehow lower than those of some other Al-doped ZnO nanocomposites reported.24,25 As demonstrated in this paper, the Rod and Platelet samples exhibited fairly high electrical transport properties along the preferred directions due to the alignment of the micron-scale grains. However these grains are less effective to scatter high frequency phonons at high temperatures. On the other hand, the Nanoparticle sample with highly dispersed nanoprecipitates exhibited the strong suppression of the lattice thermal conductivity due to the effective scattering of phonons. It indicates that a combination of these features, the alignment of micron-scale anisotropic grains and highly dispersed nanoprecipitates within/around them, would be a promising way to maintain sufficient electrical transport properties with suppressing the lattice thermal conductivity, thus being capable of improving ZT of Al-doped ZnO further.
 |
| | Fig. 12 Temperature dependence of figure-of-merit, ZT, of the samples. | |
Conclusions
Nanostructured Al-doped ZnO nanostructured bulk samples were fabricated using precursors with different morphologies and SPS consolidation. Those fabricated from rods and platelets as starting powders exhibited textured microstructures and anisotropic thermoelectric properties. The anisotropy of the electrical and thermal conductivities was attributed to the grain boundary scattering in the samples with preferred orientation of the anisotropic grains, which are interacting in a different manner with the electron and phonon conduction. The Platelet sample with aligned laminar grains showed a superior ZT value of 0.25 at 1223 K along the preferred (⊥p) direction, which is ∼47% higher than our previously made non-textured bulk samples.32 The Nanoparticle sample exhibited fine structure of micron-scaled grains and nanoprecipitates. A ZT value of 0.3 at 1223 K was attained by the low κ. By using the Debye–Callaway model in combination with the experimental observations, the influence of grain boundaries and nanoprecipitates on the heat transport was investigated. The results showcased the selective depression of the phonon spectrum by grain boundary and nanoprecipitate scattering, also being capable of explaining the low κ obtained by the Nanoparticle sample as well as the anisotropic κL of the Rod and Platelet samples. This work elucidated the effect of the structural features on the electron/phonon transport properties of Al-doped ZnO bulks, and provided a promising approach to further improve the thermoelectric properties of Al-doped ZnO. However, the long-term stability of the tailored nanostructures was not included in this work since it is still under investigation, and further strategy for improving the high temperature thermoelectric efficiency of ZnO-based materials will be employed in our future work.
Acknowledgements
The authors would like to thank the Programme Commission on Energy and Environment (EnMi) which is part of the Danish Council for Strategic Research (Contract no. 10-093971) for sponsoring the OTE-POWER research work.
Notes and references
- B. Poudel, Q. Hao, Y. Ma, Y. C. Lan, A. Minnich, B. Yu, X. Yan, D. Z. Wang, A. Muto, D. Vashaee, X. Y. Chen, J. M. Liu, M. S. Dresselhaus, G. Chen and Z. F. Ren, Science, 2008, 320, 634 CrossRef CAS PubMed.
- H. J. Goldsmid, in Thermoelectric Refrigeration, Plenum, New York, 1964 Search PubMed.
- T. M. Tritt, Science, 1999, 283, 804 CrossRef CAS.
- G. J. Snyder and E. S. Toberer, Nat. Mater., 2008, 7, 105 CrossRef CAS PubMed.
- K. Biswas, J. Q. He, I. D. Blum, C. Wu, T. P. Hogan, D. N. Seidman, V. P. Dravid and M. G. Kanatzidis, Nature, 2012, 489, 414 CrossRef CAS PubMed.
- G. Joshi, H. Lee, Y. C. Lan, X. W. Wang, G. H. Zhu, R. W. Gould, D. C. Cuff, M. Y. Tang, M. S. Dresselhaus, G. Chen and Z. F. Ren, Nano Lett., 2008, 8, 4670 CrossRef CAS PubMed.
- X. W. Wang, H. Lee, Y. C. Lan, G. H. Zhu, G. Joshi, D. Z. Wang, J. Yang, A. J. Muto, M. Y. Tang, J. Klatsky, S. Song, M. S. Dresselhaus, G. Chen and Z. F. Ren, Appl. Phys. Lett., 2008, 93, 193121 CrossRef PubMed.
- W. J. Xie, J. He, S. Zhu, X. L. Su, S. Y. Wang, T. Holgate, J. W. Graff, V. Ponnambalam, S. J. Poon, X. F. Tang, Q. J. Zhang and T. M. Tritt, Acta Mater., 2010, 58, 4705 CrossRef CAS PubMed.
- X. Yan, G. Joshi, W. S. Liu, Y. C. Lan, H. Wang, S. Y. Lee, J. W. Simonson, S. J. Poon, T. M. Tritt, G. Chen and Z. F. Ren, Nano Lett., 2011, 11, 556 CrossRef CAS PubMed.
- G. Rogl, A. Grytsiv, P. Rogl, E. Bauer, M. B. Kerber, M. Zehetbauer and S. Puchegger, Intermetallics, 2010, 18, 2435 CrossRef CAS PubMed.
- X. Shi, J. Yang, J. R. Salvador, M. F. Chi, J. Y. Cho, H. Wang, S. Q. Bai, J. H. Yang, W. Q. Zhang and L. D. Chen, J. Am. Chem. Soc., 2011, 133, 7837 CrossRef CAS PubMed.
- K. Koumoto, Y. F. Wang, R. Z. Zhang, A. Kosuga and R. Funahashi, Annu. Rev. Mater. Res., 2010, 40, 363 CrossRef CAS.
- Y. Wang, Y. Sui, F. Li, L. X. Xu, X. J. Wang, W. S. Su and X. Y. Liu, Nano Energy, 2012, 1, 456 CrossRef CAS PubMed.
- N. V. Nong, N. Pryds, S. Linderoth and M. Ohtaki, Adv. Mater., 2011, 23, 2484 CrossRef PubMed.
- M. Ohtaki, K. Araki and K. Yamamoto, J. Electron. Mater., 2009, 38, 1234 CrossRef CAS PubMed.
- W. Pan, Z. R. Dai and Z. L. Wang, Science, 2001, 291, 1947 CrossRef PubMed.
- X. Y. Kong and Z. L. Wang, Nano Lett., 2003, 3, 1625 CrossRef CAS.
- X. Y. Kong, Y. Ding, R. Yang and Z. L. Wang, Science, 2004, 303, 1348 CrossRef CAS PubMed.
- W. L. Hughes and Z. L. Wang, J. Am. Chem. Soc., 2004, 126, 6703 CrossRef CAS PubMed.
- P. X. Gao, J. H. Song, J. Liu and Z. L. Wang, Science, 2005, 309, 1700 CrossRef CAS PubMed.
- W. Zhang, M. Chen, L. Theil Kuhn, J. R. Bowen and J. Bentzen, ChemElectroChem DOI:10.1002/celc.201300045 , in press.
- M. S. Dresselhaus, G. Chen, M. Y. Tang, R. Yang, H. Lee, D. Wang, Z. Ren, J. Fleurial and P. Gogna, Adv. Mater., 2007, 19, 1043 CrossRef CAS.
- Y. Lan, A. J. Minnich, G. Chen and Z. F. Ren, Adv. Funct. Mater., 2010, 20, 357 CrossRef CAS.
- P. Jood, R. J. Mehta, Y. Zhang, G. Peleckis, X. Wang, R. W. Siegel, T. Borca-Tasciuc, S. X. Dou and G. Ramanath, Nano Lett., 2011, 11, 4337 CrossRef CAS PubMed.
- W. H. Nam, Y. S. Lim, S. Choi, W. Seo and J. Y. Lee, J. Mater. Chem., 2012, 22, 14633 RSC.
- M. Søndergaard, E. D. Bøjesen, K. A. Borup, S. Christensen, M. Christensen and B. B. Iversen, Acta Mater., 2013, 61, 3314 CrossRef PubMed.
- M. Ohtaki, T. Tsubota, K. Eguchi and H. Arai, J. Appl. Phys., 1996, 79, 1816 CrossRef CAS PubMed.
- T. Tsubota, M. Ohtaki, K. Eguchi and H. Arai, J. Mater. Chem., 1997, 7, 85 RSC.
- J. B. Baxter, F. Wu and E. S. Aydil, Appl. Phys. Lett., 2003, 83, 3797 CrossRef CAS PubMed.
- E. S. Jang, J. Won, S. Hwang and J. Choy, Adv. Mater., 2006, 18, 3309 CrossRef CAS.
- L. Han, T. H. Le, N. V. Nong, N. Pryds and S. Linderoth, J. Electron. Mater., 2013, 42, 1573 CrossRef CAS.
- L. Han, N. V. Nong, T. H. Le, T. Holgate, N. Pryds, M. Ohtaki and S. Linderoth, J. Alloys Compd., 2013, 555, 291 CrossRef CAS PubMed.
- M. Ohtaki and S. Miyaishi, J. Electron. Mater., 2013, 42, 1299 CrossRef CAS PubMed.
- E. A. Meulenkamp, J. Phys. Chem. B, 1998, 102, 5566 CrossRef CAS.
- C. J. Lu, Y. Qiao, Y. J. Qi, X. Q. Chen and J. S. Zhu, Appl. Phys. Lett., 2005, 87, 222901 CrossRef PubMed.
- R. D. Shannon, Acta Crystallogr., Sect. A: Cryst. Phys., Diffr., Theor. Gen. Crystallogr., 1976, 32, 751 CrossRef.
- W. S. Liu, X. Yan, G. Chen and Z. F. Ren, Nano Energy, 2012, 1, 42 CrossRef CAS PubMed.
- L. D. Zhao, B. P. Zhang, J. F. Li and W. S. Liu, Solid State Sci., 2008, 10, 651 CrossRef CAS PubMed.
- X. Yan, B. Poudel, Y. Ma, W. S. Liu, G. Joshi, H. Wang, Y. C. Lan, D. Z. Wang, G. Chen and Z. F. Ren, Nano Lett., 2010, 10, 3373 CrossRef CAS PubMed.
- K. P. Ong, D. J. Singh and P. Wu, Phys. Rev. B: Condens. Matter Mater. Phys., 2011, 83, 115110 CrossRef.
- W. M. Kim, I. H. Kim, J. H. Ko, B. Cheong, T. S. Lee, K. S. Lee, D. Kim and T. Seong, J. Phys. D: Appl. Phys., 2008, 41, 195409 CrossRef.
- A. F. May and G. J. Snyder, in Introduction to Modeling Thermoelectric Transport at High Temperatures. Thermoelectrics and its Energy Harvesting, ed. D. M. Rowe, CRC Press, Boca Raton, 2012, vol. 1, ch. 11 Search PubMed.
- J. Callaway, Phys. Rev., 1959, 113, 1046 CrossRef CAS.
- D. G. Cahill, S. K. Watson and R. O. Pohl, Phys. Rev. B: Condens. Matter Mater. Phys., 1992, 46, 6131 CrossRef CAS.
- A. Majumdar, J. Heat Transfer, 1993, 115, 7 CrossRef.
- K. S. Dubey and R. H. Misho, Phys. Status Solidi B, 1977, 84, 69 CrossRef CAS.
- W. Kim and A. Majumdar, J. Appl. Phys., 2006, 99, 084306 CrossRef PubMed.
- Y. Kinemuchi, H. Nakano, M. Mikami, K. Kobayashi, K. Watari and Y. Hotta, J. Appl. Phys., 2010, 108, 053721 CrossRef PubMed.
Footnote |
| † Electronic supplementary information (ESI) available: Additional powder X-ray diffractograms, energy dispersive X-ray spectrum, thermal diffusivity data, specific heat at constant pressure data, calculations of the theoretical lower limit of thermal conductivity, and calculations of the lattice thermal conductivity. See DOI: 10.1039/c3ra47617k |
|
| This journal is © The Royal Society of Chemistry 2014 |
Click here to see how this site uses Cookies. View our privacy policy here.