Nitrogen functionalized graphite nanofibers/Ir nanoparticles for enhanced oxygen reduction reaction in polymer electrolyte fuel cells (PEFCs)

S. Gouse Peeraa, A. K. Sahu*a, S. D. Bhata and S. C. Leeb
aCSIR – Central Electrochemical Research Institute, Chennai Centre, CSIR Campus, Taramani, Chennai, 600 113, India. E-mail: akhilakumar2008@gmail.com; Fax: +91 44 22542456; Tel: +91 44 22544556
bRobotic System Research Division, DGIST 50-1 Sang-Ri, Hyeongpung-Myeon, Dalseong-Gun, Daegu 711-873, Republic of Korea

Received 11th December 2013 , Accepted 7th January 2014

First published on 9th January 2014


Abstract

Nitrogen functionalization of graphite nanofibers (N-GNF) was performed using hexa methyl tetra amine (HMTA) as the nitrogen source and used as a support material for metal nanoparticle deposition. The successful incorporation of nitrogen was confirmed using X-ray photoelectron spectroscopy (XPS) and Raman spectroscopy analysis. Iridium (Ir) nanoparticles with a particle size of ∼2.2 nm were deposited onto N-GNF by a simple ethanol reduction method. The oxygen reduction reaction (ORR) activity of N-GNF and the ameliorating effect of ORR on Ir deposited N-GNF (Ir/N-GNF) were studied by various physicochemical and electrochemical methods. The enhancement of ORR activity for Ir/N-GNF was evidenced by high onset potentials and mass activities. The presence of nitrogen in the Ir/N-GNF catalyst facilitates quick desorption of the –OH species from the Ir surface and accelerates the electrochemical reaction of Ir particles which in turn enhances the ORR activity. The electrochemical stability of the Ir/N-GNF was investigated by repeated potential cycling up to 2500 cycles and was found to have excellent stability for ORR activity. The PEFC with Ir/N-GNF catalyst delivers a peak power density of 450 mW cm−2 at a load current density of 1577 mA cm−2, while the PEFC with Ir/GNF catalyst delivers a peak power density of only 259 mW cm−2 at a load current density of 1040 mA cm−2 under identical operation conditions.

Introduction

Polymer electrolyte fuel cells (PEFCs) are regarded as a possible alternative power source for stationary and mobile applications, due to their high power density and near-zero pollutant emission.1 In PEFCs, carbon-supported platinum (Pt) is usually used as a catalyst for the electro reduction of oxygen. Since the oxygen reduction reaction (ORR), which involves four-electron transfer, is kinetically sluggish, the significant over potential for the ORR, even on pure Pt, is in excess of 300 mV, which limits the efficiency of PEFCs.2 In addition Pt is an expensive metal, and thus there have been efforts to develop non-platinum alternative catalysts for PEFCs for more than a decade. Several promising non-precious metal catalysts, such as Co, Fe and Ru based alloy catalysts, are proposed in the literature in view of their ORR activity.3–7 Particularly, Ru based chalcogenides have shown a high ORR activity, especially when it is modified with selenium.8 In spite of this progress, very few catalysts are showing real promise to replace Pt in the real H2/O2 (air) fuel cell environment reported so far.9

Iridium (Ir), one of the most stable metal in acidic media and less expensive than Pt has been investigated as an ORR catalyst and Ir-based metal oxides are also widely used in water electrolysis for their high activity for oxygen evolution reaction (OER).10,11 Calle-Vallejo et al., studied nitrogen functionalized graphitic carbon materials along with transition metals and their complexes for ORR and OER by density functional theory analysis. In this study, the active sites composed of Ir metal seemed to be more active for ORR and OER than other transition metals found in their volcano plot.12 Chang et al. prepared iridium oxide nanoparticles supported on Vulcan XC-72 carbon and a PEFC with this catalyst delivered a power density of only 20 mW cm−2 in H2–O2 fuel cells operated at 60 °C.13,14 Generally, the surface of Ir has a strong affinity for –O and –OH species, forming a surface with high oxide coverage even at a low potential. The formation of Ir–O/–OH species is responsible for the low ORR activity. To overcome this issue, studies were conducted to enhance the Ir nanoparticles activity for the ORR. For instance Gang Liu et al. modified the Ir nanoparticles with selenium which could effectively hinder the formation of oxide on the Ir surface and can deliver a power density of 500 mW cm−2 in a H2–O2 fuel cell.15 In another study, J. Qiao et al. deposited Ir nanoparticles on a vanadium modified carbon support and demonstrated improved ORR activity. In this case, vanadium acts as an oxygen adsorption site and electro bridge with Ir in promoting improved ORR activity. The modified catalyst showed improved catalytic activity and selectivity following the four electron reduction of O2 to H2O. A maximum power density of 517 mW cm−2 was achieved, although the exact structure of the vanadium surface modification has not yet been identified.16 This report is the second best H2-PEFCs performance on low and non-platinum electrocatalysts for PEFCs, as in a recent review by Brouzgou et al.17

In this work, investigation on improving the ORR activity of Ir by taking the advantage of a co-catalytic system of nitrogen doping of the GNF surface was carried out. It is established that the surface hydroxyl groups of N-GNF could effectively help in fast desorption of the –O/–OH intermediates from the metal surface, which in turn enhances the ORR activity.18 Furthermore, N-GNF efficiently introduces chemically active sites for use in catalytic reactions, which improves the dispersion of metal nanoparticles,18–28 enhances electric conductivity and helps in improving the adhesion of metal nanoparticles.18–29 It is noteworthy, that the electrochemical stability of the Ir/N-GNF catalyst after 2500 repeated potential cycling exhibited almost no degradation of ORR activity, representing excellent stability in acidic conditions. When using this catalyst in fuel cell performance, a peak power density of 450 mW cm−2 at a load current density of 1577 mA cm−2 was achieved for a H2/O2 fuel cell environment at 70 °C and ambient pressure.

Experimental

Materials

Graphite nanofibers (GNF) and hexa methyl tetra amine (HMTA) were purchased from Sigma-Aldrich, while iridium trichloride, methanol and NaOH were obtained from Acros Organics. Pt/C (40 wt% Pt on carbon) was obtained from Alfa Aesar, (Johnson Matthey Ltd.). All the chemicals were used as received. De-ionized (DI) water (18.4 MΩ cm) used for the experiments was produced by a Millipore system.

Nitrogen functionalization on GNF

HMTA as a source of nitrogen was mixed with GNF and was optimized to a mass ratio of 1[thin space (1/6-em)]:[thin space (1/6-em)]10. The mixture was dispersed in isopropyl alcohol (IPA) and deionized water under ultrasonication for 1 h. The resulting mixture was then heat treated at 100 °C for 3 h. After cooling to room temperature, the mixture was washed with DI water followed by drying in vacuum at 80 °C for 12 h. The materials were ground well and heat treated at 800 °C for 1 h in a tubular furnace under nitrogen atmosphere with a heating ramp of 5 °C min−1. The materials were collected and ground to a fine powder. The resultant powder is represented as nitrogen functionalized graphitic nanofiber (N-GNF).

Deposition of Ir nanoparticles on nitrogen functionalized GNF

Ir was deposited on N-GNF by the ethanol reduction method. Briefly, N-GNF and the required amount of iridium trichloride were suspended in an ethanol and water mixture followed by ultrasonication to form an ink. The pH was adjusted to ∼10 by adding aq. 0.5 M NaOH solution drop wise and the mixture was refluxed at 80 °C for 2 h for complete reduction of the Ir. The product was filtered and washed with copious amounts of DI water. The resulting Ir/N-GNF composite was dried under vacuum at 80 °C for 12 h. In a similar manner, Ir nanoparticles were deposited on pristine GNF without nitrogen doping for comparative studies. An Ir loading of ∼37 wt% was achieved in all of the catalysts.

Physico-chemical characterization

Powder X-ray diffraction (XRD) patterns for all of the catalysts were obtained on a Philips Pan Analytical X-ray diffractometer employing CuKα radiation of wavelength 1.54 Å. The effect of nitrogen doping on GNF was also examined by Raman spectroscopy (RFS27, Bruker) employing a Nd:YAG laser of wavelength 1064 nm. The Ir particle size and distribution in the supporting materials was analyzed using a field-emission transmission electron microscope (FE-TEM) (Hitachi, HF-3300) with an acceleration voltage of 300 keV. X-ray photoelectron spectroscopy (Thermo Fisher Scientific, ESCALAB 250 XPS system) using a monochromated Al Kα source at 15 keV and 150 W systems was used to ensure the presence of functional groups and the interaction of the Ir nanoparticles with the support materials.

Electrochemical measurements

Electrochemical tests on the catalysts were performed with a rotating-disk electrode (RDE) apparatus (Biologic instruments (VSP/VMP 3B-20)) at 25 °C. A glassy carbon disk electrode (geometric area: 0.071 cm2) was used as a substrate. A catalyst suspension was obtained by adding 2.13 mg of catalyst to 1 mL of water followed by ultra-sonication for 30 min. A 15 μL aliquot of the dispersed suspension was transferred onto the glassy carbon disk to obtain an Ir loading of 90 μg cm−2. 5 μL of 0.5 wt% Nafion solution was dropped onto the catalyst and allowed to dry at ambient conditions. Pt wire and saturated calomel electrode (SCE) were used as the counter and reference electrodes, respectively. Hydrogen adsorption–desorption voltammograms were recorded at a scan rate of 50 mV s−1 in 0.5 M HClO4 aq. solution purged with N2 gas to remove dissolved O2. The region for hydrogen adsorption between 0.01 V and 0.35 V vs. RHE on the backward potential scan was used to calculate the electrochemical surface area (ESA). Linear sweep voltammetry (LSV) for ORR activity measurements was performed using RDE in aq. 0.5 M HClO4 saturated with O2 at a scan rate of 5 mV s−1 at different rotation speeds. All potentials are reported in terms of the reversible hydrogen electrode (RHE) scale for convenience. To evaluate the electrochemical stability of the Ir/GNF and Ir/N-GNF catalysts, CVs were repeated for 2500 cycles and the ESA values were recorded every 500 cycles. LSV in the presence of O2 was conducted after repeated 2500 potential cycling to assess the electrochemical stability of the Ir/GNF and Ir/N-GNF catalysts towards the ORR.

Fabrication of the membrane electrode assemblies (MEAs) and PEFC performance evaluation

Commercial gas-diffusion layers (SGL DC-35) were used as the backing layers. For the reaction layers, prepared catalysts were dispersed in isopropyl alcohol and ultrasonicated for 30 min followed by the addition of 30 wt% Nafion solution. The resultant slurries were ultrasonicated for 1 h and coated onto the GDLs (representing the cathode) until an Ir loading of 0.4 mg cm−2 was achieved. For the anode, 40 wt% commercial Pt/C was used with 7 wt% Nafion until a Pt loading of 0.2 mg cm−2 was achieved. MEAs were obtained by sandwiching the pre-treated Nafion-212 membranes between the cathode and anode followed by its hot-compaction under a pressure of 20 kg cm−2 at 130 °C for 3 min. The MEAs were coupled with Teflon gas-sealing gaskets and placed in single-cell test fixtures with parallel serpentine flow-field machined on graphite plates. The galvanostatic polarization data was obtained using a fuel cell test station (Biologic: FCT-150 S) with gaseous H2 (80% RH) and gaseous O2/air (80% and 50% RH) to the anode and cathode of the PEFC respectively. All the MEAs were evaluated with an active area of 25 cm2 in PEFCs at a cell temperature of 70 °C under atmospheric pressure.

Results and discussion

Nitrogen functionalized GNF was successfully synthesized with HMTA as the nitrogen source. HMTA, with a molecular formula (CH2)6N4, is a heterocyclic organic compound, which in aqueous solution decomposes into ammonia by heating above 70 °C and is the key factor for nitrogen functionalization.30,31 To confirm the nitrogen doping, XPS measurements were carried out for pristine GNF and N-GNF, as shown in Fig. 1. The signal of N 1s appears at the binding energy of 399.01 eV in the case of N-GNF confirming the successful doping of nitrogen,32 whereas the shape for GNF is a flat line without any wave crests. The content of nitrogen determined from the XPS analysis is about 2.9 atom%. Furthermore, the C 1s peak of N-GNF becomes wider in relation to the pristine GNF. Full width half maxima (FWHM) values for N-GNF and GNF are 1.14 and 1.10 eV respectively. In the case of N-GNF some of the carbon atoms are replaced with nitrogen atoms in the carbon matrix. The strong interaction between the carbon and nitrogen contributes to the wider C 1s peak in the case of N-GNF. These widening effects are also found in many N-doped carbon nanomaterials.33–36
image file: c3ra47533f-f1.tif
Fig. 1 XPS survey for (a) the pristine GNF and N-GNF; (b) C (1s) region for the pristine GNF and N-GNF.

Raman spectroscopy is an effective tool to study the properties of carbon materials and can provide useful information about the degree of ordering of the materials and state of carbon hybridization. Raman spectroscopy data for pristine GNF and N-GNF is shown in Fig. 2. The Raman spectra displays two characteristic bands around 1338 cm−1 and 1574 cm−1 for both of the samples. The D band at 1338 cm−1 is associated with vibrations of carbon atoms with dangling bonds relating to in-plane termination of disordered graphite and associated defects and disorders in the structures of carbon materials.37 The G band at 1574 cm−1 is a characteristic feature of ordered graphitic carbon attributed to the stretching of the E2g mode for the sp2 carbon lattice. The G peak positions of the pristine GNF and N-GNF are 1574 and 1577 cm−1, respectively. The red shift of the G peak in the case of N-GNF is due to a change in the electronic structure of GNF by the doping of nitrogen species, which is consistent with what has been observed similarly in N-doped graphene.38–41 The intensity ratio of D- to G-bands (ID/IG) gives qualitative information about the degree of defects in N-GNF. From the Raman spectra, the ID/IG ratios of GNF and N-GNF are 0.72 and 0.92 respectively, indicating a higher degree of defects in N-GNF, which is due to the strong interaction between the carbon and nitrogen that induces disorder in the carbon–carbon rings.32 This observation is consistent with the XPS data.


image file: c3ra47533f-f2.tif
Fig. 2 Raman spectra for the pristine GNF and N-GNF.

After ascertaining the successful nitrogen functionalization to the GNF, investigation into the electrochemical properties was carried out. Fig. 3(a) shows the cyclic voltammetry curves for GNF and N-GNF in an O2 atmosphere. A featureless voltammetric curve was observed for GNF. By contrast, capacitance enhancement is observed for N-GNF which shows high electrical conductivity and faster charge transfer indicating the intrinsic ORR activity.42 Moreover, a well-defined reduction peak at about ∼0.5 V (vs. RHE) is attributed to the electro catalytic reduction of oxygen and it could not be replicated after the O2 was replaced by N2, indicating that the peak is a typical ORR peak. Fig. 3(b) shows the electrochemical activity of N-GNF towards the ORR at different rpm in acidic solution at room temperature and is compared with the GNF sample. The significant improvement in onset potential, half wave potential and limiting current for N-GNF shows enhanced ORR activity for the N-GNF catalyst. Well defined limiting currents were observed with an increase of rotation speed in the diffusion control region. The Koutecky–Levich plots, i.e., plots of the inverse of current density j−1 as a function of inverse of square root of the rotation rate ω−1/2, were obtained from eqn (1) and (2) and used to calculate the number of electrons involved in the ORR process.16,43

 
id = −1/2 (1)
 
image file: c3ra47533f-t1.tif(2)
where id is the diffusion controlled limiting current density, ω is the rotations per minute of the disk (ω = 2πN, N is the linear rotation speed), F is the Faraday constant (96[thin space (1/6-em)]485 C mol−1); CO2 is the bulk concentration of the O2 in the electrolyte (1.23 × 10⁻⁶ mol cm−3), DO2 is the diffusion coefficient of O2 (1.93 × 10⁻⁵ cm−2 S−1), ϑ is the kinematic viscosity of the electrolyte (1.01 × 10⁻² cm2 s−1); 0.2 is a constant used when ω is expressed in rotations per minute, n is the number of electrons transferred in the ORR. The number of electrons transferred can be calculated from the slope of the K–L plot. The slope value (B) obtained from the K–L plot is 1.4 mA−1 cm2 ω−1/2. By using this value, n is calculated and found to be 3.7 which is close to 4, revealing that the ORR proceeds through a four electron transfer process for the N-GNF catalyst.


image file: c3ra47533f-f3.tif
Fig. 3 Cyclic voltammograms for (a) GNF (O2 atmosphere) and N-GNF in an O2 and N2 atmosphere recorded at 25 °C in 0.5 M HClO4 solution at a scan rate of 50 mV s−1; (b) linear sweep voltammograms for N-GNF at different rpm in O2-saturated aqueous 0.5 M HClO4 solution at a scan rate of 5 mV s−1.

Powder XRD patterns for the Ir/GNF and Ir/N-GNF are shown in Fig. 4. The diffraction peaks at 2θ value of 26° are attributed to the (002) planes of hexagonal graphite structure, and the 2θ values of 41°, 69°, and 83° are assigned to the Ir (111), Ir (220), and Ir (311) planes respectively.15 Analysis of the Ir diffraction peaks shows that both the catalysts have a faced centered cubic crystal structure. The Ir (111) peak is considered to calculate the average Ir crystallite size using the Debye–Scherrer formula, and is about ∼2.2 nm for both catalysts.


image file: c3ra47533f-f4.tif
Fig. 4 XRD patterns for the Ir/GNF and Ir/N-GNF catalysts.

The presence of nitrogen species on the GNF surface effectively provides nucleation sites which facilitate the homogeneous dispersion of the Ir nanoparticles with a strong interaction between the Ir and GNF.44 Nitrogen functionalization also improves the hydrophilicity and wettability of the carbon materials.45 TEM images of the Ir particle size and its distribution over GNF and N-GNF are shown in Fig. 5. The distribution of Ir nanoparticles is inhomogeneous in the case of pristine GNF substrates. Some regions of GNF are not covered by Ir particles, while in many regions Ir nanoparticles are agglomerated, especially at the fiber edges. This may be due to the lack of sufficient functional groups in the GNF surfaces and limited interactions between Ir and pristine GNF. By contrast, Ir nanoparticles are widespread and homogeneously dispersed on the N-GNF surface. This is due to effective nitrogen functionalization on the entire GNF surface, which acts as an anchoring site for Ir deposition.


image file: c3ra47533f-f5.tif
Fig. 5 TEM images (a and b) of the Ir/GNF catalyst at different magnifications; (c and d) the Ir/N-GNF catalyst at different magnifications.

Fig. 6(a) shows the cyclic voltammograms for Ir/GNF and Ir/N-GNF catalysts in de-aerated 0.5 M HClO4. In the hydrogen adsorption–desorption (Ha/d) region, all of the catalysts showed large Ha/d peaks between 0.01 and 0.35 V vs. RHE.46,47 The ESA values for the Ir/GNF and Ir/N-GNF catalysts are calculated by integrating the Ha/d peaks, assuming the hydrogen monolayer adsorption–desorption charge of 220 μC cm−2 on the Ir surface. ESA values for the Ir/N-GNF and Ir/GNF catalysts are 67 and 50 m2 g−1 respectively. A higher ESA for Ir/N-GNF is attributed to the even distribution of Ir nanoparticles on the N-GNF support and are electrochemically more accessible for the reaction. A reversible peak at 0.55–0.65 V vs. RHE shown in the inset of Fig. 6(a) can be attributed to the Ir/Ir–OH or Ir–O redox process.46,47 The redox peak shifting towards a positive potential for the Ir/N-GNF catalyst is an indication of higher intrinsic ORR activity. It is to be noted, that the surface of Ir has a strong affinity for –OH and –O species which is responsible for the low ORR activity.48 Strong adsorption of the –OH groups always retards the oxygen reduction process.49,50 The –OH adsorption region (0.45–0.75 V vs. RHE) for Ir/GNF and Ir/N-GNF shown in Fig. 6(b) is selected to obtain hydroxyl species coverage on the Ir surface of both the catalysts. The adsorption of the hydroxyl species (OH coverage %) was calculated based on the OHads peak in the CV curves in the backwards scan. OH coverage % was obtained by normalizing the hydroxyl adsorption charge by the ESA of the respective catalyst.51,52 It is seen that the % –OH coverage for Ir/N-GNF is significantly lower compared to Ir/GNF. This indicates that the presence of nitrogen in the Ir/N-GNF catalyst facilitates a quick desorption of –OH species from the Ir surface and participates in the reaction to produce H2O. Furthermore, the oxophilic nature of the N-GNF surface could provide charged species which help in the removal of oxide/OH species. As a result, the Ir/N-GNF catalyst shows a higher electrochemical activity towards the ORR.18


image file: c3ra47533f-f6.tif
Fig. 6 Cyclic voltammograms for (a) Ir/GNF and Ir/N-GNF recorded at 25 °C in 0.5 M HClO4 solution at a scan rate of 50 mV s−1; (b) hydroxyl surface coverage (θOH) for the Ir/GNF and Ir/N-GNF catalysts.

image file: c3ra47533f-f7.tif
Fig. 7 Linear sweep voltammograms for Ir/GNF, Ir/N-GNF at 1600 rpm in O2-saturated aqueous 0.5 M HClO4 solution at a scan rate of 5 mV s−1. Tafel plot shown in the inset.

The electrochemical activity of the catalysts towards the ORR was investigated using RDE in acidic solution at room temperature (∼25 °C) and is shown in Fig. 7. A more positive onset potential for the Ir/N-GNF catalyst shows the ORR is relatively faster in relation to the Ir/GNF. The half-wave potential for Ir/N-GNF shows a positive shift of 90 mV compared to Ir/GNF. Favorable shifts in the onset potential, half wave potential and limiting current reflect an enhanced catalytic activity towards the ORR for the Ir/N-GNF catalyst. Fig. 8(a) and (b) show the ORR voltammograms for Ir/GNF and Ir/N-GNF respectively at different rpm along with the K–L plots as insets. It can be seen that the current density increases rapidly with an increase of rotation speed due to a shortened diffusion distance at high speeds. The linearity of the K–L plot suggests first order kinetics towards the ORR and similar electron transfer for ORR at different potentials. The slope values obtained from the K–L plot are 1.38 and 1.45 mA−1 cm2 ω−1/2 for Ir/GNF and Ir/N-GNF respectively. The number of electrons calculated from eqn (1) and (2) for Ir/GNF and Ir/N-GNF are 3.69, and 3.88 respectively, which is close to 4, revealing that the ORR precedes through a direct four electron transfer process.


image file: c3ra47533f-f8.tif
Fig. 8 Linear sweep voltammograms for (a) Ir/GNF, (b) Ir/N-GNF at different rpm in O2-saturated aqueous 0.5 M HClO4 solution at a scan rate of 5 mV s−1. K–L plots shown in the insets.

To determine the mass activity of the catalysts, the polarization plot for RDE has been corrected for mass-transport using eqn (3) and the mass activities are calculated using eqn (4).53,54

 
image file: c3ra47533f-t2.tif(3)
 
image file: c3ra47533f-t3.tif(4)
where ik is the mass-transport corrected kinetic current density, id is the measured diffusion limited current density, and i is the measured current density, m is the amount of Ir loading. The ik values for Ir/GNF, Ir/N-GNF at 0.8 V vs. RHE are found to be −0.3 and −1.03 mA cm−2 and the mass activities are 3.43 and 11.18 A gIr−1, respectively. The Tafel slope for Ir/GNF, Ir/N-GNF are 141 and 99 mV per decade respectively, further confirming the enhanced activity for the Ir/N-GNF.

XPS survey for the Ir/GNF and Ir/N-GNF composite catalyst to determine the chemical states of Ir nanoparticles are shown in Fig. 9. The Ir 4f spectrum presents two chemical states of Ir nanoparticles with distinct binding energies. Bands at 60.9 and 63.9 eV correspond to the typical values of 4f7/2 and 4f5/2 electrons of metallic Ir (0) respectively.55 However, in the case of Ir/N-GNF, a slight up-shift in the binding energy is observed and the corresponding values are 61 and 64 eV. The shift of binding energy of the core-level orbital is closely correlated with a change of electron density at the metal surface of nanoparticles.56 A slight up-shift in the binding energy in the case of Ir/N-GNF further confirms the specific interaction between nitrogen and Ir nanoparticles. Due to the electron donating nature of nitrogen, N-GNF results in chemically active localized areas with a higher electron density.57,58 After Ir nanoparticles were deposited, electron transfer from nitrogen to the unfilled orbital of Ir could occur via the nitrogen group. This process leads to a higher electron density at the Ir nanoparticles and is responsible for the up-shift in binding energy and the subsequent enhancement of ORR activity.59–61


image file: c3ra47533f-f9.tif
Fig. 9 XPS survey for the Ir (4f) region in the Ir/GNF and Ir/N-GNF catalysts.

In order to examine the fuel cell performance, MEAs comprising GNF, N-GNF, Ir/GNF and Ir/N-GNF as cathode catalysts were evaluated in the H2–O2 cell at 70 °C and ambient pressure shown in Fig. 10(a). It is evident that the PEFC comprising N-GNF shows a higher performance in relation to the PEFC with pristine GNF. The superior performance of N-GNF over pristine GNF further corroborates the CV and ORR data. Ir impregnation to the GNF and N-GNF further ameliorates the fuel cell performance. The PEFC with Ir/N-GNF catalyst delivers a peak power density of 450 mW cm−2 at a load current density of 1577 mA cm−2, while the PEFC with Ir/GNF catalyst delivers a peak power density of only 259 mW cm−2 at a load current density of 1040 mA cm−2 under identical operation conditions. The higher performance of the Ir/N-GNF catalyst further confirms the enhanced oxygen reduction activity of this system, which has already been revealed through the RDE studies. Fig. 10(b) shows the fuel cell performance of the Ir/N-GNF catalysts with air feed in the cathode side, which delivers a peak power density of 270 mW cm−2. A stability test for the Ir/N-GNF catalyst was carried out at 200 mA cm−2 for 50 h using H2-air feeds at 70 °C and ambient pressure shown in the inset of Fig. 10(b). There is no obvious voltage loss seen over a period of 50 h confirming the suitability of Ir/N-GNF catalyst in a fuel cell environment.


image file: c3ra47533f-f10.tif
Fig. 10 Performance curves of H2–O2 PEFC employing (a) GNF, N-GNF, Ir/GNF, Ir/N-GNF cathode catalysts at 70 °C under atmospheric pressure; (b) performance curves for Ir/N-GNF in H2-air at 70 °C under atmospheric pressure (stability test in H2/air @ 200 mA cm−2 shown in the inset).

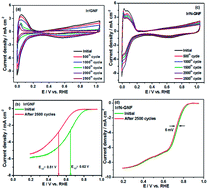
As previously mentioned, it is observed that the Ir/N-GNF catalyst enhances ORR activity and is extremely useful for the fuel cell as a non-Pt metal catalyst. Generally, most reported ORR catalysts have low stability in acidic conditions. To ensure the electrochemical stability of the catalysts developed in this study, repeated potentiodynamic cycling tests were carried out for 2500 cycles in an N2 saturated aqueous 0.5 M HClO4 at room temperature, as shown in Fig. 11. It is observed that the ESA value drops by 37% of the initial value after 2500 cycles for the Ir/N-GNF catalyst, while the drop is 83% for the Ir/GNF catalyst (Fig. 11(a and c)). The ORR behavior of the two catalysts before and after 2500 potential cycles is also performed to evaluate the catalyst degradation shown in Fig. 11(b and d). The Ir/GNF catalyst has remarkable 101 mV negative shifts in the half wave potential after potential cycling. By contrast, only 6 mV negative shifts are observed for the Ir/N-GNF catalyst after 2500 potential cycles. The remarkable improvement of the Ir/N-GNF catalyst towards ORR activity is exclusively credited to the presence of nitrogen in the functionalized GNF (N-GNF). Besides, nitrogen functionalization to the GNF increases corrosion resistance and provides strong interaction of Ir nanoparticles to the GNF which helps the durability of the catalyst.


image file: c3ra47533f-f11.tif
Fig. 11 Cyclic voltammograms for (a) the Ir/GNF and (c) Ir/N-GNF catalyst by repeated potentiodynamic cycling tests; linear sweep voltammograms for (b) Ir/GNF and (d) Ir/N-GNF before and after the stability test at 1600 rpm in O2-saturated aq. 0.5 M HClO4.

Conclusions

Nitrogen functionalization of the GNF surface is established in this study which increases the catalytic activity of N-GNF towards the ORR. Uniform distribution of Ir nanoparticles on the N-GNF surface results in a higher ESA value and the nanoparticles are electrochemically more accessible for the oxygen reduction reaction. The presence of nitrogen in the Ir/N-GNF catalyst facilitates quick desorption of the –OH species from the Ir surface and accelerates the electrochemical reaction of Ir particles, which in turn enhances the ORR activity. The Ir/N-GNF catalyst exhibited a higher power density and presents excellent stability in comparison with Ir/GNF, both in the half cell and fuel cell environments.

Acknowledgements

Financial support from CSIR, New Delhi, through HYDEN project (CSC 0122) is gratefully acknowledged. We thank Dr P. Sridhar and Dr S. Pitchumani for their valuable suggestions. We also thank Dr Vijayamohanan K. Pillai, Director, CSIR-CECRI for his help and support.

References

  1. A. K. Shukla, P. A. Christensen, A. Hamnett and M. P. Hogarth, J. Power Sources, 1995, 55, 87–91 CrossRef CAS.
  2. Y. Liu, A. Ishihara, S. Mitsushima, N. Kamiya and K. I. Ota, Electrochem. Solid-State Lett., 2005, 8, A400–A402 CrossRef CAS PubMed.
  3. M. Lefèvre, J. P. Dodelet and P. Bertrand, J. Phys. Chem. B, 2005, 109, 16718–16724 CrossRef PubMed.
  4. K. Suarez-Alcántara, A. Rodríguez-Castellanos, S. Duron-Torres and O. Solorza Feriaa, J. Power Sources, 2007, 17, 1381–1387 Search PubMed.
  5. K. Suárez-Alcántara and O. Solorza-Feria, Electrochim. Acta, 2008, 53, 4981–4989 CrossRef PubMed.
  6. L. Zhang, J. Zhang, D. P. Wilkinson and H. Wang, J. Power Sources, 2006, 156, 171–182 CrossRef CAS PubMed.
  7. T. E. Wood, Z. Tan, A. K. Schmoeckel, D. O. Neill and R. Atanasoski, J. Power Sources, 2008, 178, 510–516 CrossRef CAS PubMed.
  8. K. Lee, L. Zhang and J. Zhang, J. Power Sources, 2007, 165, 108–113 CrossRef CAS PubMed.
  9. V. D. Noto, E. Negro, S. Lavina, N. Boaretto and M. Piga, ECS Trans., 2008, 16, 123–137 Search PubMed.
  10. D. A. J. Rand and R. Woods, J. Electroanal. Chem., 1974, 55, 375–381 CrossRef CAS.
  11. A. Marshall, B. Børresen, G. Hagen, M. Tsypkin and R. Tunold, Electrochim. Acta, 2006, 51, 3161–3167 CrossRef CAS PubMed.
  12. F. Calle-Vallejo, J. I. Martínez and J. Rossmeisl, Phys. Chem. Chem. Phys., 2011, 13, 15639–15643 RSC.
  13. C. H. Chang, T. S. Yuen, Y. Nagao and H. Yugami, Solid State Ionics, 2011, 197, 49–51 CAS.
  14. C. H. Chang, T. S. Yuen, Y. Nagao and H. Yugami, J. Power Sources, 2010, 195, 5938–5941 CrossRef CAS PubMed.
  15. G. Liu and H. Zhang, J. Phys. Chem. C, 2008, 112, 2058–2065 CAS.
  16. J. Qiao, R. Linb, B. Li, J. Ma and J. Liu, Electrochim. Acta, 2010, 55, 8490–8497 CrossRef CAS PubMed.
  17. A. Brouzgou, S. Q. Song and P. Tsiakaras, Appl. Catal., B, 2012, 127, 371–388 CrossRef CAS PubMed.
  18. Y. Zhou, K. Neyerlin, T. S. Olson, S. Pylypenko, J. Bult, H. N. Dinh, T. Gennett, Z. Shao and R. O'Hayre, Energy Environ. Sci., 2010, 3, 1437–1446 CAS.
  19. M. Kim, S. Hwang and J. S. Yu, J. Mater. Chem., 2007, 17, 1656–1659 RSC.
  20. R. Wang, X. Li, H. Li, Q. Wang, H. Wang, W. Wang, J. Kang, Y. Chang and Z. Lei, Int. J. Hydrogen Energy, 2011, 36, 5775–5781 CrossRef CAS PubMed.
  21. B. Choi, H. Yoon, I. S. Park, J. Jang and Y. E. Sung, Carbon, 2007, 45, 2496–2501 CrossRef CAS PubMed.
  22. Y. L. Hsin, K. C. Hwang and C. T. Yeh, J. Am. Chem. Soc., 2007, 129, 9999–10010 CrossRef CAS PubMed.
  23. Y. Motoyama, Y. Lee, K. Tsuji, S. H. Yoon, I. Mochida and H. Nagashim, ChemCatChem, 2011, 3, 1578–1581 CrossRef CAS.
  24. G. Vijayaraghavan and K. J. Stevenson, Langmuir, 2007, 23, 5279–5282 CrossRef CAS PubMed.
  25. M. S. Saha, R. Li, X. Sun and S. Ye, Electrochem. Commun., 2009, 11, 438–441 CrossRef CAS PubMed.
  26. R. I. Jafri, N. Rajalakshmi and S. Ramaprabhu, J. Mater. Chem., 2010, 20, 7114–7117 RSC.
  27. G. Wu, D. Li, C. Dai, D. Wang and N. Li, Langmuir, 2008, 24, 3566–3575 CrossRef CAS PubMed.
  28. Y. Shao, J. Sui, G. Yin and Y. Gao, Appl. Catal., B, 2008, 79, 89–99 CrossRef CAS PubMed.
  29. B. Zheng, W. T. Zheng, K. Zhang, Q. B. Wen, J. Q. Zhu, S. H. Meng, X. D. He and J. C. Han, Carbon, 2006, 44, 962–968 CrossRef CAS PubMed.
  30. U. Sulaeman, S. Yin and T. Sato, J. Nanomater., 2010, 2010, 629727 Search PubMed.
  31. X. Li, H. Wang, J. T. Robinson, H. Sanchez, G. Diankov and H. Dai, J. Am. Chem. Soc., 2009, 131, 15939–15944 CrossRef CAS PubMed.
  32. C. Tsai, M.-H. Tu, C.-J. Chen, T.-F. Hung, R.-S. Liu, W.-R. Liu, M.-Y. Lo, Y.-M. Peng, L. Zhang, J. Zhang, D.-S. Shy and X.-K. Xing, RSC Adv., 2011, 1, 1349–1357 RSC.
  33. P. H. Matter, L. Zhang and U. S. Ozkan, J. Catal., 2006, 239, 83–96 CrossRef CAS PubMed.
  34. R. Cote, G. Lalande, D. Guay, J. P. Dodlet and G. Denes, J. Electrochem. Soc., 1998, 145, 2411–2418 CrossRef CAS PubMed.
  35. J. Casanovas, J. M. Ricart, J. Rubio, F. Illas and J. M. Jimenez-mateos, J. Am. Chem. Soc., 1996, 118, 8071–8076 CrossRef CAS.
  36. G. Liu, X. Li, P. Ganesan and B. N. Popov, Appl. Catal., B, 2009, 93, 156–165 CrossRef CAS PubMed.
  37. M. S. Dresselhaus, G. Dresselhaus, R. Saito and A. Jorio, Phys. Rep., 2005, 409, 47–99 CrossRef PubMed.
  38. D. He, Y. Jiang, H. Lv, M. Pan and S. Mu, Appl. Catal., B, 2013, 132, 379–388 CrossRef PubMed.
  39. Q. H. Yang, P. X. Hou, M. Unno, S. Yamauchi, R. Saito and T. Kyotani, Nano Lett., 2005, 5, 2465–2469 CrossRef CAS PubMed.
  40. D. Wei, Y. Liu, Y. Wang, H. Zhang, L. Huang and G. Yu, Nano Lett., 2009, 9, 1752–1758 CrossRef CAS PubMed.
  41. L. S. Panchokarla, K. S. Subrahmanyam, S. K. Saha, A. Govindaraj, H. R. Krishnamurthy, U. V. Waghmare and C. N. R. Rao, Adv. Mater., 2009, 21, 4726–4730 Search PubMed.
  42. H.-K. Jeong, M. Jin, E. J. Ra, K. Y. Sheem, G. H. Han, S. Arepalli and Y. H. Lee, ACS Nano, 2010, 4, 1162–1166 CrossRef CAS PubMed.
  43. C. Coutanceau, P. Crouigneau, J. M. Léger and C. Lamy, J. Electroanal. Chem., 1994, 379, 389–397 CrossRef.
  44. S. Sun, G. Zhang, Y. Zhong, H. Liu, R. Li, X. Zhou and X. Sun, Chem. Commun., 2009, 7048–7050 RSC.
  45. Y. Zhou, R. Pasquarelli, T. Holme, J. Berry, D. Ginleyc and R. O'Hayre, J. Mater. Chem., 2009, 19, 7830–7838 RSC.
  46. J. Mozota and B. E. Conway, Electrochim. Acta, 1983, 28, 1–8 CrossRef CAS.
  47. A. Aramata, T. Yamazaki, K. Kunimatsu and M. Enyo, J. Phys. Chem., 1987, 91, 2309–2314 CrossRef CAS.
  48. K. I. Ota, A. Ishihara, S. Mitsushima, K. Lee, Y. Suzuki, N. Horibe, T. Nakagawa and N. Kamiya, J. New Mater. Electrochem. Syst., 2005, 8, 25–35 CAS.
  49. J. K. Nørskov, J. Rossmeisl, A. Logadottir, L. Lindqvist, J. R. Kitchin, T. Bligaard and H. Jónsson, J. Phys. Chem. B, 2004, 108, 17886–17892 CrossRef.
  50. N. M. Marković, T. J. Schmidt, V. Stamenković and P. N. Ross, Fuel Cells, 2001, 1, 105–116 CrossRef.
  51. Z. Peng and H. Yang, J. Am. Chem. Soc., 2009, 131, 7542–7543 CrossRef CAS PubMed.
  52. S. M. Unni, V. K. Pillai and S. Kurungot, RSC Adv., 2013, 3, 6913–6921 RSC.
  53. K. K. Tintula, A. K. Sahu, S. D. Bhat, S. Pitchumani and P. Sridhar, Appl. Catal., B, 2011, 110, 178–185 CrossRef PubMed.
  54. S. G. Peera, K. K. Tintula, A. K. Sahu, S. Shanmugam, P. Sridhar and S. Pitchumani, Electrochim. Acta, 2013, 108, 95–103 CrossRef PubMed.
  55. W. Chen and S. Chen, J. Mater. Chem., 2011, 21, 9169–9178 RSC.
  56. J. Wang, P. H. Hindle, D. MacDonald, D. F. Thomas and A. Chen, Electrochim. Acta, 2008, 53, 6944–6952 CrossRef CAS PubMed.
  57. V. V. Strelko, V. S. Kuts and P. A. Throwerb, Carbon, 2000, 38, 1499–1503 CrossRef CAS.
  58. A. H. Nevidomskyy, G. C. Anyi and M. C. Payne, Phys. Rev. Lett., 2003, 91, 105502–105506 CrossRef.
  59. Y. Chen, J. Wang, H. Liu, M. N. Banis, R. Li, X. Sun, T.-K. Sham, S. Ye and S. Knights, J. Phys. Chem. C, 2011, 115, 3769–3776 CAS.
  60. Y. Wu, S. Fang and Y. Jiang, J. Power Sources, 1998, 75, 201–206 CrossRef CAS.
  61. Z. Mo, R. Zheng, H. Peng, H. Liang and S. Liao, J. Power Sources, 2014, 245, 801–807 CrossRef CAS PubMed.

This journal is © The Royal Society of Chemistry 2014
Click here to see how this site uses Cookies. View our privacy policy here.