Predicted stability, structures, and magnetism of 3d transition metal nitrides: the M4N phases

Chang-Ming Fang*, Rik S. Koster, Wun-Fan Li and Marijn A. van Huis
Soft Condensed Matter, Debye Institute for Nanomaterials Science, Utrecht University, Princetonplein 5, 3584 CC Utrecht, The Netherlands. E-mail: C.Fang@uu.nl

Received 6th December 2013 , Accepted 7th January 2014

First published on 8th January 2014


Abstract

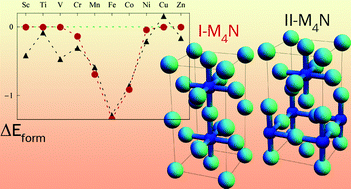
The 3d transition metal nitrides M4N (Sc4N, Ti4N, V4N, Cr4N, Mn4N, Fe4N, Co4N, Ni4N, and Cu4N) have unique phase relationships, crystal structures, and electronic and magnetic properties. Here we present a systematic density functional theory (DFT) study on these transition metal nitrides, assessing both the I-M4N phase and the II-M4N phase, which differ in ordering of the N atoms within the face-centered cubic (FCC) framework of metal atoms. The calculations showed that for M = Mn, Fe, Co and Cu, the I-M4N phases with perfect metal sub-lattices are favored, while for M = Sc–Cr, and Ni, the II-M4N phases with distorted metal sub-lattices are favored. We predict that several currently not existing II-M4N phases may be synthesized experimentally as metastable phases. From Bader charge analysis the M4N phases are found to be ionic with significant metal–metal bonding. I-M4N with M = Cr to Ni are magnetic, while II-M4N with M = Cr and Ni are non-magnetic. The calculations revealed unusually high local magnetic moments and high spin-polarization ratios of the M1 atoms in I-M4N (M = Cr to Ni). The origin of magnetism and lattice distortion of the M4N phases is addressed with the Stoner criterion. Detailed information about the relative stability, structures, chemical bonding, as well as the electronic and magnetic properties of the phases are of interest to a wide variety of fields, such as chemical synthesis, catalysis, spintronics, coating technology, and steel manufacturing.

1. Introduction

The interest in the M4N transition metal nitrides is multifold. First, M4N nitrides with M = Fe, Co and Ni, have unique electronic and magnetic properties and consequently have potential applications as magnetic recording materials,1–5 as spin carriers in spintronics3–6 and even as catalysts used for photocatalytic water splitting.7

Second, there are two possible phases for M4N (the I-phase and the II-phase) that are structurally difficult to distinguish but that can have very different physical properties. In the early 1960s, Terao observed two Ni4N phases.8,9 One of them is cubic (I-M4N with M = Ni),8 and has a conventional face-centered cubic (FCC) cell with one N atom at the center. Within this I-phase, there are two crystallographically different sites for the metal atoms in the FCC-sub-lattice: one is at the corner with 12 metal atomic neighbors, and the other three are at the face centers, each of which has 12 metal neighbors and two N atom neighbors, as shown in Fig. 1. The two types of metal atoms in this phase have significantly different characteristics, which leads to interesting electronic and magnetic properties.2–7


image file: c3ra47385f-f1.tif
Fig. 1 Schematic structure for I-M4N (a, left) and II-M4N (b, right). The black bold-lines indicate the axis of the unit cell. The octahedrally-coordinated N atoms form a simple cubic lattice in I-M4N with two crystallographically different M atoms: M1 at the corners of the cell, coordinated by 12 M2 atoms, and three M2 atoms at the face centers, coordinated by four M1, 8 M2 atoms and 2 N atoms. In II-M4N, the octahedrally-coordinated N atoms form a body-centered tetragonal structure with also two M species: M1 in the planes z = 0 and z = 1/2, each M1 coordinated by 4 M1, 8 M2 and 1 N atoms, M2 at z ≈ 1/4 and z ≈ 3/4, whereby each M2 has 8 M1, 4 M2 and 2 N neighboring atoms.

The second Ni4N phase that Terao found (II-M4N with M = Ni) is tetragonal with aa0 and c ≤ 2a0 (here a0 is the lattice parameter of cubic I-M4N).9 Compared to the cubic I-M4N phase with a perfect FCC metal sublattice, in the tetragonal II-M4N phase the FCC metal sublattice is distorted, and has two N atoms at octahedral sites, as shown in Fig. 1.9 Up to now most studies are on the I-type structures. There are very few papers on the II-phases. Throughout rest of this manuscript, we use the definitions by Terao.8,9 It is of general interest to explore the relative stability, structures and unique electronic properties of these two M4N phases.

Third, the itinerant nature of 3d transition metals and the related compounds has been a fascinating topic for solid state scientists for over half century.10–15 Although intensive investigations have been performed for the 3d transition metals11,12 and ionic transition compounds, such as the oxides,13–15 there are much fewer studies on the 3d transition metals of partial oxidation, which is the case for 3d transition metal sub-nitrides, M4N (M = 3d transition metals).14–16 Furthermore, the magnetism and its origin for the M4N phases are of great interest for scientists in the fields of physics, chemistry and materials science.

Experimentally, most M4N samples have been prepared for M = Mn, Fe, Co and Ni in the forms of e.g. powder by nitridization of the metals,1–9,16–18 as thin-films by sputtering techniques3,4,19 and as nanoparticles on substrates by molecular beam epitaxy techniques.20 In general, it is difficult to obtain pure samples with high homogeneity using these methods. That has an impact on the accuracy and reliability of the experimental assessments of the physical properties. Therefore, much remains to be clarified. For example, Blucher and co-workers reported I-Cu4N samples they prepared by means of DC plasma ion nitridization. They found a lattice parameter of about 3.19 Å, which is much smaller than that (∼3.61 Å) of pure FCC-Cu.21

To resolve such issues theoretical methods, especially parameters-free first-principles methods, are very useful. The first-principles density-functional theory (DFT) approaches have been used for I-M4N, in particular for M = Fe.22–32

With the assumption that the lattice parameters of the tetragonal II-Fe4N are a = a0, c = 2 a0 (a0 is the lattice parameter of cubic I-Fe4N), Kong and co-workers performed electronic band structure calculations using the first-principles Linear Muffin-Tin Orbital (LMTO) method and addressed the influence of N ordering on the electronic and magnetic properties of M4N (M = Fe) with the two I- and II-phase structures and observed a strong impact of local crystal structure on the local magnetism.25 Mohn and co-workers studied the magnetic and electronic properties of I-M4N with M = Mn and Fe and observed ferro-magnetic (FM) nature for M = Fe and ferri-magnetic (FR) ordering for M = Mn.33,34 Matar and co-workers studied the magnetic properties of cobalt metal and tetra-cobalt nitride (I-M4N with M = Co).35 From the dispersion curves, Takahashi and co-workers6 explored the electronic and magnetic properties of ternary I-(M1−xM′x)4N, (M = Co, M′ = Fe) compounds. They observed a nearly half-metallic electronic structure for I-Co4N, and a half-metallic behavior for I-(Co1−xFex)4N, whereby at x = 1/4 the energy gap is about 0.2 eV for the spin-up (majority) electrons. That suggests that this material has potential application as spin-carrier materials for spintronics devices.6,36–40 In the first-principles' study of stability and electronic and magnetic properties of nickel nitrides, Fang and co-workers revealed that I-Ni4N is magnetic while I-Ni4Nx (x ∼ 0.1) phases are non-magnetic due to the distortion of the FCC Ni sub-lattice caused by extra/deficiency of N atoms.41 More theoretical studies were conducted on the electronic and magnetic properties of ternary I-(AxM1−x)4N phases where A is a metallic element and M a 3d transition metal.6,42–46 Dos Santos and co-workers performed structural optimization and electronic band structure calculations for a novel I-M4N (M = V) phase.47 Up to now, theoretical calculations have been performed mainly for I-M4N with M = Mn, Fe, Co, Ni and Cu,22–41,48,49 and there is lack of knowledge about the formation and stability, and physical properties of the II-M4N phases.

In the present manuscript, we present a systematic first-principles study on the stability, the structure, and the electronic and magnetic properties of I- and II-M4N (M = Sc to Cu) phases. The trends in chemical bonding, valence and charge transfer in the M4N were addressed together with the electro-negativity of the 3d transition metals. The (in-)stability of paramagnetic I-M4N phases was investigated using the Stoner theory.10–12,50,51 The obtained information here is important not only for solid state scientists to understand the nature of 3d transition metals and related compounds, but also for experimentalists for obtaining a reliable characterization of prepared samples and to understand the physical properties of the binary M4N and ternary (M,M′)4N phases, many of which are metastable.20,21,52 Finally, the calculated results are of interest for the development of applications in various fields, such as chemical synthesis,1–9,16–18 coating,19,20 catalysis,7 spintronics,6,36–40 and steel manufacturing.53,54

The article is arranged as follows. In the following Section (2), we introduce the criteria used to assess the stability of the nitrides (formation energy) with respect to the elemental metals and a N2 molecule (2.1). Next the Bader charge analysis approach used in the present work is described in Section 2.2. Details of the first-principles density-functional theory (DFT) techniques and settings are described in Section 2.3. Section 3 (Computational results and discussion) starts with the elemental metals (3.1), followed by the stability, structural properties, chemical bonds, and charge transfer in the M4N phases (3.2). The electronic and magnetic properties of the M4N phases are described in 3.3. Finally, in Section 3.4 we address the origin of magnetism and phase stability of M4N using Stoner criterion together with the FCC-3d elemental metals. Finally a brief summary of the calculations and results is presented in Section 4.

2. Details of calculations

2.1. Formation energy

The formation energy (ΔE) of a metal nitride with the formula, M4N, M = Sc to Cu with respect to the elemental 3d transition metal M and the N2 molecule can be described as:41,54,55
 
ΔE(M4N) = E(M4N) − [4E(M) + E(N2)/2] (1)
here, E(M4N), E(M) and E(N2) are calculated using the DFT-GGA approach (see below). This energy difference, ΔE(M4N) is in units of eV per M4N (eV/f.u.) and can be used to assess the relative stability of the M4N phases. Positive values mean metastable and negative values indicate stable with respect to the elemental metal and N2 gas. At 0 K and 0 Pa, the enthalpy difference is equal to the energy difference, that is ΔH(M4N) = ΔE(M4N), where we ignore the zero-point vibration contribution.

2.2. Bader charge and charge transfer in crystals

One of the difficulties in solid state science is the definition of the shape and volume of an atom or ion and correspondingly the charge on and charge transfer from/to the atom/ion in a solid.56 In 1971, Bader and Beddal proposed a unique definition of an atom/ion in a molecule/solid by dividing the molecule/solid into spatial regions defining the atoms, and the charge on the atom is determined by the number of electrons in each region.56,57 The boundary of an atom is defined by the zero-flux surfaces between that atom and neighboring atoms. That is, the charge density distribution ρ(r) is partitioned by the close surface, S(r), through which the flux density ∇ρ(r) is zero,
 
ρ(rn(r) = 0 (2)
where the flux density ∇ρ(r) = (∂/∂x, ∂/∂y, ∂/∂z)ρ(r) is a vector and n(r) is the unit vector normal to the surface S(r) at r. This definition is sufficient to unambiguously partition any molecular or condensed matter system of a finite or infinite size. Then the number of electrons in the volume centered by a density peak (nucleus or ion of atom A) can be obtained by integrating the electron density in the volume bounded by S(r),
 
N(A) = ∫ρ(r)dr (3)
and the charge for ion A with Z valence electrons is obtained from
 
Q(A) = ZN(A) = Z − ∫ρ(r)dr (4)

Henkelman and co-workers58 implemented Bader charge analysis into different first-principles DFT codes, including the Vienna Ab initio Simulation Package (VASP).59,60 The Bader charge approach has been widely used in ab initio studies of chemical reactivity of atoms/ions in molecules or solids.37,58,61

2.3. Details of first-principles calculations

The first-principles code VASP59,60 was used for all the calculations. This code employs Density-Functional Theory (DFT) within the projector-augmented wave (PAW) method.62,63 The generalized gradient approximation (GGA) formulated by Perdew, Burke and Ernzerhof (PBE)64 was employed for the exchange and correlation energy terms because the GGA approximation describes (spin-polarized) transition metals and compounds better than the local (spin-polarized) density approximation.65,66 We remark here that the small number of valence electrons of elements, especially those of the first half column in the periodic table, has an impact on the calculations of Bader charges at atomic sites in a crystal.58,61 To obtain reliable values of Bader charges in the M4N phases, we also used the potentials (M_pv) containing semi-core 3p6 electrons.59,60,63,64 Our test-calculations showed that using the PBE-GGA potential with/without the semi-core 3p6 electrons produced no notable differences in the results on crystal structure, total energy differences, and electronic and magnetic properties. The cut-off energy of the wave functions was 550 eV. The cut-off energy of the augmentation functions was 700 eV. A 2a0 × 2a0 × 2a0 supercell is used for I-M4N (a0 is the lattice parameter of the cubic cell) to facilitate the integration of charges/electrons in the atomic spheres. The electronic wave functions were sampled on a 12 × 12 × 12 grid with 84k-points and 24 × 24 × 12 grid with 468k points in the irreducible Brillouin zone (BZ) of the 2a0 × 2a0 × 2a0 super-cell of I-M4N and the conventional cell of II-M4N, respectively, using the Monkhorst–Pack method.67 Dense k-meshes were used for the elemental 3d transition metals as well. For the calculations of local electronic configurations and partial density of states of the atoms, the Wigner–Seitz radius is set at 1.4 Å for M and 1.0 Å for N, respectively, considering the metallic nature of the nitrides. Note that the M 3d electrons exhibit an itinerant character in the metals and their nitrides, and in principle belong to the whole crystal. However, we can decompose the plane waves in the sphere and obtain M 3d components in the spheres for both the spin-up (or majority) and spin-down (minority) directions. In this way a local magnetic moment is obtained which is the difference of the number of spin-up electrons and spin-down electrons in the sphere. Different k-meshes and cut-off energies for the waves and augmentation waves were tested. The settings mentioned above ensure a good convergence (∼1 meV per atom).

3. Computational results and discussion

3.1. Structure of the elemental 3d metals

As shown in eqn (1), in order to obtain the formation energies of the nitrides it is required to first calculate the total valence electron energies of a N2 molecule and the stable elemental solids with the same technique and settings in Section 2.3. Calculations for the N2 molecule were performed in a large cube with axis length a = 12 Å.61 The cut-off energy of the wave functions of 1000 eV was employed to describe the strongly localized 2p bonds of the N2 molecule. The calculated bond-length is 1.11 Å, comparable to the experimental value (1.10 Å).

The 3d transition metals have been studied intensively.10–12,50,68–73 It has been recognized that 3d transition metal atoms have the unique 3dn4s2 with n = 1 to 10 (from Sc to Zn) with two exceptions, Cr 3d5 4s1 and Cu 3d10 4s1. The exceptions originate from the preference of half (3d d5 for Cr) and full occupations (3d10) of the 3d states.73,74 As shown in Table 1, the ground state of elemental Sc, Ti, Co and Zn metals has a hexagonally-closed-packing (HCP) lattice, V, Cr and Fe a body-centered cubic (BCC) lattice, Ni and Cu a faced-centered cubic (FCC) lattice.68–73 Elemental Mn metal has a complicated crystal structure at ground state.72–75 Obviously, there have been many experimental and theoretical efforts on the structural, electronic and magnetic properties of 3d transition metals.10–14,50,51,68–75 However, here the experimental values serve merely as a reference for the calculations on the nitrides, therefore, we limit ourselves to comparison with the available experimental observations in literature.

Table 1 Calculated results (lattice parameters, local magnetic moments) of the elemental 3d transition metals from first-principles DFT-GGA. Available experimental data from the literature are included for comparison
  χ_Pauling116/χ_Allen117 Present calculations Experiments in literature
Latt. para. (Å) Magn. Latt. para. (Å) Magn.
a BCC-type cell with 58 Mn atoms, and ferrimagentic (FRM) ordering with absolute values of moments ranging from 0.0 to 2.8372-75, see the text for details. Here NM represents non-magnetic, AFM anti-ferromagnetic and FM ferromagnetic.
HCP-Sc 1.36/1.19 a = 3.320 NM 3.309 (ref. 69) NM
c = 5.164   5.273
HCP-Ti 1.54/1.38 a = 2.924 NM 2.9508 (ref. 69) NM
c = 4.626   4.6855
BCC-V 1.63/1.53 a = 2.979 NM 3.03 (ref. 69) NM
BCC-Cr 1.66/1.65 a = 2.855 AFM ± 1.06 2.8787 (ref. 68) FRM (ref. 71 and 77), 0–1.30
2.91 (ref. 69)
BCCa-Mn 1.55/1.75 a = 8.605 FRMa, 0–2.9 8.877 (ref. 72) FRM (ref. 72 and 75), 0–2.9
c = 8.604   8.873
BCC-Fe 1.83/1.80 a = 2.833 FM 2.21 2.8665 (ref. 68) FM,79 2.17
2.8607 (ref. 69)
HCP-Co 1.88/1.84 a = 2.496 FM, 1.63 2.5071 (ref. 69) FM (ref. 80 and 82), 1.60
c = 4.033   4.0695
FCC-Ni 1.91/1.88 a = 3.524 FM, 0.63 3.5175 (ref. 68) FM,78 0.60
3.524 (ref. 69)
FCC-Cu 1.90/1.85 a = 3.637 NM 3.6149 (ref. 68) NM
3.6077 (ref. 69)
HCP-Zn 1.65/1.59 a = 2.650 NM 2.6649 (ref. 69) NM
c = 5.046 4.9468
N (N2) 3.04/3.066 d(N–N): 1.11 d(N–N): 1.10


The early transition metals Sc, Ti and V are non-magnetic. Elemental Cr has a simple BCC structure,68,69 but a complex spiral-like magnetic ordering.70,71 In the present calculations we limit ourselves to the anti-ferromagnetic ordering with one layer of Cr atoms being magnetically opposite to the neighboring layer ones, considering the small energy differences between the spiral magnetic ordering and AFM ordering.70,71

The calculations also showed that the non-magnetic (NM) solution has just a slightly higher energy (about 10 meV/Cr). That agrees with the complex magnetic behavior of Cr metal.11,12,68–72 There are also discussions about the ground state of Co.11,35 Therefore, we also performed structural optimization and total energy calculations for HCP-, BCC- and FCC-Co. The calculations showed that all the three phases being ferromagnetic (FM) with the order of stability: HCP-Co (set dE = 0.0 eV/Co) > FCC-Co (dE = +0.019 eV/Co) > BCC-Co (dE = +0.099 eV/Co), in agreement with the experimental observations68,69,76 and the former theoretical calculations.11,35,74 The calculated magnetic moments (1.60 μB/Co for HCP-phase, 1.64 μB/Co for FCC-phase, and 1.74 μB/Co for BCC-phase) are close to the former calculations (1.63 μB/Co for HCP-phase, 1.67 μB/Co for FCC-phase, and 1.76 μB/Co for BCC-phase) by Matar and co-workers using the all electron augmented spherical wave (ASW) method.35 The crystal structure and magnetic ordering of pure Mn have been a topic of interest. Both experimental and theoretical studies showed the dependence of crystal structure on its spiral-like magnetic structure.72,75 Here we use a simplified ferrimagnetic (FR) ordering model to optimize its structure and to obtain total valence electron energy as a reference.75 Our calculations provide a solution with a nearly cubic lattice which agrees with the experimental values within 1% (as shown Table 1). The obtained local magnetic moments are: Mn1 (2 atoms) 2.98 μB, Mn2 (8 atoms) −2.27 μB, Mn3 (24 atoms) 0.47 μB and Mn4 (24 atoms) −0.12 μB. The calculated local moments are in agreement with the experimental values (e.g. the absolute values, Mn1 2.83 μB, Mn2 1.83 μB, Mn3 0.5 to 0.6 μB and Mn4 0.45 to 0.48 μB by Lawson et al.72), considering the strong dependence of the (spiral) magnetism on temperature, impurity, etc. In fact as summarized by Hobbs and co-workers, both experimental measurements and theoretical calculations provide a significant variety of local moments.75 Therefore, the present calculations provide one ferrimagnetic solution with reasonable stability.

Overall, the calculated lattices of the 3d transition metals are in good agreement with the experimental values (<2%, Table 1). The calculated local magnetic moments for AFM BCC-Cr, FR α-Mn (a BCC-type cell), and FM BCC-Fe, FM HCP-Co and FM FCC-Ni are close to the available experimental values and former theoretical calculations in literature.12,68–82

3.2. Stability, structural properties and chemical bonding of the M4N phases

As shown in Fig. 1, I-M4N has a perfect M FCC sub-lattice with one N atom occupying one of the octahedral sites. The N atoms also are a simple cubic lattice in the I-phases. It should be realized that due to the magnetic ordering, the symmetry of I-M4N (M = Cr, Mn, see 3.3) is lowered into a tetragonal sub-lattice. In the II-M4N phases, the N atoms form a body-centered tetragonal sub-lattice (BCT). This arrangement allows the M FCC sub-lattice to become one face-centered tetragonal (FCT) lattice.

Table 2 lists the calculated lattice parameters and formation energies for the M4N phases. Fig. 2 shows the stability of the I- and II-M4N phases relative to the corresponding non-magnetic I-phases according to Table 2. Table 3 lists the calculated lattice parameters for non-magnetic FCC-3d transition metals, nonmagnetic and magnetic I-M4N, and for II-M4N.

Table 2 DFT-GGA calculation results (lattice parameters, local magnetic moments and formation energies from eqn (1)) for the M4N phases. Available experimental and selected former theoretical calculations are included for sake of comparison. FR-I indicates M1 being antiparallel to M2. FR-II indicates one layer antiparallel to neighboring layers along z-axis. FR-III indicates two layers of metal atoms anti-parallel to the metal atoms in the neighboring two layers
  I-M4N II-M4N
Latt. para. (Å) Magnetism ΔE(eV) Latt. para. (Å) Magnetism ΔE(eV/f.u.)
Sc4N 4.555 NM −2.980 4.470 NM −3.389
      9.711    
Ti4N 4.162 NM −3.624 4.145 NM −3.701
      8.492    
V4N 3.920 NM −2.208 4.128 NM −2.672
(3.979)47     6.832    
Cr4N 3.776 NM −0.329 3.832 NM −0.628
3.814 FR-I −0.463 7.161    
Mn4N 3.696 NM −0.080 3.829 FR-III −0.659
3.849 FR-I −0.758 7.446    
(3.864)97,98          
3.740 FR-II        
3.783 (See text) −0.768      
Fe4N 3.672 NM 1.134 3.782(3.792)25 FM −0.145
3.793 FM −0.205 7.368(7.584)25    
(3.790)18          
Co4N 3.685 NM 1.318 3.731 FM 0.474
3.728 FM 0.415 7.369    
(3.738)25          
Ni4N 3.733 NM 0.509 3.760(3.72)9 NM 0.306
3.739 FM 0.470 7.271(7.28)    
(3.72)8          
Cu4N 3.877 NM 1.531 3.887 NM 1.696
(3.193)21     7.647    
Zn4N 4.1797 NM 1.912 4.0887 NM 1.757
      8.7043    


image file: c3ra47385f-f2.tif
Fig. 2 Formation energies (ΔEform) of I- (filled black spheres) and I-M4N phases (filled red squared) with respect to the nonmagnetic I-M4N. Clearly, I-M4N phases are more stable than II-M4N for M = Mn, Fe Co and Cu. Meanwhile, for M = Sc, Ti, V Cr, Ni (and Zn), the II-M4N phases are favored over the corresponding I-M4N phases. The dotted lines are drawn to guide the eyes.
Table 3 Inter-atomic distances for cubic I-M4N, tetragonal I-M4N due to ferrimagnetism (FRM), and tetragonal II-M4N phases. The fractional coordinates of atoms in I-M4N are: one N at (1/2,1/2,1/2); one M1 at (0,0,0), and three M2 at (1/2,0,1/2), (0,1/2,1/2) and (1/2,0,1/2) as shown in Fig. 1. For the tetragonal II-M4N phases which have two lattice parameters a and c (∼2a), the fractional coordinates of atoms are: N at (0,0,0), and (1/2,1/2,1/2); M1 at (0,1/2,0), (1/2,0,0), (0,1/2,1/2) and (1/2,0,1/2); M2 at (0,0,z), (0,0, − z), (1/2,1/2,1/2 − z) and (1/2,1/2,1/2 + z) with z ∼ 0.25. Note, in the schematic structure of II-M4N in Fig. 1, the origin is shifted with z ∼ 0.25
System Lattice M1– distance to M2– distance to N– distance to
I-M4N Cubic a M2: √2a/2 (×12) N: a/2 (×2) M2: a/2 (×6)
  M1: √2a/2 (×4)  
  M2: √2a/2 (×8)  
I-M4N Tetragonal a, c M2: √(a2 + c2)/2 (×12) N: a/2 (×1) M2: a/2 (×4)
  c/2 (×1) c/2 (×2)
  M1: √(a2 + c2)/2 (×4)  
  M2: √2a/2 (×4)  
  √2c/2 (×4)  
II-M4N Tetragonal a, c N: a/2 (×2) N: zc (×1) M1: a/2 (×4)
M1: √2a/2 (×4) M1: √{a2+[zc]2}/2 (×4) M2: zc (×2)
M2: √{a2 + (zc)2}/2 (×4) √{a2+[(1/2 − z)c]2}/2 (×4)  
√{a2+[(1/2 − z)c]2}/2 (×4) M2:√2a/2 (×4)  


For the cubic I-M4N, the structure is determined by its lattice parameter a. For the tetragonal I-type phases, two lattice parameters a and c are required. However, the fractional atomic coordinates are the same: one N at (1/2,1/2,1/2); one M1 at (0,0,0), and three M2 at (1/2,0,1/2), (0,1/2,1/2) and (1/2,0,1/2) as shown in Fig. 1. For the tetragonal II-M4N phases which have two lattice parameters a and c (∼2a), the fractional coordinates of atoms are: N at (0,0,0), and (1/2,1/2,1/2); M1 at (0,1/2,0), (1/2,0,0), (0,1/2,1/2) and (1/2,0,1/2); M2 at (0,0,z), (0,0,−z), (1/2,1/2,1/2 − z) and (1/2,1/2,1/2 + z) with z ∼ 0.25.

Note that in the schematic structure of II-M4N in Fig. 1 the origin is shifted with z ∼ 0.25 with respect to the abovementioned fractional coordinates of atoms. The structural optimizations provide the z-coordinates for M2 atoms as follows, z(Sc2) = 0.2265 (II-Sc4N), z(Ti2) = 0.2416 (II-Ti4N), z(V2) = 0.2783 (II-V4N), z(Cr2) = 0.2650 (II-Cr4N), z(Mn2) = 0.2572 (II-Mn4N), z(Fe2) = 0.2597 (II-Fe4N), z(Ni2) = 0.2545 (II-Ni4N), z(Cu2) = 0.2600 (II-Cu4N), and z(Zn2) = 0.2551 (II-Zn4N). It is clear that for M = Sc, Ti, the neighboring M2 atoms tend to approach the N atoms.

The very short c-axis in II-V4N causes repulsion of M2 atoms from the N atoms with a significantly large z(V2) value. For the other II-M4N phases, the M2 atoms shift away moderately from the N atoms with z(M2) ranging from 0.255 (M = Zn) to 0.265 (M = Cr).

We started from the lattice parameters for the 3d transition metals with a non-magnetic solution (Fig. 3). The lattice parameters change smoothly with the atomic number in a valley shape: they decrease from Sc to Fe and then increase to Zn. As shown in Fig. 3, the dependence of the a lattice parameter of non-magnetic I-M4N on the atomic number of the metals is very similar to that of the nonmagnetic FCC-metals, with some differences: except for M = Sc, the lattice parameters of the cubic non-magnetic I-M4N phases are larger than those of corresponding FCC metals. This is due to the atomic volume of N atoms in the lattices.


image file: c3ra47385f-f3.tif
Fig. 3 Calculated lattice parameters for non-magnetic FCC-3d transition metals (open black circles), nonmagnetic I-M4N (red sold squares), magnetic I-M4N (red diamonds) and a-axis (green solid triangles up) and half the c-axis (solid triangles-down) of II-M4N. Lines are drawn to guide the eye.

Magnetism has a strong impact on the lattice parameters of the I-M4N phases. For M = Sc–V, the I-M4N phases are non-magnetic. For M = Cr and Mn, the I-M4N phases have ferri-magnetic ordering, and as a consequence the lattices become tetragonal with a being identical for M = Cr (a pseudo-cubic lattice), and c/a being equal to 1.011 for M = Mn. For M = Fe to Ni, the I-M4N phases are ferromagnetic and cubic with their lattice parameters larger than the corresponding non-magnetic lattices. The last two the I-M4N phases with M = Cu and Zn are non-magnetic.

The high symmetry of cubic I-Mn4N phases gives a simple geometrical relationship for calculating the bond lengths in the structures: each M1 has 12 M2 neighbors with a bond length of √2a0/2 (a0 is the lattice parameter), while each M2 atom has 4 M1 and 8 M2 nearest neighbors with the same bond length, and 2 N neighbors with a M–N distance of a0/2. Meanwhile the relationships between the chemical bonds and lattice parameters become more complicated with distortions of the lattices for tetragonal I-M4N due to magnetism (M = Cr, Mn). N ordering also causes distortion of the II-M4N lattices. We list the relationships for the different M4N phases in Table 3.

Fig. 3 also shows the lattice parameters for the II-M4N phases. For sake of comparison we plot c/2, as shown in Fig. 1. As shown in Table 2, the length of a-axis is smaller than that of c/2 for Sc and Ti. This relationship changes dramatically when M = V and for the other M = 3d metals the c/2a values are smaller than 1. Here we divide the M4N phases into four different species according to their characteristics, as discussed below.

3.2a. M = Sc–V. The calculations showed that both I- and II-M4N phases are stable relative to the elemental metal and the N2 molecule, with the II-phases being favored over I-M4N. For the calculated lattices, there is a strong change in the lattice parameters: for M = Sc and Ti, the a-axis of II-phases are shorter than those of the corresponding I-phases. The c/2a rations are larger than 1, in contrast to the M = V phases where II-V4N has a longer a-axis and a small c/2a ratio, as shown in Table 2.

The calculations also showed that II-Sc4N has a slightly shorter a-axis than that of I-phase, and a large c/2a ratio (=1.086). Total energy calculations showed that both Sc4N phases have higher stability with respect to the elemental HCP-Sc and the N2 molecule (Table 2). The situation for the Ti4N phases is very similar to that of Sc4N, as shown in Table 2 and Fig. 2 and 3. There are also some differences. The calculations show a smaller energy difference between the I- and II-phases. The c/2a ratio being 1.024 for II-Ti4N is less significant than that for I-Sc4N. The fractional atomic coordinates (z = 0.2265 for II-Sc4N and z = 0.2416 for II-Ti4N) are smaller than 0.25. That indicates that the M2 atoms/ions are attracted to N atoms, which stabilizes the two II-phases.

Both V4N phases show high stability relative to the elemental BCC-V and N2, as mentioned above. Comparatively, the calculations showed a significantly different behavior for the V4N phases: an a lattice parameter (4.128 Å) for the II-phase that is much larger than that (3.920 Å) of I-V4N; and a small c/2a ratio being equal to 0.83 for II-V4N. The calculated lattice parameter for I-V4N is close to that (3.984 Å) of the former work by dos Santos and co-workers, the only paper for I-V4N found in literature.47 The calculations also show that both V4N are non-magnetic, in agreement with the former calculations.47 The significant lattice changes (long a-axis and short c-axis) are the origin of stabilization of the II-V4N phase.

The calculations showed that the M4N (M = Sc–V) phases are stable relative to the elemental solids and nitrogen gas (Table 2). However, there are no experimental observations for the above-mentioned phases.82–93 The stable binary compound in the Sc–N system is ScN with NaCl-type structure which has an FCC-Sc sub-lattice.82,83 We performed first-principles calculations for ScN and obtained a = 4.518 Å, in good agreement with the recent experimental value, 4.5005 Å.83

From the equation: Sc4N(s) = 3Sc(s) + ScN(s) + ΔHform, then ΔHform = +0.855 eV/f.u. for I-Sc4N and +0.446 eV/f.u. for II-Sc4N under the conditions T = 0 K and p = 0 Pa, with the ignoring of zero-vibration contributions. This indicates that both I- and II-Sc4N phases are metastable with respect to rocksalt ScN and HCP-Sc metal. This conclusion agrees with the experimental observation.82,83 For titanium and vanadium nitrides, we also tried to compare the stability of M4N phases relative to the well-known MN phases with the reactions: M4N(s) = 3M(s) + N(s) + ΔHform, and found that ΔHform = −0.505 eV for II-Ti4N and ΔHform = −0.759 eV for II-V4N. However, it has been well-established that there are chemical non-stoichiometric compounds, e.g. δ′-MN1−x with FCC-M sub-lattices with deficiency x being as high as about 0.4.84–93 The defective structures contain significant contributions from configurational entropy for the reactions typically taking place at elevated temperatures. Simple solid reactions are not available due to the interplay of complex crystal structures and defects. Meanwhile, the possibility to form II-M4N (M = Ti and V) could not be excluded. These systems are worth future investigations.

3.2b. M = Cr and Mn. The M4N phases with M = Cr and Mn are calculated to be more stable than the elemental solid and N2. Both elements in the M4N phases exhibit unique magnetic properties. The two elements have different influences on the phase relations (Table 2 and Fig. 2).

The calculations showed that magnetism lowers the formation energy of I-Cr4N by about 0.34 eV/f.u. (Fig. 2) The magnetism also reduced the symmetry of I-Cr4N into tetragonal with almost identical lengths of the a- and c-axis (pseudo-cubic). Meanwhile, the II-phase is calculated to be non-magnetic, with its formation energy about 0.156 eV/f.u. lower than that of the magnetic I-phase (Fig. 2). There are several binary compounds in the Cr–N binary phase.94,95 One of them is CrN with zinc-blende structure. We performed total energy calculations for CrN with NaCl-type structure. The calculations using the anti-ferromagnetic ordering produced lattice parameters a = 4.1435 Å and c = 4.1267 Å, with a local magnetic moment of 2.358 μB/Cr.

Experimentally, Aoki and co-workers prepared CrN samples at high temperature with a cubic lattice (a = 4.146 Å).96 Considering the magnetic effects, our calculated CrN lattices are close to the experimental values.96 Using the formula: Cr4N(s) = 3Cr(s) + CrN(s) + ΔHform, we obtained ΔHform = +0.356 eV for I-Cr4N and + 0.205 eV for II-Cr4N. Therefore, both I- and II-Cr4N phases are metastable with respect to CrN and BCC-Cr solids.

An even larger effect of magnetism on the formation energy is observed for I-Mn4N (Fig. 2). Two solutions have been obtained for I-Mn4N: one FR-I with the magnetic moments of Mn1 anti-parallel to those of M2 atoms. Another one is with one layer of M atoms anti-parallel to the neighboring layers. The calculations show only a very small energy difference (about 10 meV/f.u.) (Table 2). Therefore, we expect that more complex magnetic orderings are possible within the structure, without significant energy differences. The calculated lattice parameter for I-Mn4N is close to the experimental value within 1%, as shown in Table 2.97–99 Mohn and co-workers also performed electronic structure calculations for I-Mn4N with the experimental lattice parameter and also obtained a FR-I ordering.34 Similar results were obtained by Siberchicor and Matar.33 Our calculations also showed that the lattice of I-phase is slightly more stable than the II-phase with an energy difference of 0.110 eV/f.u. Such a small energy difference also indicates the possibility of co-existence of the two phases at elevated temperature, considering that only the Mn4N phase with presumed I-type structure has been prepared experimentally.97,98

3.2c. M = Fe, Co and Ni. Although the ground state of the metastable FCC-Fe has a spiral magnetic structure,100 addition of carbon or nitrogen can induce ferro-magnetism.101 The M4N (M = Fe, Co and Ni) phases are expected to have ferromagnetic ordering from the available experimental measurements and theoretical simulations.1–9,17–35 The cubic symmetry for the I-M4N is then retained and is determined by its lattice parameter a (Table 2 and Fig. 3). The calculated structures agree well with the experimental data for M = Fe–Ni, as shown in Table 2. Kong and co-workers performed electronic structure calculations for II-Fe4N by assuming lattices a = a0 (lattice parameter of I-type structure) and c = 2a.25 The calculated lattice parameter for I-Co4N is close to the experimental value (3.738 Å),103,104 and is much larger than the experimental value (3.587 Å) by Oda and co-workers.105 The small lattice parameter may originate from N deficiency.35 Our calculated lattice parameter for I-Co4N is also close to the value of 3.737 Å by Matar and co-workers who used the DFT-GGA scheme.35 The magnetism leads to a slight volume increase of the I-M4N phases. Both I- and II-type phases are ferromagnetic and the I-type structure has a higher stability (Table 2). The calculations showed that I-Ni4N is magnetic while II-Ni4N is non-magnetic and is more stable than the I-type lattice.

The calculations give a formation energy of −0.205 eV/f.u. for I-Fe4N and −0.145 eV/f.u. for II-Fe4N. That indicates stability of the Fe4N phases with respective to elemental BCC-Fe metal and N2, in agreement with the experimental observations of the stable I-Fe4N phase.16,18,102 The small energy difference also indicates that the less stable II-Fe4N phase may be synthesized at elevated temperature experimentally.

The calculations also showed that for M = Co and Ni, the formation energies are positive with respect to the elemental solids (HCP-Co and FCC-Ni) and N2 molecule The phase diagrams for Co–N106,107 and Ni–N108 show a stable M3N phase and metastable M4N phase, in line with our calculations. Experimentally, I-Co4N samples were obtained by different approaches,19,20 and both I- and II-Ni4N were obtained by means of nitridization of Ni metal at elevated experimentally.4,8,9

3.2d. M = Cu and Zn. Both elements have fully occupied 3d states (3d10). The M4N phases are non-magnetic as shown in Table 2. Our calculations for I-Cu4N produced a lattice parameter of about 3.877 Å. There is only one experimental report on I-Cu4N samples prepared by DC plasma (ion) heating of copper sheet in a nitrogen and hydrogen atmosphere to 450 to 530 °C.21 The authors also reported their results of structural analysis. The cubic Cu4N phase has a lattice parameter of 3.193 Å which is much smaller than that of the present calculations, and even smaller than the lattice parameter (3.615 Å) of pure copper.68,69 However, our calculated lattice parameter (3.877 Å) agrees with the recent theoretical results (3.888 Å).49,109 The too small lattice parameter obtained experimentally may originate from impurity of the samples, as Cu4N is calculated to be metastable or unstable with significant higher formation energy with respect to the elemental Cu and nitrogen gas (Table 2). In order to have a better understanding about the stability and structural properties of the M4N phases, we also performed calculations for the well-known Cu3N phase with the anti-Re3O type structure.49,109 Our calculations produced a lattice parameter of 3.837 Å, close to the experimental value (3.819 Å),110 and the former calculations 3.846 (ref. 49) and (3.849 Å).110 From the equation: Cu4N(s) = Cu (s) + Cu3N (s) + ΔHform, we obtained ΔHform = +0.372 eV/f.u. for I-Cu4N and +0.537 eV/f.u. for II-type phase. Therefore, the Cu4N phases are metastable with respect to Cu metal and Cu3N. For the Zn4N phases, the II-type is more stable than the I-Zn4N. However, both phases are metastable with respect to the elemental HCP-Zn and N2 molecule. In fact, zinc nitride is stable with a rather strict chemical composition Zn3N2. That is understandable since Zn atom behaves more like a normal metal rather than a transition metal111,112 with the occupied 3d states being regarded as semi-core.13,113

The 3d transition metal nitrides M4N also provide an opportunity to investigate chemical bonding and charges at atomic sites and charge-transfer between the 3d transition metals and nitrogen atoms/ions.114 As shown in Section 2.2, the Bader approach can be used to determine unambiguously the charge on atoms and the charge transfer in crystals.56–58 The results are shown in Fig. 4 and Table S1.


image file: c3ra47385f-f4.tif
Fig. 4 Bader charges at the different metal sites (top), and N ions (bottom) (also see Table S1). The differences (Δχ) between the electronegativity of a metal and that of N for the two sets of electronegativity of 3d transition atoms with the formula, Δχ = χ(M) – χ(N), are also included for sake of comparison. Lines are drawn to guide the eye.

In chemistry, the electro-negativity χ is an important parameter and it describes the tendency of an atom to attract electrons.114,115 The difference Δχ between two atoms indicates the difference in capability to attract electrons. In other words, it is indicative of the charge transfer between atoms/ions in a crystal. At present there are two sets of electro-negativity parameters. The widely used ‘Pauling electro-negativity’ of elements was calculated by Allred in 1981 with χ listed in Table 2.116 In 1989, Allen published his set of electro-negativity values for elements.117 Fig. 4 includes the electro-negativity differences between the metallic atom and nitrogen atom: Δχ = χ(M) – χ(N). Fig. 4 shows the Bader charge at different atomic sites in the M4N phases and the Δχ values for the two sets (Pauling scale and Allen scale).116,117

As shown in Fig. 4, the two curves of Δχ values on atomic numbers of the metal atoms in the M4N phases have very similar trends with exception for Mn: Δχ increases and reach a maximum at Ni; and then decreases to M = Zn.

Generally the charge Q(N) curves in I- and II-M4N are similar to those of Δχ except for M = Ti and Co. The Q(N) curve for I-M4N is below that of the II-phases. More interesting is the charge at the metal sites (Fig. 4, top): the M1 atoms that are far away (d(M1–N) = √3 ao/2) from the N atoms in I-M4N lose much more electrons, while the M2 atoms lose less, only about 1/3 to 1/2 of the number of electrons lost by the M1 atoms. Please note that the M1 atoms do not have any N atoms as nearest-neighbors. These results indicate strong interactions between the M1 and M2 atoms. In the II-M4N phases, the M1 atoms lose more electrons than the corresponding M2 atoms, in accordance with the fact that each M1 is connected to two N atoms while each M2 atom is coordinated by only one N atom (Fig. 1 and Table 3).

3.3. Electronic and magnetic properties of M4N

We first analyze the eigenvalues of M 3d states in the crystal field of the FCC-lattice using M = Ni as an example. At the Γ point in the Brillouin zone, the five 3d orbitals split into two degenerate states, triplet eg and doublet t2g. For NM Ni, the splitting between t2g (lower in energy) and eg (higher in energy) is about 1.1 eV. Spin-polarization calculations produce exchange interaction energies of about 0.7 eV for eg and 0.6 eV for the t2g band. The itinerant nature of Ni 3d states and s–d interactions cause the large dispersion of the states.10–13 Therefore, there are no apparent peaks of the t2g and eg bands as shown in Fig. 5. In non-magnetic I-M4N (M = Ni) the M1 3d states form a narrow band between −1.0 to 0.5 eV with some tails between −4 and −1.0 eV. The M2 3d states have broad band with a width by about 4.5 eV, originating from the M2-N interactions. Therefore, the large charge loss at the M1 sites to N takes place via M1–M2 bonding. It is also notable that there are strong overlaps between M1 and M2 in the energy range −4 to −1 eV, indicating strong interactions between M1 and M2 3d states. In fact eigen-symmetry analysis for the lowest states of the Ni 3d states at Γ shows a doublet band with contributions from both M1 and M2. For the II-type structures, the lower symmetry and chemical bonds have reduced the degeneracy of states. The detailed partial DOS and total DOS curves for all the M4N phases are shown in Fig. 6(a–i) and are discussed in detail below.
image file: c3ra47385f-f5.tif
Fig. 5 Schematic pDOS curves for M 3d states of a non-magnetic fcc-metal (top) and of M1 and M2 atoms in nonmagnetic I-M4N using M = Ni as the example.

image file: c3ra47385f-f6.tif
Fig. 6 Partial and total density of states for Sc4N (a), Ti4N (b), V4N (c), Cr4N (d), Mn4N (e), Fe4N (f), Co4N (g), Ni4N (h) and Cu4N (i) phases.

As mentioned before, the electronic structure and magnetic properties of I-Fe4N have been carefully studied by first-principles methods.5–7,17,22–32 Kong and co-workers performed electronic structure calculations for II-Fe4N by assuming lattices a = a0 (lattice parameter of I-type structure) and c = 2a.25 There are also first-principles studies on the electronic and magnetic properties of the I-M4N phases for M = V.47 Mn,33,34 Co,35 Ni (ref. 41) and Cu.49,109

Fig. 5 shows a typical electronic structure of a (non-magnetic) M4N phase compared with FCC-M (M = Ni as example). The partial density of the Ni 3d states of the non-magnetic FCC-Ni solution is included for comparison. The characteristics of the electronic properties and local electronic configurations and local magnetic moments in the atomic spheres with Wigner–Seitz radii of 1.40 Å for metals and 1.00 Å for N are listed in Table S2 (ESI). Details of the partial and total DOS for the M4N phases are given in Fig. 6a–i. The overall electronic structure for the M4N phases is composed of two separate parts: occupied N 2s states at about −16 eV with band-widths of about 1.0 to 2.5 eV and valence -conduction bands starting from about −8 eV below its Fermi level which is set at zero eV. The rather notable band widths of the N 2s states indicate interactions between the semi-core N 2s electrons and other atoms. However, this interaction does not contribute to the chemical bonding since both bonding and anti-bonding states are occupied.

As shown in Fig. 5 and 6, the N 2p bands can be well distinguished from the metal 3d states. The N 2p states are at the bottom of the valence bands. The 2p electrons in one N sphere (Wigner–Seitz radius of 1.0 Å) are about 3.0 electrons (Table S2). Note that the number of electrons at an atomic site is strongly dependent on the size of the sphere. When a radius of 1.32 Å is used for N, the number of the 2p electrons at the N site becomes 4.12 electrons. As shown in Fig. 4, Bader charge analysis yields a charge of −2.5 to −1.5 electrons on the N atoms. This relates to the ionic nature of the M4N crystals.

As discussed above, the magnetism of the M4N phases has been a subject of intensive research. Here we discuss the magnetism of the M4N phases in detail. As shown in Tables 2 and 3 and Fig. 2 and 6, the I-M4N phases are magnetic for M = Cr to Ni, while II-Cr4N and II-Ni4N are non-magnetic. Fig. 7 shows that I-Cr4N, I-Mn4N, and II-Mn4N are calculated to have ferri-magnetic ordering, while I-M4N with M = Fe, Co and Ni, as well as II-Fe4N and II-Co4N are ferro-magnetic. Fig. 7a shows the dependence of local magnetic moments on the metal atoms. In the I-M4N phases, the M1 atoms have significantly larger magnetic moments than the corresponding values at the M2 atoms. That corresponds to the higher charges at the M1 atoms/ions in comparison to those in the M2 atoms of I-M4N phases, as shown in Fig. 4 and Table 3. Comparatively, the local moments in II-M4N are more complex. While the Mn1 atoms in II-Mn4N have slightly larger magnetic moments than the corresponding Mn2 atoms, the Fe1 and Co1 atoms have smaller local moments than that of the Fe2 and Co2 atoms as shown in Table 3 and Fig. 7a.


image file: c3ra47385f-f7.tif
Fig. 7 (a) The absolute values of the local magnetic moments of the metal atoms in the M4N phases. (b) Relationship between the total magnetic moment and the number of 3d electrons in the ferromagnetic M4N phases (M = Fe, Co, Ni and Cu), i.e. Slater–Pauling curve (b). The dotted lines are drawn to guide the eyes.

There are few publications about the magnetism of the M4N phases, except for the case M = Fe where more studies have been performed. Our calculated local moments (3.40/−0.81 μB) for Mn1/Mn2 atoms in I-Mn4N are close to the experimental values (3.85/−0.90 μB, respectively),98 and agree well with the former calculations (3.23/−0.80 μB) by Mohn and co-workers using the atomic spherical wave approach.33,34 The calculated local moment (2.97/2.35 μB/Fe) of the Fe1/Fe2 atoms in I-Fe4N, are close to the experimental value (3.0/2.0 μB/Fe),1 as well as other first-principles calculations (2.98/1.79 μB/Fe,34 2.96/2.24 μB/Fe,17 2.98/2.23 μB/Fe (ref. 22)). The calculated local magnetic moments (1.96/2.54 μB/Fe) of the Fe1/Fe2 atoms in II-Fe4N also agree with the former theoretical calculations (2.03/2.54 μB/Fe, respectively) by Kong and co-workers who assumed the lattice parameters a = a0 and c = 2a0 (a0 is the lattice parameter of I-Fe4N).25 The calculations for I-Co4N also reproduced the results by Mater and co-workers35 as shown in Table S2.

The Slater–Pauling curves have been widely used to study the relationships between calculated magnetic moments and the number of 3d electrons for alloys118,119 and half-metals,120 as well as for for the compounds I-(Fe, Co)4N the Fe4N–Co4N system.6 Fig. 7b shows the Slater–Pauling curve for the ferro-magnetic M4N phases. The total magnetic moments in I-M4N decrease with increasing number of 3d electrons. That corresponds to the rigid band filling for the electronic structure of almost fully occupied 3d states for majority electrons. It is also clear that the magnetic moments of the II-M4N phases decrease rapidly with increasing number of 3d electrons, probably due to the local chemical bonding and distortion of the FCC-metal sub-lattices. As shown in Fig. 6g, the densities of Co1/Co2 3d states at the Fermi level for the spin-up (majority) electrons are extremely low, and high for the spin-down electrons. That corresponds to the nearly half-metallic nature first obtained by Takahashi and co-workers.6

To have a clear picture about the capability of spin-carriers for the M4N phases, we used the definition of spin-polarization ratio P:

 
P = [D(εF) − D(εF)]/[D(εF) + D(εF)] (5)
Where D(εF)/D(εF) represents the density of states of an atom/ions or a compound at Fermi level for the spin-up/spin-down electrons, respectively. For pure half metallic materials, such as semi-Heusler NiMnSb36,40 which is metallic for spin-up electrons (D(εF) ≠ 0) and semi-conducting for spin-down electrons (D(εF) = 0), then P = 1.0 (or 100%). Meanwhile for non-magnetic materials, D(εF) = D(εF), and consequently P = 0.0. The calculated spin-polarization ratios of the M1 and M2 atoms in the M4N phases and the P for the compounds are shown in Fig. 8. For sake of comparison, we only show the absolute P values (the negative ones are indicated with open symbols).


image file: c3ra47385f-f8.tif
Fig. 8 Calculated |P| values for M1 (triangle-up) and M2 (triangle-down) atoms and the compounds (spheres) for I- (black) and II-M4N (red) (M = Cr to Ni) phases. The P values with a negative sign are labeled by open symbols instead of solid symbols. The dotted lines are drawn to guide the eyes.

From the combination of Fig. 6 and 8, the P values for II-M4N are generally much lower than those of the corresponding I-phases. It is notable that the P values of the total DOS for II-M4N are considerably lower than those of the atoms, partially due to the contributions of N 2p states at the Fermi level (see Table 3). The absolute P values of the M1 atoms/ions in I-M4N (M = Cr to Ni) phases are much higher than those of the corresponding M2 atoms/ions. The P values are over 90% for I-M4N (M = Mn, Fe and Co) and near 87% for M = Ni. In contrast, the low values of the M2 atoms/ions cause the P values of the compounds to be much lower, 50 to 60% for M = Mn, Fe and Ni, but still to 83% for M = Co. The sign of the P value for Cr1 atoms is opposite to that of Cr2 atoms. As a consequence, the P value of I-Cr4N becomes rather small (about 17.4%). The high P values of M1 atoms in the I-M4N phases also provide the possibility to design new phases exhibiting high P values for potential applications in spintronics.6,38,40

3.4. Origin of the magnetism and phase stability of M4N

In the 1930s, Stoner investigated the relationship between the exchange interaction and kinetic contribution for a band structure and proposed the well-known Stoner criterion:50,121,122
 
I·D(εF) ≥ 1 (6)
Where D(εF) is the density of states at the Fermi level (εF). The Stoner parameter which is a measure of the strength of the exchange correlation is denoted I. Brooks performed first-principles calculations and obtained the Stoner parameters I for the many transition metals, including 3d transition metals12 as shown in Table S2.

Fig. 5 shows the calculated partial density (pDOS) of Ni 3d and N 2p states in a (nonmagnetic) FCC-metal (Ni as the example) and nonmagnetic I-M4N (M = Ni). As shown in Fig. 6, the pDOS curves for the M4N phases are very similar to the non-magnetic solution (Fig. 5). Therefore, we can estimate the electronic structure for different 3d metals using the electron filling approach (a rigid model). However, to have accurate results, we performed structural optimizations and electronic structure calculations for the non-magnetic I-M4N phases and the related (non-magnetic) FCC-metals. The calculated partial density of Ni 3d states are shown in Fig. 5 (top). The term I·D(εF) for each 3d metals is also shown in Fig. 9 (bottom) which shows that FCC-Sc has rather high D(εF) for 3d electrons, corresponding to the electron configuration Sc 3d1 4s2. That is also true for I-Sc4N. With increasing atomic number for the FCC-metal the value of D(εF) value increases, except for a small dip at Mn, and reach a maximum at Ni. D(εF) has a very small value for FCC-Cu, in agreement with the Cu 3d104s2 electron configuration. The D(εF) values for M 3d states in the I-M4N phases have different behaviors: D(εF) for M1 3d states increases smoothly from Sc to V, then quickly from Cr and reach maximum at Fe and Co finally fall to Cu; meanwhile D(εF) for M2 3d states first increases smoothly from Sc to Cr. There is a valley for M = Mn. Then it increases again from Fe and reached a maximum for M = Co.


image file: c3ra47385f-f9.tif
Fig. 9 Calculated density of states at the Fermi level, D(εF) (a) and the I·D(εF) values (b), for non-magnetic FCC 3d transiton metals (open black circles), M1 (solid red squares) and M2 (solid green diamonds) in the I-M4N phases. The dashed line with values being equal to 1 represented the Stoner criteria for instability of the nonmagnetic FCC metal lattices. I·D(εF) < 1 indicates that the non-magnetic solution is more stable while I·D(εF) > 1 indicates possible transitions: spin-polarization or John-Teller-like crystal-field distortions. The Stoner parameters I are listed in Table S2.

The Stoner curves, I·D(εF) shown at the bottom of Fig. 9 show strong similarity with the D(εF) curves for the M 3d electrons. Apparently for M = Sc and Ti, all the three curves are below 1. For M = V, the I·D(εF) values are close to 1, especially for V1 3d states in I-V4N. Then from Cr to Ni, all the curves are above 1 except for Mn2 atoms in I-Mn4N. In fact as shown in Table 3, in I-Mn4N the Mn1 atom has a very large magnetic moment of 3.4 μB, while the Mn2 atoms have only a small moment (−0.8 μB) which can be considered to be induced by the Mn1 atoms. It can be concluded that the Stoner criterion works well for the I-M4N phases.

For the II-M4N phases, from Mn to Ni, the metal/atoms ions exhibit magnetism. In contrast to the I-type structure, II-Cr4N and II-Ni4N are non-magnetic. Former calculations for N addition in FCC-Ni lattice showed that lattice distortion has a strong impact on the magnetism. While I-M4N is magnetic, chemical changes II-Ni4Nx (with x ∼ 0.03) cause local distortion and the defective phases becomes non-magnetic.41 That is also the case for II-Ni4N.

Another possibility to reduce the DOS at the Fermi level is provided by the Jahn–Teller theorem.123,124 The high symmetry of the FCC metal sub-lattices in I-M4N causes degenerate 3d states, and consequently a high density of states at the Fermi level (Fig. 8). The high DOS at the Fermi level causes the instability of the structure, which can lead to two possible effects. The first possibility is spin-polarization splitting or magnetism due to exchange interaction (Stoner effects). The second possibility is the distortion of the high-symmetry metal sub-lattice. And indeed, the metal sub-lattices in the II-M4N phases are distorted due to the different c/a ratio, which will reduce the degeneracy of the metal 3d states as well as the pDOS at the Fermi level. According to Fig. 8, the competition between magnetism and lattice distortion leads to higher stability of the non-magnetic II-Cr4N and II-Ni4N phases.

4. Conclusions

We performed first-principles calculations to predict in a systematic way the formation, stability and structures of the M4N phases using density-functional theory with generalized gradient approximation. Bader charge analysis and electronic band structure calculations were performed for all 3d transition metal M4N phases. The calculations showed that high stability of the II-M4N (M = Sc and Ti) phases over the corresponding I-type structures, originating from lattice relaxations and local chemical bonding between the M2 and N atoms. The predicted crystal structures and the obtained magnetic moments agree well with the available experimental data and former theoretical calculations. Bader charge analysis revealed the highly ionic nature of the compounds. Considering the small differences in formation energies, the calculations also predict that two M4N phases may be synthesized experimentally, e.g., by formation at elevated temperatures, by growth on a suitable substrate, or as nano-sized crystals. The predicted crystal structures can be useful for experimentalists to characterize the phases in prepared samples (thin films, coated layers, nano-sized particles, etc.), in particular because N is such a light atom that different N orderings are hard to distinguish experimentally. Electronic structure calculations showed strong interactions between M2 and N atoms, as well as metal–metal interactions in the phases. Remarkably, the M1 atoms in the I-type phases lose electrons to the N ions, though they do not have N atoms as nearest neighbors. Magnetism was observed for M4N with M = Cr to Ni. While ferrimagnetic solutions were found for I-Cr4N, I-Mn4N, and II-Mn4N, ferro-magnetism was found for M = Fe to Ni. It is also notable that II-Cr4N and II-Ni4N are non-magnetic due to the distortion of the FCC-metal sub-lattices, and chemical bonding. Finally, high spin-polarization ratios were found for the M1 atoms in I-M4N from M = Mn to Ni. The calculated results are helpful to design new compounds of desirable physical properties.

Acknowledgements

We thank Prof. Dr Alfons van Blaaderen for his careful reading and encouragements. MvH acknowledges a VIDI grant from the Dutch Science Foundation NWO.

Notes and references

  1. B. C. Frazer, Phys. Rev., 1958, 122, 751 CrossRef.
  2. S. Suzuki, H. Sakumoto, J. Minegismi and Y. Omote, IEEE Trans. Magn., 1981, 17, 3017 CrossRef.
  3. H. Jia, X. Wang, W. T. Zheng, Y. Chen and S. H. Feng, Mater. Sci. Eng., B, 2008, 150, 121 CrossRef CAS.
  4. A. I. Linnik, A. M. Prudnikov, R. V. Shalav, T. A. Linnik, V. N. Varyukhin, S. A. Kostyrya and V. V. Burkhovetskii, Phys. Lett., 2013, 39, 143 CAS.
  5. J. L. Costa-Krämer, D. M. Borsa, J. M. García-Martín, M. S. Martín-González, D. O. Boema and F. Briones, Phys. Rev. B: Condens. Matter Mater. Phys., 2004, 69, 144402 CrossRef.
  6. Y. Takahashi, Y. Imai and T. Kumagai, J. Magn. Magn. Mater., 2011, 323, 2941 CrossRef CAS.
  7. P. Dhanasekaran, H. G. Salunke and N. M. Gupta, J. Phys. Chem. C, 2012, 116, 12156 CAS.
  8. N. Terao, Naturwissenschaften, 1958, 45, 620 CrossRef CAS , (I-Ni4N).
  9. N. Terao, J. Phys. Soc. Jpn., 1960, 15, 227 CrossRef CAS , (II-Ni4N).
  10. C. Herring, J. Appl. Phys. Suppl., 1960, 31, 3S CrossRef CAS.
  11. S. Asano and J. Yamashita, Prog. Theor. Phys., 1973, 49, 373 CrossRef CAS.
  12. M. S. S. Brooks, in Conduction electrons in magnetic metals, in Magnetism in Metals, ed. D. F. McMorrow, J. Jensen and H. M. Rønnow, Det Kongelige Danske Videnskabernes Selskab, Denmark, 1997, p. 291 Search PubMed.
  13. N. F. Mott, Proc. Phys. Soc., London, Sect. A, 1949, 62, 416 CrossRef.
  14. O. Gunnarsson and K. Schonhammer, Phys. Rev. Lett., 1983, 50, 604 CrossRef CAS.
  15. J. Zaanen, G. A. Sawatzky and J. W. Allen, Phys. Rev. Lett., 1985, 55, 418 CrossRef CAS PubMed.
  16. K. H. Jack, Acta Crystallogr., 1952, 5, 404 CrossRef.
  17. X. G. Ma, J. J. Jiang, P. Liang, J. Wang, Q. Ma and Q. K. Zhang, J. Alloys Compd., 2009, 480, 475 CrossRef CAS.
  18. H. Jacobs, D. Rechenbach and U. Zachwieja, J. Alloys Compd., 1995, 227, 10 CrossRef CAS.
  19. X. Wang, H. Jia, W. T. Zheng, Y. Chen and S. H. Feng, Thin Solid Films, 2009, 517, 4419 CrossRef CAS.
  20. K. Ito, K. Harazunori, K. Toko, H. Akinaga and T. Suemasu, J. Cryst. Growth, 2011, 336, 40 CrossRef CAS.
  21. J. Blucher, K. Band and B. C. Giessen, Mater. Sci. Eng., A, 1989, 117, L1 CrossRef.
  22. R. Coehoorn, G. H. O. Daalderop and H. J. F. Jansen, Phys. Rev. B: Condens. Matter Mater. Phys., 1993, 48, 3830 CrossRef CAS.
  23. M. Neklyudov and A. N. Morozov, Physica B, 2004, 350, 325 CrossRef.
  24. S. Kokado, N. Fujima, K. Harigaya, H. Shimizu and A. Sakuma, Phys. Status Solidi B, 2006, 3, 3303 CrossRef CAS.
  25. Y. Kong, J. Pelzl and F. S. Li, J. Magn. Magn. Mater., 1999, 195, 483 CrossRef CAS.
  26. B. Eck, R. Dronskowski, M. Takahashi and S. Kikkawa, J. Mater. Chem., 1999, 9, 1527 RSC.
  27. N. Timoshevskii, V. A. Timoshevskii, B. Z. Yanchitsky and V. A. Yavna, Comput. Mater. Sci., 2001, 22, 99 CrossRef.
  28. S. Kodado, N. Fujima, K. Harigaya, H. Shimizu and A. Sakuma, Phys. Rev. B: Condens. Matter Mater. Phys., 2006, 73, 172410 CrossRef.
  29. T. Gressmann, M. Wohlschlögel, S. Shang, U. Welzel, A. Leineweber, E. J. Mittemeijer and Z. K. Liu, Acta Mater., 2007, 55, 5833 CrossRef CAS.
  30. D. Li, K. Roh, K. J. Jeon, Y. S. Gu and W. Lee, Phys. Status Solidi B, 2008, 245, 2581 CrossRef CAS.
  31. J. Yang, H. Sun and C. F. Chen, Appl. Phys. Lett., 2009, 94, 151914 CrossRef.
  32. Z. Q. Lv, Y. Gao, S. H. Sun, M. G. Qv, Z. H. Wang, Z. P. Shi and W. T. Fu, J. Magn. Magn. Mater., 2013, 333, 39 CrossRef CAS.
  33. B. Siberchicor and S. Matar, J. Magn. Magn. Mater., 1991, 101, 419 CrossRef.
  34. P. Mohn, S. Matar, G. Demazeau and E. P. Wohlfarth, J. Phys., Colloq., 1988, 8, 95 Search PubMed.
  35. S. F. Matar, A. Houari and M. A. Belkhir, Phys. Rev. B: Condens. Matter Mater. Phys., 2007, 75, 245109 CrossRef.
  36. R. A. de Groot, F. M. Müller, P. O. Van Engen and K. H. Buschow, J. Phys. Rev. Lett., 1983, 50, 2024 CrossRef CAS.
  37. J. H. Park, E. Vescova, H. J. Kim, C. Kwon, R. Ramesh and T. Venkatesan, Nature, 1998, 392, 794 CrossRef CAS.
  38. W. E. Pickett and J. S. Moodera, Phys. Today, 2001, 54, 39 CrossRef CAS.
  39. S. A. Wolf, D. D. Awschalom, R. A. Buhrman, J. M. Daughton, S. von Molnar, M. L. Roukes, A. Y. Chtchelkanova and D. M. Treger, Science, 2001, 294, 1488 CrossRef CAS PubMed.
  40. C. M. Fang, G. A. de Wijs and R. A. de Groot, J. Appl. Phys., 2002, 91, 8340 CrossRef CAS.
  41. C. M. Fang, M. H. F. Sluiter, M. A. van Huis and H. W. Zandbergen, Phys. Rev. B: Condens. Matter Mater. Phys., 2012, 86, 134114 CrossRef.
  42. J. Zhao, H. P. Xiang, J. Meng and Z. J. Wu, Chem. Phys. Lett., 2007, 449, 96 CrossRef.
  43. Z. J. Wu and J. Meng, Appl. Phys. Lett., 2007, 90, 241901 CrossRef.
  44. A. Houben, J. Burghaus and R. Dronskowski, Chem. Mater., 2009, 21, 4332 CrossRef CAS.
  45. J. Burghaus, M. Wessel, A. Houben and R. Dronkskowski, Inorg. Chem., 2010, 49, 10148 CrossRef CAS PubMed.
  46. T. Woehrle, A. Leineweber and E. J. Mittermeijer, Metall. Mater. Trans. A, 2012, 43, 610 CrossRef CAS.
  47. A. V. dos Santos, J. C. Krause and C. A. Kuhnen, Physica B, 2006, 382, 290 CrossRef CAS.
  48. J. G. Niu, W. Gao, X. P. Dong, L. Guan and F. Xie, Adv. Mater. Res., 2010, 150–151, 1290 CrossRef.
  49. Z. F. Hou, Solid State Sci., 2008, 10, 1651 CrossRef CAS.
  50. E. C. Stoner, Proc. R. Soc. London, Ser. A, 1938, 165, 372 CrossRef.
  51. D. M. Edwards and E. P. Wohlfarth, Proc. R. Soc. London, Ser. A, 1968, 303, 127 CrossRef CAS.
  52. R. Niewa and F. J. DiSalvo, Chem. Mater., 1998, 10, 2733 CrossRef CAS.
  53. J. W. Christian, The theory of transformation in metals and alloys, Pergamon Press, Amsterdam/Boston/London/New York/Oxford/Paris/San Diego/San Francisco/Singapore/Sydney/Tokyo, 2002 Search PubMed.
  54. C. M. Fang, M. A. van Huis, M. H. F. Sluiter and H. W. Zandbergen, Phys. Rev. Lett., 2010, 105, 055503 CrossRef CAS PubMed.
  55. C. Domain, C. S. Becquart and J. Foct, Phys. Rev. B: Condens. Matter Mater. Phys., 2004, 69, 144112 CrossRef.
  56. R. F. W. Bader and P. M. Beddal, Chem. Phys. Lett., 1971, 8, 29 CrossRef CAS.
  57. R. F. W. Bader, T. T. Nguyen and Y. Tal, Prog. Phys., 1981, 44, 893 CrossRef.
  58. G. Henkelman, A. Arnaldsson and H. Jónsson, Comput. Mater. Sci., 2006, 36, 254 CrossRef.
  59. G. Kresse and J. Hafner, Phys. Rev. B: Condens. Matter Mater. Phys., 1993, 47, 558 CrossRef CAS.
  60. G. Kresse and J. Furthmüller, Comput. Mater. Sci., 1996, 6, 15 CrossRef CAS.
  61. C. M. Fang, M. A. van Huis, J. Jansen and H. W. Zandbergen, Phys. Rev. B: Condens. Matter Mater. Phys., 2011, 84, 094102 CrossRef.
  62. P. E. Blöchl, Phys. Rev. B: Condens. Matter Mater. Phys., 1994, 50, 17953 CrossRef.
  63. G. Kresse and J. Furthmüller, Phys. Rev. B: Condens. Matter Mater. Phys., 1999, 54, 1758 CrossRef.
  64. J. P. Perdew, K. Burke and M. Ernzerhof, Phys. Rev. Lett., 1996, 77, 3865 CrossRef CAS PubMed.
  65. C. Amador, W. R. Lambrecht and B. Segall, Phys. Rev. B: Condens. Matter Mater. Phys., 1992, 46, 1870 CrossRef CAS.
  66. C. M. Fang, M. A. van Huis, M. H. F. Sluiter and H. W. Zandbergen, Acta Mater., 2010, 58, 2968 CrossRef CAS.
  67. H. J. Monkhorst and J. F. Pack, Phys. Rev. B: Solid State, 1976, 13, 5188 CrossRef.
  68. R. W. G. Wyckoff, Crystal Structures, Intersciences, New York, NY, 1964 Search PubMed.
  69. There are many summaries for the symmetry and lattice parameters of elemental metals, e.g. http://www.perionic%20table.com/Elements.
  70. L. Corliss, J. Hastings and R. Weiss, Phys. Rev. Lett., 1959, 3, 211 CrossRef CAS.
  71. R. Soulairol, C. C. Fu and C. Barreteau, Phys. Rev. B: Condens. Matter Mater. Phys., 2011, 8, 214103 CrossRef.
  72. A. C. Lawson, A. C. Larson, M. C. Aronson, S. Johnson, Z. Fisk, P. C. Canfield, J. D. Thompson and R. B. Von Dreele, J. Appl. Phys., 1994, 76, 7049 CrossRef CAS.
  73. N. N. Greenwood and A. Earnshaw, Chemistry of the Elements, Butterworth-Heinemann, ISBN 0080379419, 2nd edn, 1997, p. 240 Search PubMed.
  74. V. Iota, J. H. P. Klepeis, C. S. Yoo, J. Lang, D. Haskel and G. Srajer, Appl. Phys. Lett., 2007, 90, 042505 CrossRef.
  75. D. Hobbs, J. Hafner and D. Spošák, Phys. Rev. B: Condens. Matter Mater. Phys., 2003, 68, 014407 CrossRef.
  76. B. Predel, Co–N (Cobalt–Nitrogen), ed. O. Madelung, SpringerMaterials – The Landolt-Börnstein Database, http://www.springermaterials.com,  DOI:10.1007/10086082_928.
  77. E. Fawcett, Rev. Mod. Phys., 1988, 60, 209 CrossRef CAS.
  78. G. Wright and J. Goddard, Philos. Mag., 1965, 11, 485 CrossRef.
  79. P. Wicksted, G. Shirane and O. Steinsvoll, J. Appl. Phys., 1984, 55, 1893 CrossRef.
  80. G. A. Prinz, Phys. Rev. Lett., 1985, 54, 1051 CrossRef CAS PubMed.
  81. S. Yoo, H. Cynn, P. Söderlind and V. Iota, Phys. Rev. Lett., 2000, 84, 4132 CrossRef PubMed.
  82. W. Lengauer, J. Solid State Chem., 1988, 76, 412 CrossRef CAS.
  83. Z. Gu, J. H. Edgar, J. Pomeroy, M. Kuball and D. W. Coffey, J. Mater. Sci.: Mater. Electron., 2004, 15, 555 CrossRef CAS.
  84. H. Okamoto, J. Phase Equilib., 1993, 14, 536 Search PubMed , N–Ti (nitrogen–titanium).
  85. H. Okamoto, J. Phase Equilib. Diffus., 2013, 34, 151 CrossRef CAS , N–Ti (nitrogen–titanium).
  86. S. Nagakura, T. Kusunoki, F. Kakimoto and Y. Hirotsu, J. Appl. Crystallogr., 1975, 8, 65 CrossRef.
  87. N. Christensen, Acta Crystallogr., Sect. C: Cryst. Struct. Commun., 1985, 41, 1009 CrossRef.
  88. W. Lengauer, Acta Metall. Mater., 1991, 39, 2985 CrossRef CAS.
  89. G. K. Tirumalasetty, M. A. van Huis, C. M. Fang, Q. Xu, F. C. Tichelaar, D. N. Hanlon, J. Sietsma and H. W. Zandbergen, Acta Mater., 2011, 59, 7406 CrossRef CAS.
  90. N. Carlson, J. F. Smith and R. H. Nafziger, Metall. Mater. Trans. A, 1986, 17, 1847 Search PubMed.
  91. H. Okamoto, J. Phase Equilib. Diffus., 1994, 15, 454 CrossRef , Comment on N–V (nitrogen–vanadium).
  92. M. Enomoto, J. Phase Equilib. Diffus., 1996, 17, 248 CrossRef , The N–Ti–V system (nitrogen–titanium–vanadium).
  93. N. Christensen and B. Lebech, Acta Crystallogr., Sect. B: Struct. Crystallogr. Cryst. Chem., 1979, 35, 2677 CrossRef.
  94. K. Frisk, CALPHAD: Comput. Coupling Phase Diagrams Thermochem., 1991, 15, 79 CrossRef CAS.
  95. V. G. Ivanchenko and T. V. Mel'nichenko, Metallofizika, 1991, 13, 23 CAS.
  96. M. Aoki, H. Yamane, M. Shimada and T. Kajiwara, J. Cryst. Growth, 2002, 246, 133 CrossRef CAS.
  97. N. A. Gokcen, Bull. Alloy Phase Diagrams, 1990, 11, 33 CrossRef CAS.
  98. W. J. Takei, R. R. Heikes and G. Shirane, Phys. Rev., 1962, 125, 1893 CrossRef CAS.
  99. M. Hillert, L. Höglund and J. Ågren, J. Appl. Phys., 2005, 98, 053511 CrossRef.
  100. N. Mryasov, V. A. Gubanov and A. I. Liechtenstein, Phys. Rev. B: Condens. Matter Mater. Phys., 1992, 45, 12330 CrossRef.
  101. K. Oda and H. Ino, J. Phys.: Condens. Matter, 1990, 2, 10147 CrossRef CAS.
  102. J. Kool, M. A. J. Somers and E. J. Mittemeijer, Metall. Mater. Trans. A, 1996, 27, 1061 Search PubMed.
  103. N. Terao, Mem. Sci. Rev. Metall., 1960, 57, 96 CAS.
  104. K. Ito, K. Harada, K. Toko, H. Akinaga and T. Suemasu, J. Cryst. Growth, 2011, 336, 40 CrossRef CAS.
  105. K. Oda, K. Kenichi and I. Takashi, J. Mater. Sci., 1987, 22, 2729 CrossRef CAS.
  106. V. Raghavan, J. Phase Equilib., 1993, 14, 623 CrossRef CAS , Co–Fe–N (Cobalt–Iron–Nitrogen).
  107. R. Juza and W. Sachsze, Z. Anorg. Chem., 1945, 253, 95 CrossRef CAS.
  108. H. A. Wriedt, Bull. Alloy Phase Diagrams, 1985, 6, 558 CrossRef CAS , The N–Ni (nitrogen–nickel) system.
  109. X. Y. Cui, A. Soon, A. E. Phillips, R. K. Zheng, Z. W. Liu, B. Delley, S. P. Ringer and C. Stampfl, J. Magn. Magn. Mater., 2012, 324, 3138 CrossRef CAS.
  110. U. Zachwiecha and H. Jacobs, J. Less-Common Met., 1990, 161, 175 CrossRef.
  111. H. A. Wriedt, Bull. Alloy Phase Diagrams, 1988, 9, 247 CrossRef , The N–Zn (nitrogen–zinc) system.
  112. M. Futsuhara, K. Yoshioka and O. Takai, Thin Solid Films, 1998, 322, 274 CrossRef CAS.
  113. C. Persson and A. Zunger, Phys. Rev. B: Condens. Matter Mater. Phys., 2003, 68, 073205 CrossRef.
  114. L. Pauling, J. Am. Chem. Soc., 1932, 54, 3570 CrossRef CAS.
  115. G. Frenking and N. Fröhlich, Chem. Rev., 2000, 100, 717 CrossRef CAS PubMed.
  116. L. Allred, J. Inorg. Nucl. Chem., 1961, 17, 215 CrossRef.
  117. L. C. Allen, J. Am. Chem. Soc., 1989, 111, 9003 CrossRef CAS.
  118. Y. Kakehashi and O. Hosohata, J. Phys., Colloq., 1988, 8, 73 Search PubMed.
  119. M. Shaughnessy, L. Damewood, C. Y. Fong, L. H. Yang and C. Felser, J. Appl. Phys., 2013, 113, 043709 CrossRef.
  120. I. Galanakis, P. H. Dederichs and N. Papanikolaou, Phys. Rev. B: Condens. Matter Mater. Phys., 2002, 66, 174429 CrossRef.
  121. E. C. Stoner, Proc. R. Soc. London, Ser. A, 1936, 154, 656 CrossRef CAS.
  122. E. C. Stoner, Proc. R. Soc. London, Ser. A, 1939, 169, 339 CrossRef CAS.
  123. H. Jahn and E. Teller, Proc. R. Soc. London, Ser. A, 1937, 161, 220 CrossRef CAS.
  124. M. E. Eberhart, K. H. Johnson, D. Adler, R. C. O'Handley and M. E. Mchenry, J. Non-Cryst. Solids, 1985, 75, 97 CrossRef CAS.

Footnote

Electronic supplementary information (ESI) available. See DOI: 10.1039/c3ra47385f

This journal is © The Royal Society of Chemistry 2014
Click here to see how this site uses Cookies. View our privacy policy here.