Time-dependent density functional study of UV-visible absorption spectra of small noble metal clusters (Cun, Agn, Aun, n = 2–9, 20)

Berkahem Anaka, Mustapha Bencharifa and Franck Rabilloud*b
aLaboratoire de Chimie des Matériaux, Université Constantine 1, Constantine, Algeria
bInstitut Lumière Matière, UMR5306 Université Lyon 1 - CNRS, Université de Lyon, 69622 Villeurbanne Cedex, France. E-mail: franck.rabilloud@univ-lyon1.fr

Received 3rd December 2013 , Accepted 20th January 2014

First published on 22nd January 2014


Abstract

The absorption UV-visible spectra of noble metal clusters Cun, Agn, Aun, n = 2–9 and 20 are investigated in the framework of the time-dependent density functional theory using the long-range corrected density functionals LC-M06L and CAM-B3LYP and high-quality Gaussian basis sets. Some calculations including the spin–orbit coupling are also presented. The contribution of the d electrons to the optical response was found to be lower than it was when a purely local exchange functional was used. Calculated spectra are compared with experimental ones for clusters embedded in a rare-gas matrix.

I. Introduction

The optical properties of metal nanoparticles is a topic of great fundamental and technological interest. In particular, group-11 element (Cu, Ag, Au) nanoparticles have been intensively studied due to their large potential applicability originating from their unique optical and electronic properties.1 The size-dependent evolution of the optical properties of noble metal clusters has been the subject of many theoretical and experimental studies for many years. At the nanometric size, the well known plasmonic excitation has been understood to be a collective response of valence electrons and can be predicted by classical or semiclassical approaches based on Maxwell's equations for electromagnetic waves interacting with spherical metallic particles characterized by a phenomenological dielectric function.2–5 In contrast, the optical absorption of small clusters, containing only a few atoms, is molecular-like in the UV-visible range, and can not be described by classical models. A fully quantum treatment for all electrons is required.

Due to their isoelectronic shells (…3d104s1 for copper, …4d105s1 for silver, …5d106s1 for gold), the complexity of copper, silver and gold clusters lies between that of alkali metals and transition metals. The presence of d-type electrons strongly affects the physical and chemical properties of clusters. However, several remarkable differences can be found when comparing the three coinage metals. While silver is the most alkali-like transition metal thanks to a relatively large s–d separation, both copper and gold present high s–d hybridization effects. Moreover in the case of gold, relativistic effects and aurophilic interactions6,7 (closed shell d10–d10 interactions) lead to the persistence of planar structures up to at least ten atoms. At the atomic level, the energetic position of the nd-levels is approximately 4 eV below the (n + 1)s levels in silver, but only about 2 eV in copper and gold. In bulk, the s levels are extended to a large band while the atomic d-states develop in a much more localized d-band. The frontier orbital of the d-band is approximately 4 eV below the Fermi energy for silver, but only ∼2 eV for copper and gold.8 Consequently, silver presents a strong plasmon absorption in the UV-vis domain, visible down to small cluster sizes, followed by interband transitions at higher energies, and in contrast copper and gold have a more complicated absorption because their plasmon band is strongly perturbated by s–d hybridization effects, leading to a scattering of the oscillator strengths over a large energy range. While the optical properties of silver clusters are successfully predicted either by quantum theories for small sizes9 or by semi-classical approaches at the nanometric size in terms of plasmon excitations, a good description for copper and gold clusters is still challenging due to the active participation of d-electrons in the electronic transitions, and also the spin–orbit coupling in gold clusters, which lead to a high spectral density and an attenuation of oscillator strengths, i.e. a broadening and damping of the optical response.

Experimentally, the optical spectra of small silver cationic Ag+n (n = 9, 11, 15, 21) clusters were first obtained by photofragmentation of mass-selected cluster beams.10,11 Meantime, the first optical absorption measurements of small silver neutral Agn (n = 2–39) clusters embedded in a rare-gas matrix were performed.12,13 Afterwards, Félix et al. measured the optical spectra for even-sized clusters.14 More recently, Harbich et al. have published a new series of absorption measurements on small silver Agn (n = 2–9) clusters deposited at 6 K in solid neon.15 The latter, which show much better resolution and structures not present in previous measurements, were suggested by the authors to be taken as the benchmark for calculations on neutral silver clusters. For very small Agn clusters (n ≤ 8), the absorption spectra are characterized by a strong response in the 3–5 eV range with several narrow or broad peaks, while for n ≥ 12 they are characterized by the emergence of a dominant and relatively broad peak between 3 and 4 eV, somewhat similar to the well known surface plasmon resonance observed at the nanometric size. Theoretically, the observed spectra for silver clusters were first interpreted using classical electrodynamics by solving Maxwell's equations for electromagnetic waves interacting with small spherical metallic particles (Mie theory), or ellipsoidal particles (Mie–Gans theory), characterized by the dielectric function of the bulk.13,16 In these classical or semiclassical theories, the plasmon resonance reflects a collective excitation of the s valence electrons, while the effects of the d-electrons were only accounted for by using the bulk dielectric function. More recently, a few studies9,14–21 have been performed within a fully quantum treatment for all electrons in the framework of the time-dependent density functional theory22–24 (TDDFT) on silver clusters of some tens of atoms.

The strong d–s hybridization and relativistic effects of gold lead to very rich absorption spectra in the UV-visible domain. A variety of techniques such as inert gas complex beam depletion spectroscopy,25–27 photoelectron spectroscopy,28 and more recently photodissociation spectroscopy29,30 and noble-gas matrix spectroscopy,8 have been used to measure the optical response of small neutral or charged gold clusters. Describing the optical absorption of gold clusters is difficult because of relativistic effects, including the spin–orbit contribution,31 and the strong influence of d-electrons. Contrary to silver atoms, where the relatively large s–d separation makes the optical response mainly associated with s-electrons, the small s–d separation in Au atoms leads to the active participation of d-electrons in the electronic transitions, attenuating oscillator strengths. A few previous works have been performed in the framework of TDDFT using several levels of approximations: the local density approximation32,33 (LDA), the GGA-type (generalized gradient approximations) density functional,34 the hybrid functionals B3LYP,15,26,27,29 the LB94 density functional,35 and more recently some long-range corrected functionals.36 Calculations with the wave function excited-states method equation-of-motion coupled cluster singles and doubles (EOM-CCSD) have also been performed for Au4 and Au8.36 However, none of these calculations are in satisfactory agreement with the experimental spectra of neutral clusters. Both the position of the peaks and the intensity of the transitions are found to be described inadequately.

To our knowledge, very few studies have been published on the absorption spectra of copper clusters. Recently, Harbich37 measured the optical absorption of small Cun (n = 1–9) clusters in a neon matrix at 7 K. Theoretically, TDDFT calculations using LDA38 or GGA39 or B3LYP37 density functionals do not reproduce the experimental data very well. Calculations are somewhat difficult due to s–d hybridization effects and interband transitions.

We present here new TDDFT calculations of absorption spectra of isolated Agn, Aun, Cun with n = 2–9, 20. Calculations have been performed in the adiabatic linear-response formulation using several long-range corrected (LC) density functionals with a high-quality Gaussian basis set. Contrary to standard GGA-type density functionals which suffer from the self-interaction error (SIE) resulting in an incorrect asymptotic behavior of the exchange–correlation potential, the LC density functionals restore the correct asymptote by introducing a range separation into the exchange component by splitting the Coulomb operator into short-range and long-range parts. While the short-range part is still evaluated with the exchange potential from DFT, the long-range term is evaluated with the Hartree–Fock exchange to eliminate or decrease the long-range SIE.40,41 Recently the use of such functionals has been shown to give significant improvements concerning the prediction of absorption spectra of metal clusters.9,36 In particular, the analysis has shown that the d → sp interband transitions present a long-range charge-transfer character with a relatively low overlap between occupied and virtual orbitals and a significant blue shift induced by the Hartree–Fock exchange. These interband transitions are properly described only with a correct asymptotic potential.9

We will present new analyses based on TDDFT with LC density functionals that will allows us to characterize the transitions for the group-11 element (Cu, Ag, Au) clusters and compare the role of the d electrons in the three metals. We also present TDDFT calculations including spin–orbit coupling. To the best of our knowledge, the present calculations are the first ones concerning noble metal clusters which take into account the spin–orbit coupling at such a high level of theory. Our results will be compared with experiments when available. One should note that the nanoparticles are typically stabilized by organic ligands,1 which are not included in this study, and which may affect the optical properties. Our simulated spectra will be compared to experimental spectra measured for clusters embedded in a rare-gas matrix.

II. Computational details

Both silver and gold atoms were described through a relativistic effective core potential (RECP) so that only 19 valence electrons were treated explicitly.42 The quadruple-zeta quality with polarization def2-QZVP basis sets was used for all atoms,43 it was (24s18p10d3f1g)/[11s6p5d3f1g] for Cu, (10s8p7d3f1g)/[7s5p4d3f1g] for Ag and (9s8p6d3f1g)/[7s5p4d3f1g] for Au. However, in the cases of Cu20, Ag20 and Au20, a smaller basis set (hereafter called SDD) by Andrae et al.42 was used in order to reduce the computational time. Two exchange and correlation density functionals were used: LC-M06L and CAM-B3LYP. LC-M06L is obtained by applying a long-range correction41 to the meta-GGA M06L44 functional (“meta” denotes the inclusion of kinetic energy density, which depends on local derivatives of the spin orbitals). LC-M06L contains 0% Hartree–Fock exchange at short range and 100% at long range. The range separation parameter was 0.47. CAM-B3LYP45 is a long-range corrected hybrid density functional which combines the hybrid B3LYP46,47 functional at short range with an increasing amount of exact Hartree–Fock at long range. It comprises 19% Hartree–Fock at short range and 65% at long range. Calculations were performed with the Gaussian09 suite of programs.48 Pre- and post-processing operations were performed by using the graphical interface Gabedit.49 For small clusters (n = 2–9) the structures were taken from previous works.14,50–52 When several isomers were found to compete for the ground-state, the absorption spectrum was calculated for all of them. The structure of Ag20 was the lowest-energy isomer found in our previous work14 at the DFT/BP86 level, that of Cu20 was the lowest-energy isomer obtained in a global optimization.51 Finally, the well known Td symmetry structure was considered for Au20. In all the cases, the clusters were locally optimized with each functional before doing the present calculation of optical properties.

We have also performed some calculations taking into account the spin–orbit coupling. They were performed using the program ADF53 in the framework of the zeroth order regular approximation (ZORA) to the Dirac equation.54,55 Unfortunately, the spin–orbit coupling operator can not be applied with the full kernel of a hybrid functional in the current version of ADF. Accordingly, we have calculated the spin–orbit coupling within the statistical averaging of the model orbital potential (SAOP).56 The potential SAOP which displays the correct asymptotic behavior has been specifically designed for calculating optical properties. It has yielded very good results for response properties on gold dimer.31 In our calculations, the spin–orbit coupling was explicitly included into the SCF process for small clusters, but for Au20 in order to reduce the computational cost we first performed scalar relativistic TDDFT calculations to determine the lowest singlet–singlet and singlet–triplet excited states and then the spin–orbit coupling operator was applied to these single-group excited states to obtain the excitation energies.

All the spectra presented in the figures below give the oscillator strength as a function of the excitation energy, together with a curve obtained by a Gaussian broadening with a full width of half-height of 0.08 eV.

III. Results

A. Absorption spectra of silver Agn (n = 2–9) clusters

Absorption spectra of silver clusters Agn, with n = 2–9, are shown in Fig. 1 together with the geometrical structures. Both LC-M06L and CAM-B3LYP spectra are in very good agreement with the experimental results for clusters embedded in a neon matrix at 6 K.15 The presented calculated spectra are somewhat similar to previous ones calculated using CAM-B3LYP with a lower-quality basis set.9,19 They are of better quality than previous BP86,14 PBE57 or B3LYP15 predictions. As expected, the spectra of open-shell clusters (odd-sized clusters) present many more transitions than those of closed-shell clusters (even-sized clusters), with the exception of Ag7 for which the number of transitions is low due to its D5h-symmetry structure. Similarly, the calculated spectra of Ag6 and Ag8 are found to present very few transitions due to their high symmetry. In the case of Ag3, the first transition at 2.5 eV is reproduced well by both functionals. But at a higher energy range, the CAM-B3LYP calculation seems to better reproduce the experimental results than the LC-M06L does thanks to two large transitions at 3.42 and 3.65 eV. However no transition is found near 4 eV at the CAM-B3LYP level whereas the two transitions at 3.89 and 4.02 eV from the LCM06L spectrum fit well with the experimental results. For Ag4, CAM-B3LYP gives five main peaks at 3.00, 4.01, 4.42, 5,42 and 5.68 eV, while LC-M06L presents strong transitions at 3.05, 4.00, 4.26, 4.76 and 5.71 eV. In the experiment, while two main strong transitions at 3.07 and 4.23 eV can be easily extracted from the spectrum reported in Fig. 1, other peaks are identified in the original work.15 For Ag5, the two main transitions calculated at 3.24 and 3.63 eV with CAM-B3LYP and at 3.30 and 3.74 eV with LC-M06L compare well with the experimental peaks located at 3.27 and 3.69 eV. Both functionals give a strong transition near 5 eV (4.91 eV with CAM-B3LYP and 4.95 eV with LC-M06L) which could correspond to the experimental transition observed at 5.36 eV. The experimental spectrum of Ag6 shows a main peak at 3.45 eV with a second less intense one at 3.65 eV. The former is well reproduced by CAM-B3LYP (3.43 eV) and is slightly overestimated by LC-M06L (3.61 eV). But the small peak is shifted on the low-energy side of the main transition at 2.91 eV and 3.09 eV for CAM-B3LYP and LC-M06L respectively. For Ag7, spectra calculated with the D5h-symmetry structure are in good agreement with the experiment since, both the main and secondary peaks are well reproduced. Indeed, the main peak calculated at 3.61 and 3.71 eV with CAM-B3LYP and LC-M06L, respectively, is in agreement with the experimental peak at 3.64 eV. In addition, the less-intense transitions measured at 2.78 eV and 4.63 eV seem to correspond to the calculated transitions calculated at 2.65 and 4.33 eV at the CAM-B3LYP level, and at 2.91 and 4.44 eV at the LC-M06L level. For Ag8, two structures of symmetry Td and D2d compete for the lowest-energy isomer. In the present study, the D2d structure is found to be the lowest-energy isomer at the LC-M06L level since it lies 0.03 eV below the Td structure. In contrast, using CAM-B3LYP the Td isomer is found to lie 0.17 eV below the D2d structure. The experimental spectrum presents two small narrow peaks at 3.12 and 3.20 eV and two intense transitions at 3.65 and 4.00 eV. Three transitions (at 3.12, 3.20 and 4.00 eV) could correspond to transitions calculated for the Td isomer at the LC-M06L level (3.02, 3.36 and 4.03 eV) or at the CAM-B3LYP level (3.18 and 3.97 eV). The two experimental peaks at 3.65 and 4.00 eV are well reproduced by transitions calculated for the D2d isomer at 3.74 and 4.03 eV (LC-M06L) and 3.65 and 3.97 eV (CAM-B3LYP). As previously suggested,14 both isomers could be present in the experiment, the experimental spectrum being then a sum of the spectra for both isomers. In this context, the energy gap of 0.03 eV calculated at the LC-M06L level may appear to be more appropriate than the value of 0.17 eV obtained with CAM-B3LYP which seems to be too large. For Ag9, the experimental spectrum in a neon matrix shows two main bands at 3.84 and 4.14 eV. It differs from that measured previously in an argon matrix where a broader structure composed of several narrow peaks between 3.3 and 4.25 eV were found.14 In the present work, we have only considered the Cs-symmetry structure shown in Fig. 1, as it was found to be the lowest energy-isomer in several previous works.14,15 The calculated absorption spectra are not in perfect agreement with the experimental one. However the analysis of several previous calculations14,58 indicate that different structures have minimum energies in an energy range as close as 0.05 eV, and so the observed spectrum could be the sum of contributions from several isomers present inside the matrix as already examined in a previous study.59
image file: c3ra47244b-f1.tif
Fig. 1 Calculated absorption spectra of silver clusters Agn, with n = 2–9, compared to experimental spectra measured for clusters embedded in a neon matrix. Plots of the experimental spectra (third row for each cluster size) were generated using digitizing software on the original spectra.15

B. Absorption spectra of copper Cun (n = 2–9) clusters

Recently, the optical absorption of small Cun clusters embedded in a neon matrix at 7 K have been measured.37 Afterwards, TDDFT calculations using LDA38 and B3LYP37 density functionals were found not to be able to reproduce the experimental data well. The present work, with the use of long-range density functionals and an extended basis set, represents a significant improvement over previous theoretical studies since the d → sp interband transitions which may present a significant long-range charge-transfer character9 will be better described. Calculated absorption spectra are given in Fig. 2 together with the experimental ones (see also ESI for the spectrum of a second isomer of Cu3). Our results are in better agreement with the experiment than those obtained at TDLDA and TDDFT/B3LYP levels, especially for n = 2,3 and 8. As expected, the number of transitions is strongly reduced when the long-range correction is added. For example the number of states below 5 eV is divided by a factor of 2 when using CAM-B3LYP instead of the B3LYP density functional. However our absorption spectra can not clearly account for the measured spectra since the detailed structures are only partially reproduced.
image file: c3ra47244b-f2.tif
Fig. 2 Calculated absorption spectra of copper clusters Cun, with n = 2–8, compared to experimental spectra measured for clusters embedded in a neon matrix. Plot of the experimental spectra (third row for each cluster size) were generated using digitizing software on the original spectra.37

For the dimer, the measured peaks at 2.80, 4.68, 5.08, 5.41 eV could correspond to the calculated transitions at 2.89, 4.45, 5.19, 5.42 eV with CAM-B3LYP and 2.94, 4.56, 5.41, 5.76 eV with LC-M06L level. For the trimer, a qualitative agreement can be found at least at low energy where calculations furnish strong transitions close to 2.5 eV and 3.5 eV. For Cu4, the spectrum calculated at the LC-M06L level is slightly blue-shifted in comparison with that obtained with the CAM-B3LYP level. But both calculated spectra give a main transition at about 3 eV and a second one in the 4.5–5 eV range, while none of them reproduce the experimental peaks in the 3.5–4 eV range. For Cu5, the two calculated spectra are very similar, they show one main transition centered at 3.22 and 3.37 eV with CAM-B3LYP and LC-M06L respectively. For Cu6, Cu7, Cu8, the calculated spectrum with CAM-B3LYP is somewhat similar to that obtained at the LC-M06L level. The agreement with the experiment is not good for Cu6 and Cu7, but it is better for Cu8.

C. Absorption spectra of gold Aun (n = 2–9) clusters

A lot of studies have been carried out on the optical properties of small gold clusters. Among them, several studies in the framework of TDDFT have been published.8,32,33,36 But the recent work by Chalasinski et al.36 on even-sized clusters is the only one to consider long-range corrected density functionals, while the previous works used LDA or B3LYP density functionals. Fig. 3 shows our calculated absorption spectra together with the experimental ones measured for clusters embedded in a neon matrix at 7 K (see also ESI for spectra of higher-energy isomers). Planar structures are also given in the figure. In the experiment, absorption spectra are characterized by a very rich response and by a high density of transitions in the entire 2–6 eV range. Calculated spectra also present a high density of states, especially for open-shell systems (n = 3, 5, 7, 9). For the dimer, the two calculated spectra are similar with two transitions at 2.97 and 5.53 eV with CAM-B3LYP compared to 3.13 and 5.57 eV with LC-M06L. Significant differences can be found in the spectra calculated for the trimer and tetramer. For the trimer, the first strong transition is calculated at 2.54 eV with CAM-B3LYP and 3.36 eV with LC-M06L. For Au4, two main transitions are found around 3 eV (at 3.03 and 3.21 eV) with CAM-B3LYP, while only one exists with LC-M06L (at 3.26 eV) but with a much stronger oscillator strength. For Au5, Au6, Au7 and Au8, the spectra calculated with both functionals are somewhat similar, while several transitions calculated at the LC-M06L level are slightly blue-shifted when compared to those obtained at the CAM-B3LYP level. For Au9, many transitions give rise to a continuum spectrum starting from 2.5 eV.
image file: c3ra47244b-f3.tif
Fig. 3 Calculated absorption spectra of gold clusters Aun, with n = 2–9, compared to experimental spectra measured for clusters embedded in a neon matrix. Plots of the experimental spectra (third row for each cluster size) were generated using digitizing software on the original spectra.8

To compare the calculated and experimental spectra is not so easy because the high density of transitions leads the shape of the calculated spectrum to be strongly dependent on arbitrary Gaussian broadening. However, the measured spectra show many transitions in the 2–6 eV range, generally starting from 2 eV. Unfortunately the first allowed transitions in calculated spectra appear at higher energy. Clearly, the calculated absorption spectra do not reproduce the experimental spectra below 3 eV. However, calculations show symmetry forbidden transitions in the 2–3 eV range that could possibly explain the measured peaks, if they can be observed when the cluster is embedded due to the interaction with the rare-gas atoms.

D. Absorption spectra of Ag20, Cu20 and Au20

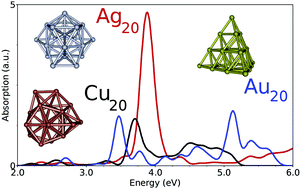
Fig. 4 gives the calculated absorption spectra of clusters of size n = 20. For the three metals, the spectrum is characterized by a strong plasmon-like band in the 3.5–4 eV range. For silver, the band is centered at 3.88 and 4.09 eV at CAM-B3LYP and LC-M06L levels respectively, then no transition is found up to 6 eV. For copper, the plasmon band is calculated at 3.70 eV and 4.00 eV with CAM-B3LYP and LC-M06L respectively, followed by a large band starting at 4.5 or 5.0 eV depending on the functional used. Some low transitions are also visible before the plasmon band. The oscillator strength associated with the plasmon-like band is much less intense than for silver. Finally, for Au20 the plasmon-like band is associated with a unique transition due to the high symmetry of the structure (Td), it is located at 3.47 eV at the CAM-B3LYP level and at 3.80 eV at the LC-M06L level. Moreover, two weak peaks at low energies are also found respectively at 2.70 and 3.16 eV with CAM-B3LYP, and at 2.97 and 3.50 eV with LC-M06L. Our results are in good agreement with the recent work by Koppen and et al.60 in which several families of density functionals were tested on Au20 clusters. In particular, the global hybrid ωB97x density functional was found to give a strong transition at 3.57 eV and two less-intense peaks at 2.93 and 3.37 eV. In contrast, LDA and GGA predictions produce peaks at much lower energies.32,33,61 LDA calculation33 predicts a weak transition at 1.85 eV and a strong one at 2.78 eV, while BP86 calculation61 finds some transitions at 1.90 and 2.89 eV.
image file: c3ra47244b-f4.tif
Fig. 4 Calculated absorption spectra of Cu20, Ag20 and Au20.

E. Spin–orbit coupling

In all the above TDDFT calculations, the relativistic corrections for gold and silver were accounted for at a scalar level through the use of an RECP. This was essential, especially in the case of gold for which the relativistic effects lead to a quenching of the oscillator strength due to enhanced screening of the s electrons by the d electrons and the strong s–d hybridization in the low energy transitions. However, the above calculations neglect the effects of spin–orbit (SO) coupling. While the latter is expected not to be prominent in copper and silver, it may play a significant role in gold. Recently, Geethalakshmi et al.31 have presented an new interpretation of the absorption and emission spectra of the gold dimer showing the significant role of the spin–orbit coupling. They used both an ab initio multiconfigurational Hamiltonian (like a CASSCF/CASPT2 scheme: complete active space self-consistent field followed by second order perturbation theory) and a TDDFT framework to generate a space of excited states on which the spin–orbit coupling operator was applied. Their benchmarking of the different methods has shown that the SAOP functional in the case of TDDFT gives good excitation energies and has approximatively the same accuracy as the ab initio methods. Following their work on the gold dimer, we have performed additional calculations in order to investigate the SO coupling in noble metal clusters using TDDFT with the SAOP potential. Fig. 5 gives the calculated spectra for closed-shell gold clusters. We have included both spectra obtained at the SAOP level without SO coupling and spectra after applying the SO coupling operator. Applying the SO coupling operator leads to several changes in the spectra of small clusters including shifts of some main peaks and especially a dispersion of the oscillator strengths resulting in a broadening and damping of the optical response. However, the inclusion of SO coupling does not explain the strong transitions measured at low energies in the experiment8 (for example transitions at 2.23, 2.66, 2.91, 2.97 eV for Au8, see Fig. 3). Interestingly, the SO coupling effects on the spectrum of Au20 are small, since only a small broadening coupled to a small damping is visible but without any changes in the shape of the spectrum. Hence the SO coupling effects appear to be less important for large systems than for small ones.
image file: c3ra47244b-f5.tif
Fig. 5 Calculated absorption spectra of Aun clusters with n = 4, 6, 8, 20 using the SAOP method without and with the spin–orbit (SO) coupling. Structures of clusters are shown in Fig. 3 and 4. Other spectra for silver and copper clusters are available in the ESI.

In the ESI, we present spectra of silver and copper clusters calculated with the SAOP potential and SO coupling. As expected, no significant effect of SO coupling can be observed.

IV. Discussion

A. Orbital character of the optical excitations

In order to quantify the respective contributions of s and d electrons to the optical response, we have calculated the percentage of the d character in the transition thanks to the formula proposed by Baishya:16
 
image file: c3ra47244b-t1.tif(1)
where the sum in n includes all the excitations up to a cutoff energy Ec. For one transition labelled n with an energy Ωn and an oscillator strength fn, the double index vc labels the entries of the corresponding TDDFT eigenvector Fn, which is composed of occupied–unoccupied (or “valence–conduction”) Kohn–Sham orbital pairs. Of course image file: c3ra47244b-t2.tif for each transition n. 〈d|ϕv〉 is the d projection of the occupied orbital ϕv. We show in Fig. 6 the degree of the integrated d character of the excitations as a function of the cutoff energy Ec. The graphs reported in Fig. 6 were calculated at the CAM-B3LYP level, similar results were obtained with LC-M06L. The d character in silver is found to be low, about 10% up to Ec = 5 eV and about 20% when Ec = 6 eV. The transitions are mainly associated with excitations from s-type orbitals. The excitations from d-type orbitals are effective at higher energies. This contrasts with previous TDLDA studies which predicted a much more important contributions of the d electrons to the excitations (50–70% depending on the cluster size16). Recently, the purely local functionals were shown to overestimate the role of d electrons in the plasmon-like band of silver Ag20 clusters,9 the present results show that they also overestimate the role of the d electrons in the optical response of very small clusters. In the case of Ag20 our analysis shows that the contribution of the d electrons rises above 5 eV.

image file: c3ra47244b-f6.tif
Fig. 6 The percentage of the d character in the optical transitions for Cun (solid lines), Agn (dashed lines) and Aun (dotted lines) clusters (n = 4, 6, 8, 20) evaluated with the eqn (1). The figure on the top gives the d character of the excited states for n = 20, it differs from that given just below since it includes both black and white excited states, while the other curves are calculated taking only the white states (oscillator strength fn ≠ 0) into consideration.

As expected, the d character in the excitations is much larger for copper and gold than it is for silver. The d character rises with the cutoff energy for all copper and gold clusters from about 20% at 3 eV to 60% at 6 eV. The behavior for tetramers somewhat differs since it increases from 50% at 3 eV to about 70% at 6 eV. The important role of the d electrons in the optical properties of copper and gold clusters is already known and has been explained by considering the relative proximity of the d- and s-levels and the strong s–d hybridization. In TDLDA calculations, the percentage of d character was found to be at about 80% and 70% for copper and gold clusters respectively with a cutoff energy of 6 eV.38 In particular, the d character was large even at low energies (∼2 eV). For example, the d character was found to be about 50% for Ec = 2 eV in the case of Cu10. Again, the use of the Hartree–Fock exchange at a long-range reduces the role of the d electrons in the excitations at low energies.

In the top of Fig. 6, we also give for n = 20 the evolution of the d character of the integrated excited states as a function of the cutoff energy. It differs from eqn (1) since it includes both white and black states while eqn (1) only considers the white states (oscillator strength fn ≠ 0). The curves show that the d band opens at about 5.1 ev for Ag20 and at 3.85 eV for Cu20 and only at 3.75 eV for Au20.

B. Limitations in the experiment – theory comparison

Several hypotheses can be emitted to explain the relative disagreement between the experimental and theoretical spectra for copper and gold clusters. We would like to briefly discuss the following two points: the effects of the matrix which are not taken into account in the calculation, and the limitations of TDDFT in the adiabatic linear-response formulation.

First, TDDFT calculations are performed in the gas phase whereas measurements are made on clusters embedded in a rare-gas matrix. Although condensed rare-gases are the most inert solids, some effects on spectra may be expected. For example, it has been shown on both potassium and silver clusters that dielectric screening for the electron–electron interaction involves a redshift of the plasmon frequency as the dielectric constant of the matrix increases.62 Based on the classical Mie approach, Fedrigo et al.13 have estimated that the plasmon-like band in silver clusters was likely to be red-shifted by 0.24 eV when the clusters are embedded in an argon matrix with respect to the gas phase. In the same way, they calculated a red-shift of 0.32 and 0.42 eV in krypton and xenon matrices. More recently, the matrix effects of a rare-gas matrix on the spectra of small silver clusters (Agn, n = 2, 4, 6, 8, 20), were estimated using an electrostatic model of solvation (the well known conductor-like screening model of solvation (COSMO) model) in TDDFT/GGA calculations.63 An average red-shift of 0.17, 0.30, and 0.33 eV of the main peaks in argon, krypton, and xenon matrices respectively were obtained. However, the previous model neglects all the nonelectrostatic effects which are likely to be important for rare gases.

The matrix effects do not only cause a shift of the main peaks. Clusters with differing local environments, known as site isomers, may coexist. Using quantum calculations on sodium clusters embedded in an argon matrix, Gervais et al.64,65 showed the possible coexistence of several site isomers and rationalized the matrix effects in two competing effects: the dielectric effect leading to a red-shift and a confinement of the valence electrons of the clusters due to the presence of the rare-gas atoms leading to a blue-shift. Other possible effects concern the eventual deformation of clusters during the deposition in a matrix, though the deposition energy is low. Finally, some symmetry forbidden transitions may be observed when the cluster is embedded due to interaction with the rare-gas atoms. To reduce the matrix effects both the growth of the matrix and measurements of optical spectra are made at low temperature (6 or 7 K). In the case of silver, there is good agreement between the theoretical and experimental spectra thus it can be concluded that the matrix effects are small. In contrast, in the case of copper, the failure of the calculations to reproduce the experimental results obtained in the matrix leads to the conclusion that there are some significant matrix effects. However, the structure of the clusters is not necessarily a causal factor here for the deformation since both copper and silver clusters have the same structures. The interaction with the neighboring rare atoms may cause significant perturbation in the optical properties of copper clusters.

In the case of gold, the transitions measured at low energies (below 3 eV) are not observed in our TDDFT calculations in the gas phase, even when a spin–orbit coupling operator is applied. The planar structures are expected to be more sensitive to the environment for the three-dimensional ones. And transitions measured at low energies may be due to some matrix effects which could either slightly distort the cluster or just break down the symmetry and then make some of the black states visible in the matrix. Further calculations including both the spin–orbit coupling and matrix effects are in progress in our group.

We should also mention that the current TDDFT calculations in the adiabatic linear-response formulation are not able to correctly describe states with substantial multi-excitation character.66 That may be a severe limitation for describing some excited states of copper and gold systems. However, Geethalakshmi et al.31 have shown that TDDFT/SAOP and CASPT2 methods give somewhat similar excitation energies in the case of Au2. Further calculations based on multi-configuration theories would help to confirm the present predictions.

V. Conclusions

In this work we performed TDDFT calculations of the optical spectra of group-11 element clusters Cun, Agn, Aun, with n = 2–9 and 20, using the long-range corrected density functionals LC-M06L and CAM-B3LYP with high-quality Gaussian basis sets. LC-M06L and CAM-B3LYP spectra are found to be somewhat similar but several main peaks calculated at the LC-M06L level are found to be slightly blue-shifted in comparison with their corresponding CAM-B3LYP position. This blue-shift is connected to the value of the range separation parameter (0.47 in the present work). Very recently, a value of 0.33 was found to give slightly better results for silver clusters.9

The three noble metals present a strong optical response in the UV-visible range, but some significant differences were found in the spectra when comparing the three metals. For silver a few strong peaks which are well separated are present in the spectra, while the spectra of copper and gold have a high density of peaks resulting in the broadening and damping of the optical response. For the size n = 20, the plasmon-like band is calculated in the 3.5–4 eV range for the three metals. However, while no transition is found around it in the case of Ag20, a few transitions are found below the plasmon and a large band is found beyond ∼4.5–5.0 for both Cu20 and Au20. The contribution of the d electrons to the optical response was found to be much lower than it is at LDA or GGA levels. Applying the spin–orbit coupling leads to no significant effects in the spectrum of Au20, but leads to several changes in the spectra of small gold clusters like shifts of several main peaks and especially a dispersion of the oscillator strengths resulting in the broadening and damping of the optical response. As expected, no significant effects of the spin–orbit coupling could be observed for silver and copper clusters.

Our calculated spectra were compared to recent experimental ones measured for clusters embedded in a neon matrix at a very low temperature (at 6 or 7 K). For Agn, our calculated spectra reproduce well with the experimental ones. For copper, the comparison is not so good since the detailed structure of the spectra are only partially reproduced. For gold clusters, the measured transitions at low energies (below about 3 eV) are not found in our calculations, even when the spin–orbit coupling is included. We have discussed the possible effects of the matrix which could cause the occurrence of new peaks not visible in the gas phase.

Acknowledgements

The authors thank Mingli Yang for providing the initial coordinates of the copper clusters. This work was granted access to the HPC resources of IDRIS under the allocation 2013-i2013086864 made by GENCI, and to the HPC resources of PSMN (Pôle Scientifique de Modélisation Numérique).

References

  1. M. C. Daniel and D. Astruc, Chem. Rev., 2004, 104, 293 CrossRef CAS PubMed.
  2. V. V. Kresin, Phys. Rev. B: Condens. Matter, 1995, 51, 1844 CrossRef CAS.
  3. L. Serra and A. rubio, Phys. Rev. Lett., 1997, 78, 1428 CrossRef CAS.
  4. J. Lermé, Eur. Phys. J. D, 2000, 10, 265 CrossRef.
  5. M. Gaudry, J. Lermé, E. Cottancin, M. Pellarin, J. L. Vialle, M. Broyer, B. Prével, M. Treilleux and P. Mélinon, Phys. Rev. B: Condens. Matter, 2001, 64 CrossRef CAS.
  6. P. Pyykko, Chem. Rev., 1997, 97, 597 CrossRef PubMed.
  7. F. Rabilloud, J. Comput. Chem., 2012, 33, 2083–2091 CrossRef CAS PubMed.
  8. S. Lecoultre, A. Rydlo, C. Félix, J. Buttet, S. Gilb and W. Harbich, J. Chem. Phys., 2011, 134, 074302 CrossRef CAS PubMed.
  9. F. Rabilloud, J. Phys. Chem. A, 2013, 117, 4267–4278 CrossRef CAS PubMed.
  10. J. Tiggesbaumker, L. Koller, H. O. Lutz and K. H. Meiwes-Broer, Chem. Phys. Lett., 1992, 190, 42 CrossRef.
  11. J. Tiggesbaumker, L. Koller, K. H. Meiwes Broer and A. Liebsch, Phys. Rev. A: At., Mol., Opt. Phys., 1993, 48, R1749–R1752 CrossRef.
  12. W. Harbich, S. Fedrigo and J. Buttet, Chem. Phys. Lett., 1992, 195, 613–6 CrossRef CAS.
  13. S. Fedrigo, W. Harbich and J. Buttet, Phys. Rev. B: Condens. Matter, 1993, 47, 10706–10715 CrossRef CAS.
  14. M. Harb, F. Rabilloud, D. Simon, A. Rydlo, S. Lecoultre, F. Conus, V. Rodrigues and C. Félix, J. Chem. Phys., 2008, 129, 194108 CrossRef CAS PubMed.
  15. S. Lecoultre, A. Rydlo, J. Buttet, C. Félix, S. Gilb and W. Harbich, J. Chem. Phys., 2011, 134, 184504 CrossRef CAS PubMed.
  16. K. Baishya, J. C. Idrobo, S. Ogut, M. Yang, K. Jackson and J. Jullinek, Phys. Rev. B: Condens. Matter Mater. Phys., 2008, 78 CrossRef CAS.
  17. M. Tiago, J. Idrobo, S. Ogut, J. Jellinek and J. Chelikowsky, Phys. Rev. B: Condens. Matter Mater. Phys., 2009, 79 Search PubMed.
  18. M. Harb, F. Rabilloud and D. Simon, Chem. Phys. Lett., 2009, 476, 186–190 CrossRef CAS PubMed.
  19. D. W. Silverstein and L. Jensen, J. Chem. Phys., 2010, 132, 194302 CrossRef PubMed.
  20. H. C. Weissker and C. Mottet, Phys. Rev. B: Condens. Matter Mater. Phys., 2011, 84 CrossRef CAS.
  21. F. Rabilloud, Eur. Phys. J. D, 2013, 67, 18 CrossRef.
  22. M. E. Casida, in Recent Advances in Density Functional Methods. Part I, ed. D. P. Chong, World Scientific, Singapore, 1995, p. 155 Search PubMed.
  23. E. Runge and E. K. U. Gross, Phys. Rev. Lett., 1984, 52, 997–1000 CrossRef CAS.
  24. R. van Leeuwen, Int. J. Mod. Phys. B, 2001, 15, 1969–2023 CrossRef.
  25. B. A. Collings, K. Athanassenas, D. Lacombe, D. M. Rayner and P. A. Hackett, J. Chem. Phys., 1994, 101, 3506 CrossRef CAS PubMed.
  26. S. Gilb, K. Jacobsen, D. Schooss, F. Furche, R. Ahlrichs and M. M. Kappes, J. Chem. Phys., 2004, 121, 4619–4627 CrossRef CAS PubMed.
  27. A. N. Gloess, H. Schneider, J. M. Weber and M. M. Kappes, J. Chem. Phys., 2008, 128, 114312 CrossRef PubMed.
  28. H. Hakkinen, B. Yoon, U. Landman, X. Li, H. J. Zhai and L. S. Wang, J. Phys. Chem. A, 2003, 107, 6168–6175 CrossRef.
  29. S. M. Lang, P. Claes, N. T. Cuong, M. T. Nguyen, P. Lievens and E. Janssens, J. Chem. Phys., 2011, 135, 224305 CrossRef PubMed.
  30. A. Shayeghi, R. L. Johnston and R. Schafer, Phys. Chem. Chem. Phys., 2013, 15, 19715–19723 RSC.
  31. K. R. Geethalakshmi, F. Ruiperez, S. Knecht, J. M. Ugalde, M. D. Morse and I. Infante, Phys. Chem. Chem. Phys., 2012, 14, 8732–8741 RSC.
  32. A. Castro, M. A. Marques, A. H. Romero, M. J. Oliveira and A. Rubio, J. Chem. Phys., 2008, 129, 144110 CrossRef PubMed.
  33. J. C. Idrobo, W. Walkosz, S. F. Yip, S. Ogut, J. Wang and J. Jellinek, Phys. Rev. B: Condens. Matter Mater. Phys., 2007, 76 CrossRef CAS.
  34. X. Lopez-Lozano, C. Mottet and H. C. Weissker, J. Phys. Chem. C, 2013, 117, 3062–3068 CAS.
  35. N. Durante, A. Fortunelli, M. Broyer and M. Stener, J. Phys. Chem. C, 2011, 115, 6277–6282 CAS.
  36. J. V. Koppen, M. Hapka, M. M. Szczesniak and G. Chalasinski, J. Chem. Phys., 2012, 137, 114302 Search PubMed.
  37. S. Lecoultre, A. Rydlo, C. Félix, J. Buttet, S. Gilb and W. Harbich, J. Chem. Phys., 2011, 134, 074303 CrossRef CAS PubMed.
  38. K. Baisha, J. C. Idrobo, S. Ogut, M. Yang, K. Jackson and J. Jullinek, Phys. Rev. B: Condens. Matter Mater. Phys., 2011, 83 Search PubMed.
  39. T. Yasuike and K. Nobusada, Phys. Chem. Chem. Phys., 2013, 15, 5424–5429 RSC.
  40. T. Leininger, H. Stoll, H. J. Werner and A. Savin, Chem. Phys. Lett., 1997, 275, 151–160 CrossRef CAS.
  41. H. Iikura, T. Tsuneda, T. Yanai and K. Hirao, J. Chem. Phys., 2001, 115, 3540–3544 CrossRef CAS PubMed.
  42. D. Andrae, U. Haussermann, M. Dolg, H. Stoll and H. Preuss, Theor. Chim. Acta, 1990, 77, 123–141 CrossRef CAS.
  43. F. Weigend and R. Ahlrichs, Phys. Chem. Chem. Phys., 2005, 7, 3297–3305 RSC.
  44. Y. Zhao and D. G. Truhlar, J. Chem. Phys., 2006, 125, 194101 CrossRef PubMed.
  45. T. Yanai, D. P. Tew and N. C. Handy, Chem. Phys. Lett., 2004, 393, 51–57 CrossRef CAS PubMed.
  46. A. D. Becke, J. Chem. Phys., 1993, 98, 5648–5652 CrossRef CAS PubMed.
  47. P. J. Stephens, F. J. Devlin, C. F. Chabalowski and M. J. Frisch, J. Phys. Chem., 1994, 98, 11623–11627 CrossRef CAS.
  48. M. J. Frisch, G. W. Trucks, H. B. Schlegel, G. E. Scuseria, M. A. Robb, J. R. Cheeseman, G. Scalmani, V. Barone, B. Mennucci, G. A. Petersson, H. Nakatsuji, M. Caricato, X. Li, H. P. Hratchian, A. F. Izmaylov, J. Bloino, G. Zheng, J. L. Sonnenberg, M. Hada, M. Ehara, K. Toyota, R. Fukuda, J. Hasegawa, M. Ishida, T. Nakajima, Y. Honda, O. Kitao, H. Nakai, T. Vreven, J. A. Montgomery Jr, J. E. Peralta, F. Ogliaro, M. Bearpark, J. J. Heyd, E. Brothers, K. N. Kudin, V. N. Staroverov, R. Kobayashi, J. Normand, K. Raghavachari, A. Rendell, J. C. Burant, S. S. Iyengar, J. Tomasi, M. Cossi, N. Rega, J. M. Millam, M. Klene, J. E. Knox, J. B. Cross, V. Bakken, C. Adamo, J. Jaramillo, R. Gomperts, R. E. Stratmann, O. Yazyev, A. J. Austin, R. Cammi, C. Pomelli, J. W. Ochterski, R. L. Martin, K. Morokuma, V. G. Zakrzewski, G. A. Voth, P. Salvador, J. J. Dannenberg, S. Dapprich, A. D. Daniels, A. Farkas, J. B. Foresman, J. V. Ortiz, J. Cioslowski and D. J. Fox, Gaussian 09 Revision B.01, Gaussian Inc., Wallingford CT, 2010 Search PubMed.
  49. A. R. Allouche, J. Comput. Chem., 2011, 32, 174–182 CrossRef CAS PubMed.
  50. V. K. M. Itoh, T. Adschiri and Y. Kawazoe, J. Chem. Phys., 2009, 131, 174510 CrossRef PubMed.
  51. M. Jiang, Q. Zeng, T. Zhang, M. Yang and K. A. Jackson, J. Chem. Phys., 2012, 136, 104501 CrossRef PubMed.
  52. G. Zanti and D. Peeters, Theor. Chem. Acc., 2012, 132 Search PubMed.
  53. G. te Velde, F. Bickelhaupt, E. Baerends, C. F. Guerra, S. van Gisbergen, J. Snijders and T. Ziegler, J. Comput. Chem., 2001, 22, 931–967 CrossRef CAS.
  54. E. van Lenthe, E. J. Baerends and J. G. Sniders, J. Chem. Phys., 1994, 101, 9783 CrossRef CAS PubMed.
  55. E. van Lenthe, J. G. Sniders and E. J. Baerends, J. Chem. Phys., 1996, 105, 6505 CrossRef CAS PubMed.
  56. P. R. T. Schipper, O. V. Gritsenko, S. J. A. van Gisbergen and E. J. Baerends, J. Chem. Phys., 2000, 112, 1344 CrossRef CAS PubMed.
  57. M. Harb, F. Rabilloud and D. Simon, J. Chem. Phys., 2009, 131, 174302 CrossRef CAS PubMed.
  58. R. Fournier, J. Chem. Phys., 2001, 115, 2165–2177 CrossRef CAS PubMed.
  59. C. Sieber, J. Buttet, W. Harbich and C. Félix, Phys. Rev. A: At., Mol., Opt. Phys., 2004, 70 CrossRef CAS.
  60. J. V. Koppen, M. Hapka, M. M. Szczesniak and G. Chalasinski, J. Chem. Phys., 2012, 137, 114302 CrossRef PubMed.
  61. C. M. Aikens and G. C. Schatz, J. Phys. Chem. A, 2006, 110, 13317–13324 CrossRef CAS PubMed.
  62. A. Rubio and L. Serra, Phys. Rev. B: Condens. Matter, 1993, 48, 18222–18229 CrossRef CAS.
  63. L. Jensen, L. L. Zhao and G. C. Schatz, J. Phys. Chem. C, 2007, 111, 4756–4764 CAS.
  64. B. Gervais, E. Giglio, E. Jacquet, A. Ipatov, P.-G. Reinhard, F. Fehrer and E. Suraud, J. Chem. Phys., 2004, 121, 8466–8480 CrossRef CAS PubMed.
  65. B. Gervais, E. Giglio, E. Jacquet, A. Ipatov, P.-G. Reinhard, F. Fehrer and E. Suraud, Phys. Rev. A: At., Mol., Opt. Phys., 2005, 71 CrossRef CAS.
  66. M. E. Casida and M. Huix-Rotllant, Annu. Rev. Phys. Chem., 2012, 63, 287–323 CrossRef CAS PubMed.

Footnote

Electronic supplementary information (ESI) available. See DOI: 10.1039/c3ra47244b

This journal is © The Royal Society of Chemistry 2014
Click here to see how this site uses Cookies. View our privacy policy here.