A facile low temperature (350 °C) synthesis of Cu2O nanoparticles and their electrocatalytic and photocatalytic properties

Bharat Kumara, Soumen Sahaa, Aparna Gangulya and Ashok K. Ganguli*ab
aDepartment of Chemistry, Indian Institute of Technology, Hauz Khas, New Delhi 110016, India. E-mail: ashok@chemistry.iitd.ernet.in; Fax: +91-11-26854715; Tel: +91-11-26591511
bInstitute of Nano Science and Technology, Mohali, Punjab 160062, India

Received 25th November 2013 , Accepted 17th February 2014

First published on 18th February 2014


Abstract

We have synthesized Cu2O nanoparticles (∼25 nm) starting from CuO (∼107 nm) and copper oxalate nanorods in an inert atmosphere (Ar) at a very low temperature of 350 °C. The process in the absence of the oxalate nanorods yields Cu2O at a much higher temperature of 850 °C. The Cu2O synthesized at lower temperature (350 °C) has smaller particles than Cu2O synthesized at 850 °C. We explored these nanomaterials as electrocatalysts for hydrogen and oxygen evolution which are highly desirable for renewable and clean energy applications. Electrochemical studies such as the hydrogen evolution reaction and oxygen evolution reaction (HER & OER) were carried out on glassy carbon as well as on platinum as the working electrode in KOH solution. Cu2O synthesized at lower temperature (350 °C) has 14 times higher current density during HER and 2 times higher current density during OER. These electrocatalysts were stable for 50 cycles. However, the Cu2O synthesized at higher temperature (850 °C) showed very efficient (∼98%) degradation of methylene blue (MB) in 120 min and the catalyst is stable up to the 4th cycle whereas Cu2O (350 °C) shows only 40% degradation.

Introduction

Energy and the environment (water, soil and air pollution) are the two key issues of concern across the world and thus, a significant amount of research has been dedicated to this sector. Novel materials are being designed for better efficiency and low cost. Successful splitting of water into H2 and O2, (clean fuel) is the best method (if any efficient route is found) for clean and sustainable energy. To produce H2 and O2 researchers need to develop cheap and efficient electrocatalysts. Nanosized materials are being pursued for electrochemical and photocatalytic application due to their geometrical, electronic and surface properties which are different from bulk materials.1

Cuprous oxide (Cu2O) having a direct band gap of 1.9–2.2 eV is a p-type semiconductor which absorbs light in the visible range of the solar spectrum2 and the band gap can be easily tuned by changing the particle size.3 Cu2O is an important material as catalyst due to its high stability, low toxicity, low cost and availability. It has importance in gas sensing,4 CO oxidation,5 photocatalysis,6–9 photocurrent generation,10 organic synthesis,11–13 photochemical evolution of H2,14 solar cells15 and electrochemical16 applications. There are some reports for producing H2 and O2 by nano-size metal and alloys.17–20 Cu2O in various shapes such as flowers,21 spheres,22 cubes,23 wires24, rods,25 octahedra,26,27 tubes28 and hollow structures29 has been synthesized by hydrothermal,30 microwave irradiation,31 electrochemical deposition,32 wet chemical,33–35 oxidative etching,36 solvothermal,37 and reverse micellar38 route.

To the best of our knowledge, HER & OER studies have not been carried out using Cu2O as electrocatalysts. However, reports on hydrogen evolution from the hydrolysis of ammonia borane using Cu2O–Co3O439) composites are known. Solar hydrogen generation40 is carried out using Cu2O nano/micro sphere. Photocatalytic degradation of MB (90–95%) has been studied using Cu2O catalyst in presence of H2O2.

In this paper, we discuss the low temperature synthesis of Cu2O nanoparticles (∼20–30 nm) from CuO by mixing with copper oxalate nanorods. These Cu2O nanoparticles are efficient electrocatalysts though the high temperature (850 °C) particles (Cu2O synthesized from CuO without oxalate nanorods) show better photocatalytic properties. Such differences in the properties show competing effects of crystallinity and surface morphology in the two sets of nanostructured cuprous oxide and hence such studies gives inputs to design of inorganic materials with appropriate functions.

Experimental

Copper oxalate nanorods were synthesized by the reverse micellar route.17 The Cu2O nanoparticles were obtained by thermal decomposition of CuO. In first case, CuO (Aldrich, 99.99%) was heated in Ar atmosphere, which leads to the formation of pure phase of Cu2O at 850 °C for 6 h. Below 850 °C, a mixture of CuO and Cu2O was obtained. In second case, Cu2O was obtained by mixing CuO (Aldrich, 99.99%) and copper oxalate nanorods in 1[thin space (1/6-em)]:[thin space (1/6-em)]1 ratio followed by heating in Ar at 350 °C for 6 h whereas by heating only copper oxalate nanorods in the above conditions, pure copper nanoparticles were obtained.17

Powder X-ray diffraction studies (PXRD) were carried out using Ni filtered Cu-Kα radiation. Normal scans were recorded with a step size of 0.02° and step time of 1 s. The Kα2 reflections were removed to obtain accurate lattice constants. The crystallite size of the particles were determined from X-ray line broadening studies using Scherrer's formula (t = 0.9λ/B[thin space (1/6-em)]cos[thin space (1/6-em)]θ) where t is crystallite size, λ is the wavelength (for CuKα, λ = 1.5418 Å) and B = √(BM2BS2). BM is the full width at half maximum for a particular reflection of the sample and BS is that of standard (with crystallite size of around 2 μm). Quartz was chosen as the standard for the evaluation of BS. The lattice constant was determined using least-squares fitting procedure on all the observed reflections. Transmission Electron Microscopic (TEM) studies were carried out using a Tecnai G2 20 electron microscope operated at 200 kV. TEM specimens were prepared by dispersing the Cu2O nanoparticles in ethanol by ultrasonic treatment, dropping onto a porous carbon film supported on a copper grid, and then drying in air. Field emission scanning electron microscopy (FESEM) of the compounds was carried out on FEI quanta 3D FEG-FESEM by coating the powder samples with gold. Diffuse-reflectance (DR) spectra were recorded on Shimadzu UV-2450 spectrophotometer where the baseline was fixed using a barium sulfate reference.

Cyclic voltammetry (CV) was carried out with a computer controlled electrochemical workstation (Autolab PGSTAT 302N). Hydrogen evolution and oxygen evolution reactions were studied by using Ag/AgCl as reference electrode while Pt was used as counter electrode whereas glassy carbon (0.02 cm2) and platinum (0.03 cm2) were used as working electrodes. Working electrode was polished using (0.05 μm) alumina paste, ultrasonicated in distilled water and then in ethanol. 2 mg of Cu2O nanoparticles was sonicated in 20 μL of isopropanol and then 10 μL of nafion was added. One drop (nearly 10 μL) of this paste was placed on the working electrode and dried for half an hour. All the three electrodes were placed in a freshly prepared solution of 0.5 M KOH. Cyclic voltammetry was carried out at a scan rate of 0.025 V s−1 in the potential range of −1.5 to 0 V in HER studies whereas 0 to 1 V potential was applied to the electrodes for the OER study in case of glassy carbon and 0 to 0.9 V in case of Pt as working electrode. The electroactive surface area of the catalyst on the working electrodes was measured by CV in 0.5 M KOH.

The photocatalytic activity of synthesized Cu2O powder was investigated by measuring the degradation% of methylene blue (MB) in aqueous solution under visible light. These reactions were carried out in a glass beaker in the presence and absence of H2O2. 50 mg of compound was suspended in 100 mL of methylene blue solution of concentration 20 μmol and stirred continuously for half an hour in the presence of small amount of H2O2 (10 μL ≈ nearly one small drop) and in the absence of H2O2 to ensure the adsorption/desorption equilibrium. After an equilibrium period of 30 min, the sample was illuminated with the help of a tungsten lamp. The concentration of methylene blue was measured by using UV-vis (Shimadzu UV-2450) spectrophotometer at its maximum absorption. The degradation% of MB was determined as follows:

image file: c3ra46994h-t1.tif
where A0 and At are maximum absorption value at zero minute (start of reaction) and 120 min.

Results and discussion

Powder X-ray diffraction pattern confirm the formation of monophasic Cu2O synthesized at 850 °C and 350 °C (Fig. 1) in argon gas atmosphere. All the observed reflections were indexed on the basis of simple cubic (Pn[3 with combining macron]m) crystal system (JCPDS: 782076) with refined lattice parameter 4.2682 (3) Å and 4.2474 (16) Å for the oxide synthesized at 850 °C and 350 °C respectively. We have also evaluated the crystallite size for both the samples and it is found to be 27 nm (synthesized at 350 °C) and 48 nm (synthesized at 850 °C). The decrease in the lattice parameter of Cu2O synthesized at lower (350 °C) temperature as compared to the one obtained at higher temperature synthesized (850 °C) Cu2O may be due to the decrease in crystallite size41 and the synthesis temperature.42 It is observed that on heating CuO at temperatures lower than 850 °C a mixed phase of CuO and Cu2O was obtained (Fig. 2). This indicates that CuO does not reduce to Cu2O before 850 °C. However on addition of copper oxalate to CuO in 1[thin space (1/6-em)]:[thin space (1/6-em)]1 ratio, pure phase of Cu2O can be obtained at 350 °C. Thus, addition of copper oxalate to CuO leads to lowering of the reduction temperature.
image file: c3ra46994h-f1.tif
Fig. 1 Powder X-ray diffraction pattern of Cu2O synthesized at 850 °C and 350 °C.

image file: c3ra46994h-f2.tif
Fig. 2 Powder X-ray diffraction pattern of CuO heated in argon at different temperature.
Table 1 Detailed characterization of Cu2O nanoparticles
S. no. Compound Lattice parameter Particle size (nm) Electroactive surface area (cm2 mg−1) Band gap (eV)
GC Pt
1 Cu2O (850 °C) 4.2063(4) Å 40–50 0.0207 0.0324 1.96
2 Cu2O (350 °C) 4.1825(7) Å 20–30 0.0235 0.0476 2.06


Field emission scanning electron microscopy (FESEM) studies were carried out on the compounds which show (Fig. 3 and 4) the formation of dense agglomerated nanoparticles forming layers (Cu2O obtained at 850 °C) whereas the Cu2O synthesized at lower temperature forms flake type morphology. Fig. 5 and 6 shows the TEM micrograph of Cu2O nanoparticles obtained at 850 °C and 350 °C respectively. These particles were monodisperse and spherical in nature. The average diameter of the spherical nanoparticles was found to be 40–50 nm and 20–30 nm for Cu2O obtained at higher and lower temperature respectively (Table 1).


image file: c3ra46994h-f3.tif
Fig. 3 FESEM micrograph of Cu2O synthesized at 850 °C at two magnifications.

image file: c3ra46994h-f4.tif
Fig. 4 FESEM micrograph of Cu2O synthesized at 350 °C at two magnifications.

image file: c3ra46994h-f5.tif
Fig. 5 TEM micrograph of Cu2O synthesized at 850 °C.

image file: c3ra46994h-f6.tif
Fig. 6 TEM micrograph of Cu2O synthesized at 350 °C.

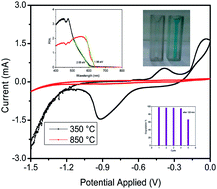
The diffuse reflectance spectroscopy shows a band at 605 nm and 634 nm and the corresponding band gap values were found to be 2.06 eV and 1.96 eV for the oxides synthesized at lower (350 °C) and higher (850 °C) temperature respectively (Fig. 9). The optical properties (band gap) of nanomaterials are size and morphology dependent.43,44 For several cases, it is observed that a change in morphology can alter the band gap. On changing the morphology from hexagonal sheet like structures to spherical particles for cobalt oxide44 nanoparticles, a difference of band gap 0.05–0.2 eV has been reported. The slight change in the band gap observed in our study for these two oxides can be attributed to the change in their morphology (particles vs. layered morphology).

By using cyclic voltammetry, we have investigated the electrochemical properties of the Cu2O nanoparticles. These nanoparticles act as electrocatalyst for hydrogen evolution reaction when a negative potential is applied from −1.5 to 0 V with glassy carbon electrode (working electrode) and platinum electrode (working electrode) in 0.5 M KOH solution at the scan rate of 0.025 V s−1. The hydrogen generation is according to the equation given below.17

M + H2O + e → MHads + OH

MHads + H2O + e → H2 + OH + M
where M = electrocatalyst

The net reaction will be the following,

2H2O + 2e → H2 + 2OH

The cyclic voltammograms of Cu2O nanoparticles for HER is given in Fig. 7. The two redox peaks observed at −0.64 V and 0.39 V for both the electrode (GC as well as Pt) in case of lower temperature synthesized Cu2O. These peaks are observed due to the oxidation of Cu+ to Cu2+. The maximum current was found to be 0.03 and 0.52 mA at an applied potential of −1.5 V for GC electrode whereas in the case of platinum as working electrode the maximum current was 0.38 and 2.52 mA for Cu2O prepared at higher and lower temperature respectively (Fig. S1). If we compare the current for both the electrocatalysts, it is clearly observed that Cu2O synthesized at lower temperature show 17 times (with GC) and 7 times (with Pt) higher current compared to Cu2O prepared at higher temperature. Current density was calculated by using the electroactive surface area which was determined by extrapolating the curve obtained from CV.17 It is found to be 0.0207 cm2 mg−1 & 0.0235 cm2 mg−1 for GC electrode and 0.0324 cm2 mg−1 & 0.0476 cm2 mg−1 for Pt electrode for Cu2O obtained at higher and lower temperature respectively. The current density is found to be 14 times higher with GC electrode and 4 times higher with Pt electrode (Fig. 7) for Cu2O synthesized at lower temperature (350 °C) as compared to that synthesized at higher temperature (850 °C). The current density depends critically on the surface area, morphology and size of the nanoparticles. Since at lower temperature we obtained smaller size nanoparticles therefore the current and current density is higher. The electrocatalyst obtained by us show excellent stability for 50 cycles (recorded continuously).


image file: c3ra46994h-f7.tif
Fig. 7 HER of Cu2O (a) on glassy carbon (b) platinum as working electrode.

Oxygen evolution reaction was also studied for these catalysts on both the electrode (GC & Pt) at the scan rate of 0.025 V s−1 in 0.5 M KOH solution at room temperature in the potential range of 0.0 to 0.9 V for Pt electrode and 0.0 to 1.0 V for glassy carbon electrode. Fig. 8 shows the cyclic voltammograms during the OER study. The GC electrode containing Cu2O (350 °C) electrocatalyst showed an increase in oxidation current at 0.15 V while using Cu2O (synthesized at 850 °C) it started at 0.55 V. In case of Pt electrode increase in oxidation current started at 0.35 V for both the cases. The following reaction occurs at the electrode surface during OER.

4OH → 2H2O + O2 + 4e


image file: c3ra46994h-f8.tif
Fig. 8 OER of Cu2O (a) on glassy carbon (b) platinum as working electrode.

The peak current is proportional to the amount of oxygen generated during electrolysis and it also depends on surface area and size of nanoparticles. The maximum current at 1.0 V potential is 0.22 mA (Cu2O 850 °C) and 0.47 mA (Cu2O 350 °C) using glassy carbon electrode and in case of Pt electrode maximum current at 0.9 V is 0.25 mA and 1.72 mA for two samples of Cu2O respectively (Fig. S2). It is clearly seen that Cu2O synthesized at lower temperature produces twice higher current at GC electrode whereas it is 7 times higher at Pt electrode. The current density was found to be 10.7 mA cm−2 & 20 mA cm−2 with GC electrode and 7.7 mA cm−2 & 35.7 mA cm−2 with Pt electrode for synthesized Cu2O (850 °C, 350 °C) respectively (Fig. 8). These electrocatalysts were highly stable over 50 cycles. This is the first study of HER and OER using Cu2O nanoparticles as electrocatalyst.

The photocatalytic efficiency of both the samples of Cu2O nanoparticles were examined by monitoring the degradation of methylene blue dye (absorption maxima of the dye is at 664 nm) under visible light both in presence and absence of H2O2. To check the photostability of the dye, an experiment was performed where the dye solution was exposed to light source without the addition of the catalyst (both in presence and absence of the H2O2). It was observed that in both the cases the concentration of the dye remained unchanged in the reaction solution even after 3 h. Also addition of catalyst in dye solution in absence of light do not show any change in the UV spectra recorded which confirms that almost no dye gets adsorbed onto the catalyst surface. UV visible spectra before and after two hours of addition of catalyst has been shown in Fig. S14. We have done zeta potential on both the samples and found that the cuprous oxide carries a net positive charge (18.9 mV for 350 °C and 8.0 mV for 850 °C). Since we have carried out the degradation for a positively charged dye, owing to electrostatic repulsion there is almost no adsorption on the surface of the material. However, in presence of H2O2, hydroxyl radical are generated which gets adsorbed on to the surface of catalyst (positive charged) blocking its active sites thereby reducing its activity. The higher the charge of the material higher the adsorption of dye. For both catalysts three different sets of reactions were performed (a) with light and with H2O2 (b) with light and without H2O2 (c) without light and with H2O2 (Fig. S3–S8). In all the three set of reactions the concentration of dye and the amount of catalyst was kept constant. The first case i.e. a reaction with light and with H2O2 shows very good efficiency towards the degradation of the dye compared to the other two conditions. Here, H2O2 acts as an electron and hydroxyl radical (OH˙)45,46 scavenger which prevents the recombination of electron–hole pair generated during the catalysis even when used in very low concentration. Since H2O2 was added in very low amount (10 μL) therefore it does not significantly change the pH of the solution. Hydrogen peroxide is very promising and important oxidant due to its low cost, high efficiency and dissociation into harmless byproduct. The Cu2O (850 °C) showed ∼98% degradation of the dye whereas Cu2O (350 °C) showed only ∼40% degradation of the dye after an irradiation of 120 min (Fig. 10). Morphology dependent photocatalytic activity is known for nanocrystalline cuprous oxide.43,47 The higher photocatalytic activity of the material synthesized at higher temperatures may be attributed to the difference in the morphology of the oxide. Cuprous oxide synthesized at high temperature exhibits the growth of the material in a layered manner. As a result, highly active faces are exposed which are potentially active as a photocatalyst probably because of the planes which are in direct contact with the dye solution. The adsorption energy of molecular water on copper depends on the crystallographic plane and follows the order γ [111] < γ [100] < γ [110].48 These planes differ in the surface atom density where [111] is reported to have the highest surface atom density whereas [110] has the lowest. The surfaces with lower atom density are reported to have higher affinity for water molecules. It is also reported that the number and density of “Cu” dangling bonds are higher for [110] plane than [111] plane owing to which photoexcitation for the generation of electrons and holes becomes easier. The presence of (110) plane as observed in the HRTEM studies (Fig. 14) for the sample synthesized at 850 °C thus justifies the higher photocatalytic activity than the oxide at 350 °C which shows (111) plane. Thus, the difference in the activity of the two materials. The recyclability of the Cu2O (850 °C) catalyst was satisfactory as five continuous cycles (Fig. S9–S13) were studied and the degradation remained almost constant upto 4th cycle (Fig. 11 & 12). After the 4th cycle, the efficiency decreases to 67%. To determine the rate constant of the photodegradation process of methylene blue, pseudo first-order kinetic equation was used which is expressed as ln[thin space (1/6-em)]A = −kt, where “A” is absorbance, “t” is the time, and “k” is reaction rate constant. The rate constant of Cu2O (850 °C) catalyst was found to be 4.28 × 10⁻² min−1 (2.57 h−1) (Fig. 13). Wu et al.49 have studied the degradation of MB by Cu2O film on tin doped indium oxide as substrate in the presence of large amount of H2O2 (0.1 to 10 mL). A degradation of 89–98% was observed as compared to 98% degradation in our study by using a very small amount (10 μL) of H2O2. Degradation percentage in our case is higher than other reports such as Cu2O,7,50 Cu2O–G (graphene)51 and Cu2O–TiO252 composites.


image file: c3ra46994h-f9.tif
Fig. 9 Diffuse reflectance spectra of Cu2O.

image file: c3ra46994h-f10.tif
Fig. 10 Photodegradation of methylene blue using (a) Cu2O – 850 °C and (b) Cu2O – 350 °C.

image file: c3ra46994h-f11.tif
Fig. 11 Recyclability of Cu2O – 850 °C as a photocatalyst (5 cycles).

image file: c3ra46994h-f12.tif
Fig. 12 Percentage degradation of methylene blue after 120 min of Cu2O – 850 °C.

image file: c3ra46994h-f13.tif
Fig. 13 Plot of absorbance vs. time of Cu2O – 850 °C photocatalyst in case of with light with H2O2 (inset shows the plot of ln(Abs.) vs. time).

image file: c3ra46994h-f14.tif
Fig. 14 HRTEM micrograph of (a) Cu2O – 850 °C and (b) Cu2O – 350 °C.

Conclusions

Cu2O nanoparticles (two sizes) have been synthesized from solid state reactions at different temperature. The average size of nanoparticles was found to be 40–50 nm and 20–30 nm for higher (850 °C) and lower temperature (350 °C) synthesized Cu2O respectively. The low temperature reaction is facilitated by the use of copper oxalate nanorods as starting materials. The HER efficiency is enhanced by 14 times on GC electrode and 4 times on Pt electrode for low temperature synthesized Cu2O. The OER is also enhanced by 2 and 5 times on GC and Pt electrodes respectively. The Cu2O synthesized at higher temperature is more efficient for the photocatalytic degradation of methylene blue. As an e and OH˙ scavenger, a small drop (10 μL) of H2O2 is sufficient to accelerate the photocatalytic process. These catalysts are quite stable for electrocatalytic and photocatalytic processes.

Acknowledgements

BK and SS thank IITD and CSIR respectively, for fellowship. Financial assistance from DeiTY and DST (Nano Mission), Govt. of India is gratefully acknowledged.

References

  1. A. Eychmüller, J. Phys. Chem. B, 2000, 104, 6514 CrossRef.
  2. L. Wu, L. Tsui, N. Swami and G. Zangari, J. Phys. Chem. C, 2010, 114, 11551 CAS.
  3. C. Lu, L. Qi, J. Yang, X. Wang, D. Zhang, J. Xie and J. Ma, Adv. Mater., 2005, 17, 2562 CrossRef CAS.
  4. J. Zhang, J. Liu, Q. Peng, X. Wang and Y. Li, Chem. Mater., 2006, 18, 867 CrossRef CAS.
  5. H. Xu, W. Wang and W. Zhu, J. Phys. Chem. B, 2006, 110, 13829 CrossRef CAS PubMed.
  6. B. White, M. Yin, A. Hall, D. Le, S. Stolbov, T. Rahman, N. Turro and S. O'Brien, Nano Lett., 2009, 6, 2095 CrossRef PubMed.
  7. J. Y. Ho and M. H. Huang, J. Phys. Chem. C, 2009, 113, 14159 CAS.
  8. P. Sharma and S. K. Sharma, Water Resour. Manag., 2012, 26, 4525 CrossRef PubMed.
  9. L. Xua, H. Xua, S. Wua and X. Zhang, Appl. Surf. Sci., 2012, 258, 4934 CrossRef PubMed.
  10. Z. Yang, C. K. Chiang and H. T. Chang, Nanotechnology, 2008, 19, 025604 CrossRef CAS PubMed.
  11. Y. Xu, H. Wang, Y. Yu, L. Tian, W. Zhao and B. Zhang, J. Phys. Chem. C, 2011, 115, 15288 CAS.
  12. S. M. Opalka, J. K. Park, A. R. Longstreet and D. T. McQuade, Org. Lett., 2013, 15, 996 CrossRef CAS PubMed.
  13. K. Wang, X. Bi, S. Xing, P. Liao, Z. Fang, X. Meng, Q. Zhang, Q. Liu and Y. Ji, Green Chem., 2011, 13, 562 RSC.
  14. P. E. de Jongh, D. Vanmaekelbergh and J. J. Kelly, Chem. Commun., 1999, 1069 RSC.
  15. H. M. Wei, H. B. Gong, L. Chen, M. Zi and B. Q. Cao, J. Phys. Chem. C, 2012, 116, 10510 CAS.
  16. K. S. Park, S. D. Seo, Y. H. Jin, S. H. Lee, H. W. Shim, D. H. Lee and D. W. Kim, Dalton Trans., 2011, 40, 9498 RSC.
  17. B. Kumar, S. Saha, M. Basu and A. K. Ganguli, J. Mater. Chem. A, 2013, 1, 4728 CAS.
  18. J. Ahmed, P. Trinh, A. M. Mugweru and A. K. Ganguli, Solid State Sci., 2011, 13, 855 CrossRef CAS PubMed.
  19. J. Ahmed, B. Kumar, A. M. Mugweru, P. Trinh, K. V. Ramanujachary, S. E. Lofland, Govind and A. K. Ganguli, J. Phys. Chem. C, 2010, 114, 18779 CAS.
  20. J. Ahmed, A. Ganguly, S. Saha, G. Gupta, P. Trinh, A. M. Mugweru, S. E. Lofland, K. V. Ramanujachary and A. K. Ganguli, J. Phys. Chem. C, 2011, 115, 14526 CAS.
  21. Z. Yang, G. LiPing, S. Xin and W. JianJi, Sci. China: Chem., 2012, 55, 1580 CrossRef.
  22. J. Liua, Z. Gao, H. Hanc, D. Wua, F. Xua, H. Wanga and K. Jianga, Chem. Eng. J., 2012, 185, 151 Search PubMed.
  23. L. Gou and C. J. Murphy, Nano Lett., 2003, 3, 231 CrossRef CAS.
  24. M. J. Chen, C. Y. Wu, Y. M. Kuo, H. Y. Chen and C. H. Tsai, Appl. Phys. A: Mater. Sci. Process., 2012, 108, 133 CrossRef CAS.
  25. H. Shi, K. Yu, F. Sun and Z. Zhu, CrystEngComm, 2012, 14, 278 RSC.
  26. H. Xu, W. Wang and W. Zhu, J. Phys. Chem. B, 2006, 110, 13829 CrossRef CAS PubMed.
  27. P. He, X. Shen and H. Gao, J. Colloid Interface Sci., 2005, 284, 510 CrossRef CAS PubMed.
  28. M. Cao, C. Hu, Y. Wang, Y. Guo, C. Guo and E. Wanga, Chem. Commun., 2003, 1884 RSC.
  29. Y. Cao, J. Fan, L. Bai, F. Yuan and Y. Chen, Cryst. Growth Des., 2010, 10, 232 CAS.
  30. X. Lan, J. Zhang, H. Gao and T. Wang, CrystEngComm, 2011, 13, 633 RSC.
  31. S. K. Li, X. Guo, Y. Wang, F. Z. Huang, Y. H. Shen, X. M. Wanga and A. J. Xie, Dalton Trans., 2011, 40, 6745 RSC.
  32. H. M. Wei, H. B. Gong, L. Chen, M. Zi and B. Q. Cao, J. Phys. Chem. C, 2012, 116, 10510 CAS.
  33. A. Ahmed, N. S. Gajbhiye and A. G. Joshi, J. Solid State Chem., 2011, 184, 2209 CrossRef CAS PubMed.
  34. Y. Sui, W. Fu, H. Yang, Y. Zeng, Y. Zhang, Q. Zhao, Y. Li, X. Zhou, Y. Leng, M. Li and G. Zou, Cryst. Growth Des., 2010, 10, 99 CAS.
  35. M. Hara, T. Kondo, M. Komoda, S. Ikeda, K. Shinohara, A. Tanaka, J. N. Kondoa and K. Domen, Chem. Commun., 1998, 357 RSC.
  36. Y. Sui, W. Fu, Y. Zeng, H. Yang, Y. Zhang, H. Chen, Y. Li, M. Li and G. Zou, Angew. Chem., Int. Ed., 2010, 49, 4282 CrossRef CAS PubMed.
  37. J. Zou, J. Ma, J. Jiang, Y. Zhang, L. Li and Q. Wan, Micro Nano Lett., 2013, 8, 197 CAS.
  38. P. He, X. Shen and H. Gao, J. Colloid Interface Sci., 2005, 284, 510 CrossRef CAS PubMed.
  39. Y. Yamada, K. Yanoa and S. Fukuzumi, Energy Environ. Sci., 2012, 5, 5356 CAS.
  40. Y. K. Hsu, C. H. Yu, Y. C. Chen and Y. G. Lin, RSC Adv., 2012, 2, 12455 RSC.
  41. J. Sheng, U. Welzel and E. J. Mittemeijer, Appl. Phys. Lett., 2010, 97, 153109 CrossRef PubMed.
  42. P. Fischerl, M. PoIomska, I. Sosnowska and M. Szymanski, J. Phys. C: Solid State Phys., 1980, 13, 1931 CrossRef.
  43. C. H. Kuo, C. H. Chen and M. H. Huang, Adv. Funct. Mater., 2007, 17, 3773 CrossRef CAS.
  44. K. Deori and S. Deka, CrystEngComm, 2013, 15, 8465 RSC.
  45. D. H. Tseng, L. C. Juang and H. H. Huang, Int. J. Photoenergy, 2012, 1, 328526 Search PubMed.
  46. Y. Zang and R. Farnood, Top. Catal., 2006, 37, 91 CrossRef CAS PubMed.
  47. C. H. Kuo and M. H. Huang, J. Phys. Chem. C, 2008, 112, 18355 CAS.
  48. Y. Zhang, B. Deng, T. Zhang, D. Gao and A. W. Xu, J. Phys. Chem. C, 2010, 114, 5073 CAS.
  49. G. Wu, W. Zhai, F. Sun, W. Chen, Z. Pan and W. Li, Mater. Res. Bull., 2012, 47, 4026 CrossRef CAS PubMed.
  50. L. Xu, H. Xu, S. Wu and X. Zhang, Appl. Surf. Sci., 2012, 258, 4934 CrossRef CAS PubMed.
  51. Z. Gao, J. Liu, F. Xu, D. Wu, Z. Wu and K. Jiang, Solid State Sci., 2012, 14, 276 CrossRef CAS PubMed.
  52. G. Jiang, R. Wang, H. Jin, Y. Wang, X. Sun, S. Wang and T. Wang, Powder Technol., 2011, 212, 284 CrossRef CAS PubMed.

Footnote

Electronic supplementary information (ESI) available. See DOI: 10.1039/c3ra46994h

This journal is © The Royal Society of Chemistry 2014
Click here to see how this site uses Cookies. View our privacy policy here.