Tunable photoluminescence of europium-doped layered double hydroxides intercalated by coumarin-3-carboxylate

Zhuang Zhang, Guangming Chen* and Jingang Liu*
Beijing National Laboratory for Molecular Sciences (BNLMS), Institute of Chemistry, Chinese Academy of Sciences, Beijing 100190, P. R. China. E-mail: chengm@iccas.ac.cn; Tel: +86 10 62561623

Received 22nd November 2013 , Accepted 13th January 2014

First published on 14th January 2014


Abstract

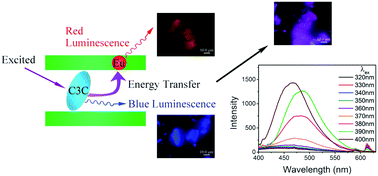
We report a highly tunable photoluminescence of rare-earth (europium, Eu3+) doped layered double hydroxides (LDHs) intercalated by an organic photofunctional anion, courmarin-3-carboxylate (C3C). Novel Eu3+-doped LDHs intercalated by C3C (ZnAlEu–LDH–C3C) with high purity and crystallinity have been successfully synthesized via an interlayer ion exchange process using Eu3+ doped LDH (ZnAlEu–LDH–NO3) as a precursor. A bilayer arrangement with nearly perpendicular orientation was deduced for the C3C anions in the LDH interlayer space. Compared with the precursor, ZnAlEu–LDH–C3C shows a strong UV absorbance and an interesting photoluminescence function, possibly due to an interfacial energy transfer process between the interlayer C3C anions and the Eu3+ within the LDH lattices. The photoluminescent spectra denote a lower symmetry of the coordinating environment around Eu3+ within ZnAlEu–LDH–C3C. More importantly, the photoluminescence of ZnAlEu–LDH–C3C could be highly tuned by simply adjusting the structural constituents (including the content of Eu3+ or C3C) or the excited wavelength. These findings open new avenues to prepare tunable photoluminescent materials and further have potential applications for optical devices.

1 Introduction

In recent years, photoluminescent materials have attracted significant academic and industrial interest due to their wide applications in various fields such as optoelectronic devices, optical communications, light conversion molecular devices and biological labeling, etc.1–5 From the perspective of practical applications, those materials having tunable photoluminescent properties such as emission colour and intensity have drawn special attentions.6–9 Besides the conventional inorganic rare-earth elements and organic luminescent molecules, layered inorganic materials have attracted much of current interests. One of the most successful examples is perhaps layered double hydroxides (LDHs).

LDHs, also known as anionic clays or hydrotalcite-like compounds, consist of positively charged brucite-like nanolayers and charge-balanced interlayer anions, which have become a hot topic in the recent decade.10–15 Their compositions are commonly expressed by the general formula [M1−x2+Mx3+ (OH)2]x+Ax/zz·mH2O, in which M2+ and M3+ are divalent (Mg2+, Zn2+, Co2+, Fe2+, Ni2+, etc.) and trivalent (Al3+, Cr3+, Fe3+, etc.) metal cations occupying in the octahedral positions within the hydroxide layers, respectively; Az can be almost any organic or inorganic anions balancing the positive charges of the hydroxide layers; x is generally believed to be between 0.20 and 0.33.16 Due to their high versatility in structural constituents and unique anion exchange ability in the interlayer space, LDHs have been widely applied in a variety of fields such as catalysts,17,18 pharmaceuticals,19 adsorbents20,21 and nano-fillers for polymer nanocomposites.22–25

In order to achieve LDHs with photoluminescent function, rare-earth doping,26–29 intercalation of rare-earth complexes30 or organic photofunctional anions31,32 are the three main ways reported so far. Rare-earth doped LDHs have been found as new photoluminescent materials.26–29 Due to the presence of the structural rare-earth metal ions such as europium (Eu3+) in the lattice of LDH host layers, typical 5D07FJ (J = 0−4) transitions of Eu3+ were clearly observed in the photoluminescence spectra.26–29 The second method is to intercalate the organic complexes of rare-earth with ethylenediaminetetraacetate (EDTA) or nitrilotriacetate (NTA) via ion-exchange reaction in the interlayer.30 The photoluminescence properties of the LDH hybrids containing Eu(III) complexes were found to be significantly affected by the charge intensity of the interlayer anions.30 Thirdly, the photoluminescence function of LDHs can be realized by guest intercalation of organic photofunctional anions such as dyes and sensitizers into the LDH host interlayer.31,32 The incorporation of the guest photofunctional anions into the LDH host matrices offers a stable and robust environment which enhances the mechanical, thermal and photo-stabilities of the organic species. And the homogeneous distribution of the organic photofunctional anions in the solid matrices at molecular level will suppress aggregation, and therefore mitigate the fluorescence quenching.31,32

Theoretically, combination of LDH host doping of rare-earth ions within lattices and guest intercalation of organic photoluminescent anions in the interlayer should provide more fascinating prospects. Unfortunately, in sharp contrast to the studies using the above three methods, such publications are very scarce. Coumarin is an important type of laser dyes, which is extensively applied in photoluminescence. Nevertheless, the studies of coumarin-intercalated LDHs are very limited. Indeed, in a literature survey, the report of photoluminescence of Eu3+-doped LDHs intercalated by coumarin has not been found so far.

Herein, we report novel Eu3+-doped ZnAl–LDHs intercalated by courmarin-3-carboxylate (C3C) anions (ZnAlEu–LDH–C3C). First, the samples of ZnAlEu–LDH–C3C were synthesized by an interlayer ion exchange procedure using Eu3+ doped LDH as precursor. Then, their structure and morphology were characterized by X-ray diffraction (XRD), Fourier-transfer infrared (FTIR) spectroscopy, element analysis and scanning electron microscopy (SEM). Finally, the photoluminescent properties, especially the tunable photoluminescence properties, and the corresponding mechanism were studied.

2 Experimental

2.1 Materials

Zn(NO3)2·6H2O, Al(NO3)3·9H2O, NaNO3, Eu2O3, nitric acid, ammonia water and hexamethylenetetramine (HMT) were purchased from Sinopharm Chemical Reagent Co., Ltd. Coumarin-3-carboxylic acid was bought from Sigma-Aldrich Co. LLC. All of the reagents were of analytical reagent (A.R.) pure grade, and used without further purification. Distilled water was used in all experimental procedures.

2.2 Synthesis of ZnAlEu–LDH precursors

The precursors of Eu3+ doped ZnAl–LDH with nitrate anions as counterions in the interlayer space (ZnAlEu–LDH–NO3) were synthesized using an HMT hydrolysis method. In brief, 2.636 g Eu2O3 powder was dissolved in excess concentrated nitric acid (0.10 mol L−1). After partly removing the nitric acid by distillation, distilled water was added to formed a 50 mL solution of Eu(NO3)3 with concentration of 0.30 mol L−1. Subsequently, Zn(NO3)2·6H2O, Al(NO3)3·9H2O, NaNO3 and HMT were dissolved in distilled water with the above Eu(NO3)3 solution to yield a 40 mL aqueous solution. The total metal concentration was 0.15 mol L−1, and Zn[thin space (1/6-em)]:[thin space (1/6-em)](Al + Eu) molar ratios were set to 2[thin space (1/6-em)]:[thin space (1/6-em)]1 with various ratios of Eu/Al. And the concentration of NaNO3 and HMT solutions were 0.50 and 0.075 mol L−1, respectively. Then, the mixed solution was transferred into a stainless autoclave with inner Teflon vessel, and hydrothermally treated at 110 °C for 24 h. After being cooled at ambient temperature, the solid was filtered and washed with distilled water in N2 atmosphere for at least three times, and finally dried in vacuum oven at 50 °C for 24 h. The obtained ZnAlEu–LDH–NO3 samples are labelled as LN0, LN1, LN2 and LN3 with an increase of Eu3+ content, where LN0 represents a ZnAl–LDH–NO3 without Eu3+ doping.

2.3 Preparation of ZnAlEu–LDH–C3C

The hybrids of ZnAlEu–LDH–C3C were prepared by interlayer anion exchange process. By adjusting the pH value to ∼7.0, 2.138 g of coumarin-3-carboxylic acid was dissolved in dilute ammonia water under ultra-sonication. The concentration of the obtained C3C solution (100 mL) was 0.01 mol L−1. Then, about 0.050 g of ZnAlEu–LDH–NO3 precursor was added in 10 mL C3C solution. Subsequently, the mixture was stirred at room temperature for 3 days. The obtained solid was filtered, washed with distilled water and anhydrous ethanol for several times, and finally dried in vacuum oven at 50 °C for 24 h. According to the abbreviations of the above precursors, the corresponding ZnAlEu–LDH–C3C samples were signed as LC0, LC1, LC2 and LC3, respectively.

2.4 Characterizations

Powder XRD measurements were conducted on a Rigaku D/max 2400 diffractometer with Cu Kα radiation (λ = 0.15418 nm) at a scanning rate of 4° min−1. The FTIR spectra were collected on a Perkin-Elmer System 2000 FTIR spectrophotometer after 64 scans within the range of 4000−400 cm−1. Content analysis of metals was performed by inductively coupled plasma (ICP) atomic emission spectroscopy on a SPECTRO ARCOS EOP Axial View Inductively Coupled Plasma Spectrometer (SPECTRO Analytical Instruments GmbH). CHN elemental analysis was carried out using a Flash EA1112 elemental analysis instrument. SEM images were taken on a HITACHI S-4800 scanning electron microscope with an acceleration voltage of 15 kV. Solid ultraviolet-visible (UV-vis) diffuse reflectance spectra were carried out using a U-3900 spectrophotometer (HITACHI). The photoluminescence excitation and emission spectra were recorded using a Hitachi F-4500 fluorescence spectrophotometer with a Xe lamp as the excitation source. Confocal laser scanning microscopic (CLSM) images were obtained on an OLYMPUS FV1000-IX81 microscope using excitation wavelength of 320–380 nm (Hg lamp).

3 Results and discussion

3.1 Structural and morphological characterizations

The precursors of ZnAlEu–LDH–NO3 were synthesized by an HMT hydrolysis method. Their crystalline structure was characterized by XRD technique. As shown in Fig. 1a, a series of intense and sharp diffraction peaks, characteristic of ordered two-dimensional (2D) alignment ordered structure, appear. The corresponding structural parameters including the characteristic reflection positions, the corresponding distances and the refined lattice parameters are illustrated in Table 1. Note that all of the peaks can be indexed according to a 3R rhombohedral symmetry.33,35 In addition, there are no noticeable Bragg reflections of any impurity phases such as Eu(OH)3, whose characteristic peaks were marked with star symbols. These results suggest the success of Eu3+ ions doping within the LDH nanosheets rather than forming separate impurity phases or being adsorbed on the LDH surfaces. Moreover, due to the slightly larger ionic radius of the Eu3+ ion (95 pm) compared to the Zn2+ (74 pm) and Al3+ (67 pm) ions,34 the d-spacing values of the basal reflections essentially increase with the increasing of the Eu3+ content. Accordingly, the cell parameter c has an obvious increase via doping with Eu3+ (Table 1). These XRD results demonstrate the success of the insertion of Eu3+ ions into the LDH lattices and the preparation of the ZnAlEu–LDH–NO3.34
image file: c3ra46930a-f1.tif
Fig. 1 XRD patterns of (a) ZnAlEu–LDH–NO3 and (b) ZnAlEu–LDH–C3C. The number of 0–3 represents the increase of Eu3+ content, where 0 stands for without Eu3+.
Table 1 Lattice parameters of ZnAlEu–LDH–NO3 and ZnAlEu–LDH–C3C samples
Samplea d003 (nm) d110 (nm) a (nm) c (nm)
a LNn and LCn (n = 0–3) denote ZnAlEu–LDH–NO3 and ZnAlEu–LDH–C3C with an increased Eu3+ content.
LN3 0.897 0.154 0.307 2.691
LN2 0.897 0.154 0.307 2.691
LN1 0.885 0.153 0.307 2.654
LN0 0.881 0.153 0.306 2.643
LC3 1.768 0.153 0.306 5.304
LC2 1.760 0.153 0.306 5.281
LC1 1.746 0.153 0.306 5.239
LC0 1.746 0.153 0.306 5.239


Fig. 2 and S1a (ESI) show the FTIR spectra of the precursors of ZnAlEu–LDH–NO3. A strong absorption band at 1384 cm−1 (characteristic of ν3 stretching vibration mode of nitrate anions)36 can be clearly observed, demonstrating the presence of nitrate in the LDH interlayer. And the band at ∼826 cm−1 is attributed to the stretching mode that confirms the presence of NO3 in the LDH interlayer with D3h symmetry.37 In addition, the broad absorption band ranged from 3750 to 2700 cm−1 is ascribed to the stretching modes of the structural hydroxyl groups for the LDH platelets and the interlayer water molecules.38 And the weak band at 1620 cm−1 results from the O–H bending vibration of the hydroxyl groups.39 Additionally, the band at approximately 426 cm−1 arises from O–M–O vibrations in the brucite-like layers, while the band at 610 cm−1 is attributed to the lattice vibration modes corresponding to the translation vibrations of M–OH.37,40


image file: c3ra46930a-f2.tif
Fig. 2 FTIR spectra of ZnAlEu–LDH–NO3 (LN3), ZnAlEu–LDH–C3C (LC3) and C3C.

After the interlayer ion exchange of NO3 by C3C anions, the positions of the basal reflections for all samples shift to low 2θ values (Fig. 1b). Thus, the basal spacings (d003) for ZnAlEu–LDH–C3C (LC) are much larger than those for the corresponding ZnAlEu–LDH–NO3 (LN), as summarized in Table 1. The dramatically increase of the interlayer distance and cell parameter c demonstrates the success of the nitrate replacement by the organic anions (C3C), which has larger ion radius than the nitrate anions. Furthermore, the intense and sharp (00l) diffraction peaks reveal that there is no obvious decrease of the crystallinity. More importantly, please note that there are reflections of neither impurity phases formed after ion exchange nor the residues of the original ZnAlEu–LDH–NO3. Table 2 displays the chemical formulae of ZnAlEu–LDH–C3C samples calculated based on the measured data of ICP and CHN elemental analyses. The absence of nitrogen element in the ZnAlEu–LDH–C3C samples (LC1, LC2 and LC3) provides further proof that the interlayer nitrate anions had been completely replaced. Therefore, we conclude that the interlayer NO3 had been fully exchanged by the C3C anions, and ZnAlEu–LDH–C3C were successfully synthesized.

Table 2 Chemical formulae of the ZnAlEu–LDH–C3C samples
Sample Chemical formula
LC3 Zn1.648Al0.925Eu0.075(OH)5.463(C10H5O4)0.833·2.241H2O
LC2 Zn1.751Al0.998Eu0.002(OH)5.711(C10H5O4)0.791·1.778H2O
LC1 Zn1.842Al0.999Eu0.001(OH)5.857(C10H5O4)0.826·2.158H2O
LC0 Zn1.861Al1.000(OH)5.779(C10H5O4)0.943·2.498H2O


Besides the proofs of XRD and chemical formulae, the success of C3C intercalation is also confirmed by FTIR spectra, as shown in Fig. 2 and S1b (ESI). For the ZnAlEu–LDH–C3C samples, the bands characteristic of C3C can be clearly observed, and obvious band shifts appear due to the strong interfacial interaction between C3C anions and LDH nanosheets. For example, the band at 1703 cm−1 is the vibration of the carboxylic groups for ZnAlEu–LDH–C3C,41 shifting from 1745 cm−1 for C3C. The band shift is as high as 42 cm−1. As for the stretching vibrations of carbonylic groups, obvious band-shift can be seen as well, i.e. from 1684 (for C3C)41,42 to 1607 cm−1 (for ZnAlEu–LDH–C3C). The C–C stretching modes at 1610 and 1568 cm−1 for C3C move to 1568 and 1384 cm−1, respectively. Additionally, the bands characteristic of phenyl group vibrations for C3C, between 833 and 646 cm−1,41 shift to 814, 762 and 619 cm−1 for ZnAlEu–LDH–C3C. These significant band-shifts for pure C3C to low wavenumbers for ZnAlEu–LDH–C3C may be ascribed to the presence of strong interfacial interactions including hydrogen bonding between carboxylate of C3C anion and hydroxyl groups on LDH sheets, electrostatic interactions between the guest anions and the positive layers, or even π–π interactions among the intercalated C3C anions.42

On the basis of the above results of XRD, FTIR and chemical formulae, a schematic model showing the alignment of the C3C anions in the interlayer of ZnAlEu–LDH–C3C was proposed in Scheme 1. If we take LC3 as an example, after deducting the distance of a single LDH platelet (0.48 nm)43 from its basal spacing (1.768 nm), the height occupied by the C3C anions could be obtained (1.288 nm). The longitude length of a C3C anion is ∼0.65 nm, calculated by the software of ChemBio 3D Ultra 12.0 via MM2 energy minimization. Assuming that the two oxygen atoms of carboxylate are combined directly with the metal hydroxide nanosheets, it can be deduced that the C3C anions pack as a bilayer arrangement with nearly perpendicular orientation in the interlayer, as depicted in Scheme 1. As for the other samples of LC0−2, their basal spacings are only a little smaller than that of LC3. Thus, for all of the ZnAlEu–LDH–C3C samples (LC0−3), the C3C anions adopt a bilayer arrangement with nearly perpendicular orientation in the interlayer space.


image file: c3ra46930a-s1.tif
Scheme 1 Schematic structural model showing the alignment of C3C anions in the interlayer of ZnAlEu–LDH–C3C (LC3).

Additionally, the morphologies of both ZnAlEu–LDH–NO3 (LN0−3) and ZnAlEu–LDH–C3C (LC0−3) measured by SEM are displayed in Fig. 3. Clearly, sheet-like aggregates with a diameter of about 300–600 nm are prevalent. No distinct differences can be recognized for the morphology between ZnAlEu–LDH–NO3 and ZnAlEu–LDH–C3C.


image file: c3ra46930a-f3.tif
Fig. 3 SEM images of ZnAlEu–LDH–C3C ((a) LC3, (b) LC2, (c) LC1 and (d) LC0) and ZnAlEu–LDH–NO3 ((e) LN3, (f) LN2, (g) LN1 and (h) LN0).

3.2 Photoluminescence properties

Fig. 4 shows the room temperature photoluminescence excitation and emission spectra of the LN3 and LC3 samples. For ZnAlEu–LDH–NO3 sample (LN3), the excitation spectrum was collected by monitoring the 5D07F2 emission lines (613 nm), and the emission spectrum was measured by the intra-4f6 (396 nm) direct excitation. In Fig. 4a, a series of sharp peaks resulting from f–f transitions within the intra-4f6 electronic configuration of Eu3+ ions can be clearly seen. In the emission spectra (Fig. 4b), the emission peaks at 577, 589, 613, 652 and 698 nm can be assigned to the 5D07FJ (J = 0, 1, 2, 3 and 4) transition of Eu3+, respectively.41,42 Furthermore, the red luminescence of ZnAlEu–LDH–NO3 was confirmed by the red emission CLSM image photographed under UV irradiation (Fig. 6d). Indeed, the intensities and splitting of the 5D07FJ transition emission peaks, which strongly depend on the local symmetry of the crystal field, are usually employed to probe the environment of the Eu3+ ions.30,44 More importantly, the intensity ratio of the electric-dipole transition (5D07F2) to the magnetic-dipole transition (5D07F1) reveals valuable information on the local environment of the anions coordinating with the Eu3+ ions.40,45 As shown in Fig. 4b, for the ZnAlEu–LDH–NO3, the emission intensities of 5D07F2 and 5D07F1 transition are essentially equal, suggesting a high symmetry of the coordinating environment around Eu3+. Besides, the obvious split peaks for 5D07F1 and 5D07F2 bands further demonstrates the high symmetry of the crystal field around the Eu3+ ions.30,44
image file: c3ra46930a-f4.tif
Fig. 4 Photoluminescence (a) excitation and (b) emission spectra of ZnAlEu–LDH–NO3 (LN3) and ZnAlEu–LDH–C3C (LC3).

As for the ZnAlEu–LDH–C3C sample (LC3), in the photoluminescence excitation spectra (Fig. 4a), all of the characteristic excited peaks for the Eu3+ ion f–f transition disappear. Instead, a strong broad band ranged from 320 to 400 nm occurs, which can be ascribed to the transition from the ground state (S0) to the first excited state (S1) (π, π*) of the interlayer C3C anions. This confirms that the excited energy absorbing centre transfers from Eu3+ ions within the LDH nanosheets to the interlayer C3C anions.34 Furthermore, this deduction is strongly supported by the UV-vis diffuse reflectance spectra (Fig. 5 and S2 in ESI). In the UV-vis spectrum for ZnAlEu–LDH–NO3, there are only two weak absorption bands at 300 and 392 nm, resulting from the LDH crystal lattices and the Eu3+ ions, respectively. In sharp contrast, the ZnAlEu–LDH–C3C shows a very strong and broad band over almost the whole UV region, essentially similar to the C3C itself. In addition, in the photoluminescence emission spectra (Fig. 4b), besides the characteristic emission peaks of Eu3+ (5D07F2 and 5D07F1), ZnAlEu–LDH–C3C also displays a new broad band at 470 nm, which may be contributed by the emission of the C3C anions.


image file: c3ra46930a-f5.tif
Fig. 5 UV-vis spectra of ZnAlEu–LDH–NO3 (LN3), ZnAlEu–LDH–C3C (LC3) and C3C.

Based on the above results, an interfacial energy transfer process (Scheme 2) was put forward to discuss the possible photoluminescent mechanism, which played an important role in photoluminescent phenomena.33,34 In brief, the energy of light is mainly absorbed by the interlayer C3C anion first. Then, it is partially transferred to the Eu3+ ions within the LDH lattices. As a result, a typical red luminescence is emitted. Meanwhile, the residual energy excites the C3C anions, resulting in a blue luminescence. The hydrogen bonding between the carboxylate in C3C anions and the hydroxyl groups of the LDH nanosheets may act as an energy transfer bridge. Similar energy transfer mechanism has been reported for lanthanide-based lamellar oxides containing aromatic molecules in the interlayer.46,47


image file: c3ra46930a-s2.tif
Scheme 2 Interfacial energy transfer process from the interlayer the C3C anions to the Eu3+ ions within the LDH lattices.

Moreover, the intensity ratio of 5D07F2 to 5D07F1 transition peak for ZnAlEu–LDH–C3C is distinctly different from that for ZnAlEu–LDH–NO3. Its hypersensitive 5D07F2 transition peak at 613 nm (LC3) appears to be dominant, suggesting that there is no inversion centre in the ZnAlEu–LDH–C3C. The unsplit peak of 5D07F2 and the emission peak of 5D07F1 further prove that the symmetry of the crystal field around the Eu3+ ions becomes lower after the LDH intercalation of C3C anions.

3.3 Tunable photoluminescence

Compared with common inorganic materials, LDHs have obvious advantages of a variety of tunable structural parameters, such as metal cations within layer lattices and exchangeable anions in the galleries. Thus, it is reasonable to achieve highly tunable photoluminescence by simply adjusting the LDH structure and constituents. Fig. 6 clearly shows that the photoluminescent colour could be effectively tuned by simply alteration of the LDH constituents. In sharp contrast to the weak glaucous luminescence (as shown in Fig. 6a and e) of the pristine un-doped ZnAl–LDH–NO3 (LN0),48 the incorporation of Eu3+ ions (LN3) endows it a bright red luminescence (as shown in Fig. 7a and d), which is mainly contributed by the characteristic emission peaks of Eu3+ ions (5D07F2 and 5D07F1). On the other hand, the intercalation of C3C anions in the LDH interlayer results in an intensely palatinate blue luminescence (as shown in Fig. 6a and c). The intercalation is also an excellent way to tune the photoluminescence properties of C3C, which only has a weak violet luminescence (as shown in Fig. 7a and f). The reason may be attributed to the orientation of C3C anions in the galleries. As a result, the ZnAlEu–LDH–C3C displays a brilliant steel pink luminescence (as shown in Fig. 7a and b), which is mixed of red and palatinate blue. Indeed, all of ZnAlEu–LDH–C3C show similar shape in photoluminescence emission spectra, and the intensity varies with the Eu3+ content (Fig. S3 in ESI). Therefore, the luminescence colour of LDHs can be effectively tuned by simply changing the structural constituents of both Eu3+ with the LDH lattices and the C3C anions in the interlayer.
image file: c3ra46930a-f6.tif
Fig. 6 (a) Photoluminescence emission spectra and (b–f) CLSM images of (b) LC3, (c) LC0, (d) LN3, (e) LN0 and (f) C3C.

image file: c3ra46930a-f7.tif
Fig. 7 The effect of wavelength on photoluminescence spectra of ZnAlEu–LDH–C3C (LC3). (a) Photoluminescence excitation spectra at different emission wavelength and their intensity ratio (inner). (b) Photoluminescence emission spectra excited at varied wavelength.

On the other hand, Fig. 7 presents the effects of excited wavelength on the photoluminescence excitation and emission spectra of the ZnAlEu–LDH–C3C. In Fig. 7a, the photoluminescence excitation spectra were recorded by monitoring the Eu3+ 5D07F2 emission lines (613 nm) and the C3C characteristic emission (470 nm), respectively. From the changes of the intensity ratio of Eu3+ to C3C emission with wavelength (Fig. 7a inset), their contributions to the macrocosmic photoluminescence can be clearly seen. Distinctly, the wavelength of 370 nm could excite the highest intensity of Eu3+ emission, while the emission of C3C is evidently dominant at 400 nm excited wavelength. Furthermore, a variety of photoluminescence emission spectra exited at different wavelength are shown in Fig. 7b, confirming the success of tunable photoluminescence for ZnAlEu–LDH–C3C by simply changing the excited wavelength.

4 Conclusions

ZnAlEu–LDH–C3C with Eu3+ doped within LDH lattices and organic photo-functional anions of C3C intercalated in the interlayer space have been successfully prepared via an interlayer ion exchange process using the precursor of ZnAlEu–LDH–NO3. Their structural characterizations of XRD, FTIR spectra and chemical formulae demonstrate the high purity and high crystallinity for both ZnAlEu–LDH–NO3 and ZnAlEu–LDH–C3C. A bilayer arrangement with nearly perpendicular orientation was proposed for the alignment of C3C anions in the LDH interlayer space. SEM images reveal that no obvious damage or breakage of the ZnAlEu–LDH–NO3 sheets occurred during the ion exchange procedure. Compared with ZnAlEu–LDH–NO3, obvious un-split peaks and high intensity ratio of emission peaks at 613 to 589 nm denote a lower symmetry of the coordinating environment around Eu3+ in the ZnAlEu–LDH–C3C. In contrast with ZnAlEu–LDH–NO3, ZnAlEu–LDH–C3C shows a strong UV absorbance and an interesting photoluminescence function, possibly due to an interfacial energy transfer process between the interlayer C3C anions and the Eu3+ within the LDH lattices. Furthermore, the photoluminescence of ZnAlEu–LDH–C3C was found to be highly tunable by simply adjusting the structural constituents (i.e. the contents of Eu3+ and C3C) or the excited wavelength. And the photoluminescence can be directly and clearly seen by naked eye in the CLSM images. These findings may open new avenues to prepare novel tunable photoluminescent materials and have potential applications for optical devices.

Acknowledgements

The authors thank National Natural Science Foundation of China (no. 51073162). G. Chen acknowledges Youth Innovation Promotion Association, CAS.

Notes and references

  1. Y. Cui, Y. Yue, G. Qian and B. Chen, Chem. Rev., 2011, 112, 1126 CrossRef PubMed.
  2. W. S. Ojo, S. Xu, F. Delpech, C. Nayral and B. Chaudret, Angew. Chem., Int. Ed., 2012, 51, 738 CrossRef CAS PubMed.
  3. D. Wang, H. Gao, E. Roze, K. Qu, W. Liu, Y. Shao, S. Xin and Y. Wang, J. Mater. Chem. C, 2013, 1, 5772 RSC.
  4. N. C. Tansil, L. D. Koh and M. Han, Adv. Mater., 2012, 24, 1388 CrossRef CAS PubMed.
  5. K. Sato, S. Yokosuka, Y. Takigami, K. Hirakuri, K. Fujioka, Y. Manome, H. Sukegawa, H. Iwai and N. Fukata, J. Am. Chem. Soc., 2011, 133, 18626 CrossRef CAS PubMed.
  6. M. J. Teng, X. R. Jia, S. Yang, X. F. Chen and Y. Wei, Adv. Mater., 2012, 24, 1255 CrossRef CAS PubMed.
  7. C.-C. Huang, H.-Y. Liao, Y.-C. Shiang, Z.-H. Lin, Z. Yang and H.-T. Chang, J. Mater. Chem., 2009, 19, 755 RSC.
  8. B. R. C. Maki Kinami and C. Weder, Chem. Mater., 2006, 18, 946 CrossRef.
  9. S. J. Toal, K. A. Jones, D. Magde and W. C. Trogler, J. Am. Chem. Soc., 2005, 127, 11661 CrossRef CAS PubMed.
  10. Q. Wang and D. O'Hare, Chem. Rev., 2012, 112, 4124 CrossRef CAS PubMed.
  11. T. Hibino and W. Jones, J. Mater. Chem., 2001, 11, 1321 RSC.
  12. Z. Hu and G. Chen, RSC Adv., 2013, 3, 12021 RSC.
  13. S. P. Lonkar, A. Leuteritz and G. Heinrich, RSC Adv., 2013, 3, 1495 RSC.
  14. Z. Zhang, G. Chen and K. Xu, Appl. Clay Sci., 2013, 72, 206 CrossRef CAS PubMed.
  15. K. Xu, G. Chen and J. Shen, Chin. Chem. Lett., 2012, 23, 805 CrossRef CAS PubMed.
  16. F. Cavani, F. Trifirò and A. Vaccari, Catal. Today, 1991, 11, 173 CrossRef CAS.
  17. C. Hu, X. Zhang, L. Xu, B. Mu, W. Zu and E. Wang, Appl. Clay Sci., 1998, 13, 495 CrossRef CAS.
  18. F. Malherbe, C. Forano, B. Sharma, M. P. Atkins and J. P. Besse, Appl. Clay Sci., 1998, 13, 381 CrossRef CAS.
  19. V. Bugatti, G. Gorrasi, F. Montanari, M. Nocchetti, L. Tammaro and V. Vittoria, Appl. Clay Sci., 2011, 52, 34 CrossRef CAS PubMed.
  20. X. Lv, Z. Chen, Y. Wang, F. Huang and Z. Lin, ACS Appl. Mater. Interfaces, 2013, 5, 11271 CAS.
  21. A. De Martino, M. Arienzo, M. Iorio, F. Vinale, M. Lorito, P. D. Prenzler, D. Ryan and H. K. Obied, Appl. Clay Sci., 2011, 53, 737 CrossRef CAS PubMed.
  22. T. Cao, K. Xu, G. Chen and C.-Y. Guo, RSC Adv., 2013, 3, 6282 RSC.
  23. P. Fu, K. Xu, H. Song, G. Chen, J. Yang and Y. Niu, J. Mater. Chem., 2010, 20, 3869 RSC.
  24. J. Liu, G. Chen and J. Yang, Polymer, 2008, 49, 3923 CrossRef CAS PubMed.
  25. K. Xu, G. Chen and J. Shen, Appl. Clay Sci., 2013, 75–76, 114 CrossRef CAS PubMed.
  26. T. Posati, F. Costantino, L. Latterini, M. Nocchetti, M. Paolantoni and L. Tarpani, Inorg. Chem., 2012, 51, 13229 CrossRef CAS PubMed.
  27. M. Dominguez, M. E. Perez-Bernal, R. J. Ruano-Casero, C. Barriga, V. Rives, R. A. S. Ferreira, L. D. Carlos and J. Rocha, Chem. Mater., 2011, 23, 1993 CrossRef CAS.
  28. H. Chen and W.-G. Zhang, J. Am. Ceram. Soc., 2010, 93, 2305 CrossRef CAS.
  29. Y. Zhao, J.-G. Li, F. Fang, N. Chu, H. Ma and X. Yang, Dalton Trans., 2012, 41, 12175 RSC.
  30. C. Li, L. Wang, D. G. Evans and X. Duan, Ind. Eng. Chem. Res., 2009, 48, 2162 CrossRef CAS.
  31. R. Liang, R. Tian, W. Shi, Z. Liu, D. Yan, M. Wei, D. G. Evans and X. Duan, Chem. Commun., 2013, 49, 969 RSC.
  32. S. Cho, S. Jung, S. Jeong, J. Bang, J. Park, Y. Park and S. Kim, Langmuir, 2013, 29, 441 CrossRef CAS PubMed.
  33. P. Gunawan and R. Xu, J. Phys. Chem. C, 2009, 113, 17206 CAS.
  34. X. R. Gao, M. Hu, L. X. Lei, D. O'Hare, C. Markland, Y. Sun and S. Faulkner, Chem. Commun., 2011, 47, 2104 RSC.
  35. M. Khaldi, A. DeRoy, M. Chaouch and J. P. Besse, J. Solid State Chem., 1997, 130, 66 CrossRef CAS.
  36. F. Yang, B. Y. Xie, J. Z. Sun, J. K. Jin and M. Wang, Mater. Lett., 2008, 62, 1302 CrossRef CAS PubMed.
  37. A. A. A. Ahmed, Z. A. Talib and M. Z. bin Hussein, Appl. Clay Sci., 2012, 56, 68 CrossRef CAS PubMed.
  38. T. Wen, X. Wu, X. Tan, X. Wang and A. Xu, ACS Appl. Mater. Interfaces, 2013, 5, 3304 CAS.
  39. L. Vieille, I. Rousselot, F. Leroux, J. P. Besse and C. Taviot-Gueho, Chem. Mater., 2003, 15, 4361 CrossRef CAS.
  40. Y. Feng, D. Li, Y. Wang, D. G. Evans and X. Duan, Polym. Degrad. Stab., 2006, 91, 789 CrossRef CAS PubMed.
  41. I. Georgieva, I. Kostova, N. Trendafilova, V. K. Rastogi and W. Kiefer, J. Mol. Struct., 2010, 979, 115 CrossRef CAS PubMed.
  42. L. Li, L. Zhang, Z. Wen and D. Chen, Chin. J. Chem., 2010, 28, 171 CrossRef CAS.
  43. T. Itoh, N. Ohta, T. Shichi, T. Yui and K. Takagi, Langmuir, 2003, 19, 9120 CrossRef CAS.
  44. Y. Chen, F. Li, S. Zhou, J. Wei, Y. Dai and Y. Chen, J. Solid State Chem., 2010, 183, 2222 CrossRef CAS PubMed.
  45. L. Hu, R. Ma, T. C. Ozawa and T. Sasaki, Chem.–Asian J., 2010, 5, 248 CrossRef CAS PubMed.
  46. M. Karmaoui, R. A. S. Ferrerira, A. T. Mane, L. D. Carlos and N. Pinna, Chem. Mater., 2006, 18, 4493 CrossRef CAS.
  47. M. Karmaoui, L. Mafra, R. A. S. Ferrerira, J. Rocha, L. D. Carlos and N. Pinna, J. Phys. Chem. C, 2007, 111, 2539 CAS.
  48. Z. Zhang, G. Chen and K. Xu, Ind. Eng. Chem. Res., 2013, 52, 11045 CrossRef CAS.

Footnote

Electronic supplementary information (ESI) available: FTIR and UV-vis spectra of all of the ZnAlEu–LDH–NO3 and ZnAlEu–LDH–C3C samples, PL spectra of all ZnAlEu–LDH–C3C samples. See DOI: 10.1039/c3ra46930a

This journal is © The Royal Society of Chemistry 2014