Reduced graphene oxide induced phase miscibility in polystyrene–poly(vinyl methyl ether) blends
Priti Xavier†
a,
Keshav Sharma†a,
K. Elayarajaa,
K. S. Vasub,
A. K. Soodb and
Suryasarathi Bose*a
aDepartment of Materials Engineering, Indian Institute of Science, Bangalore, 560012, India. E-mail: sbose@materials.iisc.ernet.in
bDepartment of Physics, Indian Institute of Science, Bangalore, 560012, India
First published on 3rd January 2014
Abstract
Graphene oxide and reduced graphene oxide (r-GO) were synthesized by wet chemistry and the effect of r-GO in PS–PVME blends was investigated here with respect to phase miscibility, intermolecular cooperativity in the glass transition region and concentration fluctuation variance by shear rheology and dielectric spectroscopy. The spinodal decomposition temperature (Ts) and correlation length were evaluated from isochronal temperature scans in shear rheology. The r-GO is shown to induce miscibility in the blends, which may lead to increased local heterogeneity in the blends, though the length of cooperatively re-arranged regions (ξ) at Tg is more or less unaltered. The evolution of the phase morphology as a function of temperature was assessed using polarized optical microscopy (POM). In the case of the 60/40 PS–PVME blends with 0.25 wt% r-GO, apart from significant refinement in the morphology, retention of the interconnected ligaments of PVME was observed, even in the late stages of phase separation suggesting that the coarsening of the phase morphology has been slowed down in the presence of r-GO. This phenomenon was also supported by AFM. Surface enrichment of PVME, owing to its lower surface tension, in the demixed samples was supported by XPS scans. The interconnected network of PVME has resulted in significantly higher permittivity in the bi-phasic blends, although the concentration of r-GO is below the percolation threshold.
Introduction
Incorporation of nanoparticles (NPs) in polymeric blends has acquired a revolutionary objective because of the synergistic improvement in electrical, mechanical and thermal properties. Furthermore, the transient, non-equilibrium morphologies of phase separating blends can be trapped to tailor their properties by the addition of NPs. Besides these properties, NPs also repress unfavorable enthalpic and entropic interactions between the constituents of the blend, which in turn alter the interaction parameter (χ) as well as the domain morphology.1 The morphology and miscibility effects of these NPs depend upon the concentration, size, shape (spherical or curved) and localization in the blends.2–6Thermorheological complexity or dynamic heterogeneity in polymer blends is associated with the different temperature and composition dependence of the segmental dynamics of each constituent. In view of this, the polymer chains that are miscible at macroscopic length scales can be very distinct and immiscible at molecular length scales. In the case of dynamically asymmetric blends (where the glass transition temperatures (Tg) of both components are far apart), thermorheological complexity is enhanced and manifests in the form of failure of time temperature superposition (tTS) and broadening of the glass transition temperature. Here, the complexity of the system can be attributed to the differences in the mobility (long range relaxation) and variation in the cooperative volume.
Dielectric spectroscopy, neutron scattering and nuclear magnetic resonance techniques have been frequently used to investigate the dynamic heterogeneity and miscibility at different length scales of polymer blend systems. Interesting observations have been documented in the domain of dynamically asymmetric blends, such as a very broad calorimetric glass transition temperature, a bimodal relaxation distribution, confined segmental dynamics and viscoelastic phase separation (VPS).7 The latter effect manifests in the formation of an interconnected co-continuous network due to spinodal decomposition and coarsens into a droplet morphology in the later stages of phase separation.8 These morphologies can be trapped or stabilized by the incorporation of NPs to impart synergistic improvements in the electrical, mechanical and thermal properties.9 In the case of near-critical compositions, phase separation is dominated by stresses due to concentration fluctuation and interfacial driven elasticity. Strong variation in the concentration fluctuation leads to a wide distribution of the cooperative segmental composition.10 The spinodal wavelength of the concentration fluctuation (known as correlation length, ξ) is a measure of the dynamic heterogeneity at the microscopic as well as macroscopic length scale.11 In the recent past, dynamic shear rheological studies have gained interest in order to investigate the macroscopic phase separation in partially miscible polymer blends as the system passes through the binodal, metastable and spinodal envelopes of phase separation.
In the recent past, probing the dynamics of component polymers in a blend system at the segmental as well as macroscopic length scale has been a topic of fundamental interest. Improvement of the physical properties at the macroscale stems from the local polymer environment and local concentration fluctuations (chain–chain connectivity), polymer chain confinement and NP-induced mobility constraints at the molecular length scale. Based on pertinent assumptions, the disparate segmental dynamics of the blend components can be explained within a volume at the length scale of the Kuhn length. Here the concentration of the component polymer at the monomer length scale deviates from the blend average due to chain–chain connectivity, which in turn is related to the dynamic heterogeneity. The concentration fluctuation model defines a ‘cooperative volume’ of polymer chain composition, where the composition and length scale of this ‘cooperative volume’ affects the local concentration fluctuation and segmental dynamics. Broadband dielectric spectroscopy and rheology are the most prominently used techniques to construe the disparity in the segmental relaxation dynamics and viscoelastic properties of blend systems, respectively. Although these techniques can account for the effect of blending with NPs on the segmental dynamics, there is a significant difference in the characteristic length scale at which the above mentioned techniques can pick up the signals.
In view of this, we have systematically investigated the effects of r-GO on the structural dynamics, phase miscibility, intermolecular cooperativity and concentration fluctuation variance via shear rheology and dielectric spectroscopy in a model LCST system; PS–PVME [polystyrene–poly(vinyl methyl ether)]. Isochronal temperature sweeps were performed in situ to detect the rheological phase separation temperature (Trheo) and the spinodal temperature (Ts) was obtained from the concentration fluctuation variation as a function of temperature. The evolution of the morphology was studied using polarized optical microscopy (POM) during the initial and late stages of phase separation. The intermolecular cooperativity between the segments and the configurational entropy was assessed using segmental dynamics near Tg and the scale of cooperativity was evaluated from calorimetric studies.
Experimental section
Materials and sample preparation
Atactic polystyrene (PS) and polyvinyl(methyl ether) (PVME) used in this study were obtained from commercial sources. PS with average molecular weight (Mw) of 35![[thin space (1/6-em)]](https://www.rsc.org/images/entities/char_2009.gif) 000 g mol−1 and with a polydispersity of 2 was obtained from Sigma-Aldrich (USA). PVME (30% solution in water) was supplied by Tokyo Chemical Industry Co., Ltd (Japan). The Mw and Mn for PVME are 80
000 g mol−1 and with a polydispersity of 2 was obtained from Sigma-Aldrich (USA). PVME (30% solution in water) was supplied by Tokyo Chemical Industry Co., Ltd (Japan). The Mw and Mn for PVME are 80![[thin space (1/6-em)]](https://www.rsc.org/images/entities/char_2009.gif) 000 and 36
000 and 36![[thin space (1/6-em)]](https://www.rsc.org/images/entities/char_2009.gif) 400 g mol−1, respectively. PVME is chemically sensitive and precautions were taken to prevent its oxidation. This can also be ensured by the transparent nature of the sample with a slight yellow color.12 Graphite flakes were obtained from Superior Graphite. Sulfuric acid (H2SO4, 98%), phosphoric acid (H3PO4, 85%), potassium permanganate (KMnO4, 99.9%), and hydrogen peroxide (H2O2, 30%), were purchased from Merck (Darmstadt, Germany). Hydrogen chloride (HCl, 37%) was purchased from Sigma-Aldrich.
400 g mol−1, respectively. PVME is chemically sensitive and precautions were taken to prevent its oxidation. This can also be ensured by the transparent nature of the sample with a slight yellow color.12 Graphite flakes were obtained from Superior Graphite. Sulfuric acid (H2SO4, 98%), phosphoric acid (H3PO4, 85%), potassium permanganate (KMnO4, 99.9%), and hydrogen peroxide (H2O2, 30%), were purchased from Merck (Darmstadt, Germany). Hydrogen chloride (HCl, 37%) was purchased from Sigma-Aldrich.
Preparation of graphene oxide (GO)
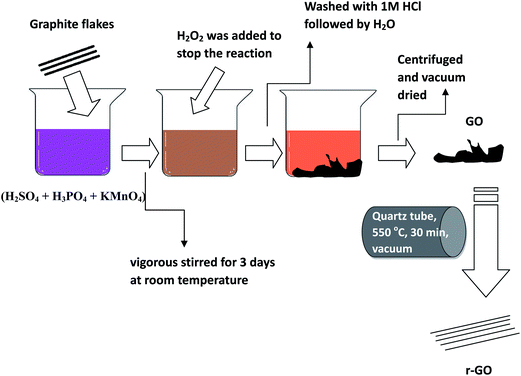
Graphene oxide (GO) was prepared by a modified Hummers method. Scheme 1 shows an illustration describing the preparation of GO and r-GO. Graphite flakes were mixed with H2SO4![[thin space (1/6-em)]](https://www.rsc.org/images/entities/char_2009.gif) :
:![[thin space (1/6-em)]](https://www.rsc.org/images/entities/char_2009.gif) H3PO4 (55
H3PO4 (55![[thin space (1/6-em)]](https://www.rsc.org/images/entities/char_2009.gif) :
:![[thin space (1/6-em)]](https://www.rsc.org/images/entities/char_2009.gif) 7 ml) and KMnO4 (6 g). While adding KMnO4, the temperature was maintained below 4 °C to control the exothermic reaction. The mixture was magnetically stirred for 3 days to allow the oxidation of graphite. The color of the mixture changed from purplish-green to dark brown. Later, to stop the oxidation process, H2O2 solution was added to the mixture. Here, the bright yellow color of the mixture indicated a high oxidation level of the graphite. The GO thus formed was centrifuged at 5000 rpm for 1 h and the supernatant was thoroughly washed. The washing process was repeated three times with 1 molar HCl solution and repeatedly with deionized water until a pH of 4–5 was achieved. During the washing process, the graphite oxide exfoliates resulting in a thick gel.13
7 ml) and KMnO4 (6 g). While adding KMnO4, the temperature was maintained below 4 °C to control the exothermic reaction. The mixture was magnetically stirred for 3 days to allow the oxidation of graphite. The color of the mixture changed from purplish-green to dark brown. Later, to stop the oxidation process, H2O2 solution was added to the mixture. Here, the bright yellow color of the mixture indicated a high oxidation level of the graphite. The GO thus formed was centrifuged at 5000 rpm for 1 h and the supernatant was thoroughly washed. The washing process was repeated three times with 1 molar HCl solution and repeatedly with deionized water until a pH of 4–5 was achieved. During the washing process, the graphite oxide exfoliates resulting in a thick gel.13
Preparation of reduced graphene oxide (r-GO)
100 mg of GO was taken in a quartz tube (1 cm dia and 15 cm length) and was sealed under vacuum (1 × 10⁻⁵ mbar). The GO was heated at 500 °C for 30 min with a heating and cooling rate at 5 °C min−1.Blend preparations
60/40 (w/w) PS–PVME blends with and without 0.25 wt% r-GO were prepared by continuous mechanical mixing of the components in tetrahydrofuran (THF). The required amount of r-GO was initially dispersed in 10 ml of THF by probe sonication (Heilscher UP 400S) at 30 °C for 30 min at 70% amplitude. These solutions were then combined with solutions of PS–PVME (in THF) to yield a total composite mass of 2 g. Shear mixing (Ultra-Turrax® T25) at 8000 rpm was subsequently applied to the PS–PVME–r-GO composites for 45 min. The composite solution was then precipitated in an excess of n-hexane and filtered under vacuum using a Teflon coated glass filter and dried overnight at room temperature followed by vacuum drying at 60 °C for 24 h to yield a solid tacky material. The neat PS–PVME blends were also prepared in the same way. PVME in water forms a LCST system and phase separates at 37 °C.14 Constant weight measurements of vacuum dried PVME ensured complete drying of the sample and was checked a priori before the blend preparation. Blend solutions of 2 wt% in toluene were prepared by spin casting for polarizing optical microscopy (POM) and atomic force microscopy (AFM) because the blend phase separates as THF evaporates abruptly.Characterization
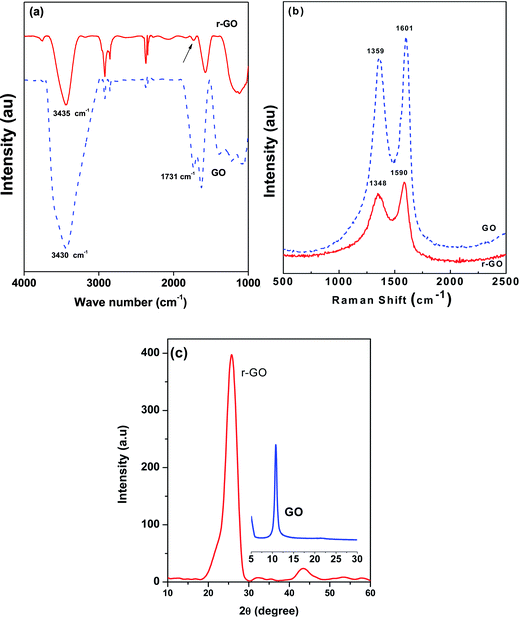
Fourier transform infrared (FTIR) spectroscopic analysis was carried out with JASCO spectrophotometers for powder samples using KBr pellets in the scanning range of 400–4000 cm−1. Fig. 1a depicts the spectra for GO and r-GO. In the case of GO, peaks for –OH (3430 cm−1), C![[double bond, length as m-dash]](https://www.rsc.org/images/entities/char_e001.gif) O (1731 cm−1) and sp2-hybridized C
O (1731 cm−1) and sp2-hybridized C![[double bond, length as m-dash]](https://www.rsc.org/images/entities/char_e001.gif) C (in-plane vibrations, 1627 cm−1) are very much evident. Various vibrational modes of different oxygen configurations like epoxide (C–O–C; 850 cm−1, bending motion; 1200–1320 cm−1 asymmetric stretching) or phenol or alcohol or ether (C–O, 1050–1150 cm−1) or other residual oxygen atoms are also evident for GO. In the case of r-GO, the C
C (in-plane vibrations, 1627 cm−1) are very much evident. Various vibrational modes of different oxygen configurations like epoxide (C–O–C; 850 cm−1, bending motion; 1200–1320 cm−1 asymmetric stretching) or phenol or alcohol or ether (C–O, 1050–1150 cm−1) or other residual oxygen atoms are also evident for GO. In the case of r-GO, the C![[double bond, length as m-dash]](https://www.rsc.org/images/entities/char_e001.gif) O vibration of a carboxyl group at 1731 cm−1 has almost disappeared and a less intense OH stretching vibration is observed at 3435 cm−1. The intensity of the peak at 1576 cm−1 increased for r-GO indicating the restoration of sp2 regions. The peaks at 1388, 1223 and 1054 are absent and a broad peak centered around 1130 cm−1 is observed due to the C
O vibration of a carboxyl group at 1731 cm−1 has almost disappeared and a less intense OH stretching vibration is observed at 3435 cm−1. The intensity of the peak at 1576 cm−1 increased for r-GO indicating the restoration of sp2 regions. The peaks at 1388, 1223 and 1054 are absent and a broad peak centered around 1130 cm−1 is observed due to the C![[double bond, length as m-dash]](https://www.rsc.org/images/entities/char_e001.gif) O vibration, which indicates the reduction of the carboxyl and hydroxyl groups from GO.15
O vibration, which indicates the reduction of the carboxyl and hydroxyl groups from GO.15
The Raman spectrum of graphene oxide was obtained using a HORIBA, LabRAM HR spectrometer with a 514 nm laser. The typical Raman spectrum of graphene oxide is shown in Fig. 1b. The G band in the spectrum is associated with the in-plane E2g optical vibrations (C–C stretching) of the graphene lattice and located at 1601 cm−1 and 1590 cm−1 for GO and r-GO, respectively. The D band is located at 1359 cm−1 and 1348 cm−1 for GO and r-GO respectively. The integrated intensity ratio of the disorder induced D band to the G band (ID/IG) of GO and r-GO is ∼1.85 (from Fig. 1b), indicating that the average defect free crystalline size is ∼9 nm in both materials.16 The relative intensity ratio ID/IG is a measure of the degree of disorder and is inversely proportional to the average size of the defect free sp2 regions.17
X-ray powder diffraction (XRD) was carried out using an X-Pert PRO, PANalytical with Cu-Kα radiation (λ = 0.15418 nm), for 2θ angles between 5° to 25°. Fig. 1c illustrates the XRD patterns for r-GO and GO (see inset). The characteristic diffraction peak (002) of GO at 10.8° indicates an interlayer spacing of ∼8.2 Å. This is due to the intercalation of water molecules between the layers and functional groups that attached to the graphene layers in the oxidation process. The XRD pattern for r-GO shows that a broad diffraction peak is obtained at 25.9°, which corresponds to a d-spacing of 3.44 Å.18
The glass transition temperatures obtained for the step change in specific heat, Cp, were measured using a calibrated Mettler Toledo DSC. The samples were heated at 10 K min−1 to 80 °C and cooled to −60 °C followed by Cp measurements at 2 K min−1.
The viscoelastic properties of the blends were measured using a stress controlled Discovery Hybrid Rheometer (DHR-3 from TA Instruments) with a parallel plate geometry (25 mm diameter) and 1 mm gap. Isochronal dynamic temperature ramp measurements were performed at a uniform heating rate of 0.5 K min−1 from the single phase (80 °C) to the phase separated regime (160 °C) to detect the onset of phase separation in the blends. A fixed frequency (0.1 rad s−1), which is low enough to lie in the terminal regime, was applied and the strain amplitude was verified to be within the linear viscoelastic region. All measurements were done under a N2 atmosphere to prevent degradation or absorption of moisture.
The onset of phase separation and the evolution of the morphology was studied using a polarizing optical microscope (Olympus BX51, Japan) fitted with an automated hot stage (Linkam THMS600). Blend films were sandwiched between a microscope slide and a cover glass. A CCD camera (ProgRes C3, Germany) mounted on the microscope allowed the recording of the evolution of morphology as a function of temperature. The samples were heated from 30 °C to 180 °C at a heating rate of 1 K min−1.
Scanning electron microscopy (SEM) was performed using an ULTRA 55, FESEM, Carl Zeiss, with an accelerating voltage of 5 kV. Fig. 2 shows the SEM micrographs of GO (Fig. 2a) and r-GO (Fig. 2b and c). The layered structure of r-GO is evident from the high resolution SEM image in Fig. 2c.
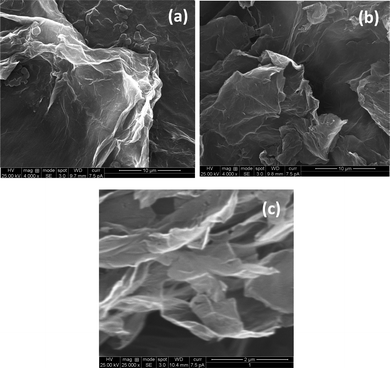 | ||
| Fig. 2 SEM micrographs of GO as synthesized (a); r-GO as synthesized (b); high magnification image of r-GO (c). | ||
Result and discussion
Effect of r-GO on the pre-transition regime and demixing of PS–PVME blends
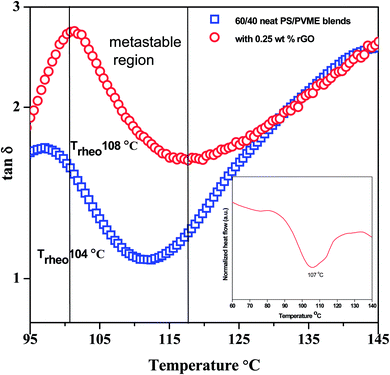
In order to obtain the demixing temperature in PS–PVME blends by shear rheology, isochronal dynamic temperature ramps were performed as mentioned in the Experimental section. The evolution of loss tangent tan![[thin space (1/6-em)]](https://www.rsc.org/images/entities/char_2009.gif) δ as a function of temperature for PS–PVME (60/40, w/w) blends with and without r-GO is illustrated in Fig. 3. As the temperature increases, thermally induced Brownian motions augment the chain mobility, which in turn decreases the storage modulus (G′). In the vicinity of demixing, a complex interplay between concentration fluctuation, mobility of the chains and interfacial driven elasticity induces extra stress in the blends. Due to strong dynamic asymmetry, concentration fluctuation and differences in the viscoelastic properties of the components, the compositional fluctuations are augmented near the phase boundary. Typically for near critical compositions, as the demixing temperature is approached, the stresses due to concentration and thermodynamics govern the phase separation. Here, the upturn in G′ or the minimum in the slope of d(tan
δ as a function of temperature for PS–PVME (60/40, w/w) blends with and without r-GO is illustrated in Fig. 3. As the temperature increases, thermally induced Brownian motions augment the chain mobility, which in turn decreases the storage modulus (G′). In the vicinity of demixing, a complex interplay between concentration fluctuation, mobility of the chains and interfacial driven elasticity induces extra stress in the blends. Due to strong dynamic asymmetry, concentration fluctuation and differences in the viscoelastic properties of the components, the compositional fluctuations are augmented near the phase boundary. Typically for near critical compositions, as the demixing temperature is approached, the stresses due to concentration and thermodynamics govern the phase separation. Here, the upturn in G′ or the minimum in the slope of d(tan![[thin space (1/6-em)]](https://www.rsc.org/images/entities/char_2009.gif) δ)/dt is considered as the rheological demixing temperature (Trheo) and is shown in Fig. 3.
δ)/dt is considered as the rheological demixing temperature (Trheo) and is shown in Fig. 3.
A dip or peak in tan![[thin space (1/6-em)]](https://www.rsc.org/images/entities/char_2009.gif) δ vs. T represents absorption of energy due to a phase transition and the area under the peak gives the energy absorbed by the system to undergo the phase transition. It is interesting to note that on addition of 0.25 wt% r-GO to 60/40 PS–PVME blends, the Trheo shifted by 5 °C. Interestingly, for the blends with r-GO, the demixing temperature, as obtained from the marked change in the heat flow in DSC, is also in close harmony (shown as an inset in Fig. 3).
δ vs. T represents absorption of energy due to a phase transition and the area under the peak gives the energy absorbed by the system to undergo the phase transition. It is interesting to note that on addition of 0.25 wt% r-GO to 60/40 PS–PVME blends, the Trheo shifted by 5 °C. Interestingly, for the blends with r-GO, the demixing temperature, as obtained from the marked change in the heat flow in DSC, is also in close harmony (shown as an inset in Fig. 3).
The contribution of the correlation length (ξ) of the concentration fluctuation to the evolving stresses can be derived from the isochronal temperature sweeps. The contribution of concentration fluctuation in the critical regime has been found by using a mean field approximation and the static structure factor was calculated by random phase approximation and by combining G′ and G′′.19,20 The ξ depends on the interaction parameter as,
 | (1) |
 | (2) |
 | (3) |
Hence, the correlation length is calculated near the critical point from the isochronal temperature sweeps using eqn (3). Fig. 4 shows the variation in ξ in the control blends and with r-GO. In the vicinity of demixing, the local concentration fluctuations increase as a function of temperature. In Fig. 4, 60/40 neat blends represent a sudden increase in ξ indicating that the progress of demixing for the blends is faster. The latter process is typically associated with the blends that are at critical or near critical compositions, where the concentration fluctuations are much stronger. Fig. 4 suggests that r-GO delays the evolution of ξ with temperature, suggesting that r-GO augments the miscibility gap. It is interesting to see that the increase in ξ in the case of the blends with r-GO is slower in comparison with the control blends as r-GO slows down the demixing process. These results corroborate well with the optical micrographs where coarsening of the phase morphology is also reduced significantly in the presence of r-GO (discussed in detail in the next section). The order of magnitude of ξ (20 Å to 200 Å) obtained in this work is similar to those reported by Dudowicz et al.21 The binodal temperature (Tb) derived from the inflection point is shown in Fig. 4. The Tb thus obtained for 60/40 PS–PVME blends and with r-GO is summarized in Table 1.
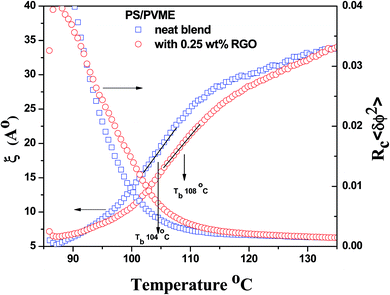 | ||
| Fig. 4 Evolution of correlation length and variance of concentration fluctuation as a function of temperature for 60/40 PS–PVME neat blends and blends with 0.25 wt% r-GO. | ||
| Composition (PS–PVME) | From isochronal temperature sweep (Trheo ± 1 °C) | From Fredrickson Larson plot (Ts ± 1 °C) | From correlation length vs. temperature (Tb ± 1 °C) |
|---|---|---|---|
| 60/40 | 104 | 107 | 104 |
| 60/40 with 0.25 wt% r-GO | 108 | 110 | 108 |
Segmental dynamics and the local concentration fluctuation are determined by the interchain connectivity of the constituents. Dynamics as well as concentration fluctuation in the local environment of the monomer are affected by the concentration of monomers of the same kind. The latter effect introduces self-concentration in determining the local composition.22 The compositions surrounding a component are incorporated by the contribution by the distribution from the intrachain self-concentration and interchain concentration fluctuation.
The local composition within a sphere of radius Rc (correlation radius) has been considered to study the segmental dynamics. It was found to be 5.4 Å in the case of PS–PVME blends.23 In the case for a small correlation volume, Rc < b, where b is the Kuhn length of the segment, the chains are in an inflexible state. Hence, the intramolecular concentration is constant. The volume occupied by single segments of species νA and νB can be calculated from their packing lengths lpA, lpB and the Kuhn length.
In order to calculate the distribution of the intermolecular concentration in an arbitrarily chosen volume, a probability distribution function has been developed which is a Gaussian distribution approximation of the concentration distribution. The variation in concentration fluctuation can be characterized by the structure factor at the zero angle (S(0)). The correlation length for the concentration fluctuation (ξ) is given by
 | (4) |
 | (5) |
Using a mean field approximation, Fredrickson and Larson24 have developed a method to derive the critical contribution of the concentration fluctuation to the viscoelastic property of the block copolymers in the transitional regime. Later, Ajji and Choplin20 have extended the above theory by using structure factor values derived by de Gennes by mean field approach in a random phase approximation and derived equations for G′ and G′′ in the terminal one phase region near the critical point. The ratio of G′/G′′ can be derived which eliminates the ζ and its frequency dependence and is given as:
 | (6) |
This expression is valid only in the terminal regions where G′ and G′′ scale with frequency as G′ ∼ ω2 and G′′ ∼ ω. Assuming that the interaction parameter scales with temperature as,
| χ = A + B/T, | (7) |
where A is the entropic part of the interaction parameter (χ) and B is the enthalpic part of χ. Ajji and Choplin arrived at the following equation, by substituting the value of χ in eqn (6), which show a linear dependency of (G′′2/G′T)2/3 vs. 1/T,
 | (8) |
 | (9) |
The spinodal decomposition temperature Ts is calculated by taking the reciprocal of the intercept to the 1/T axis. Utilizing mean field theory by Fredrickson and Larson, which has been extended to polymer blends by Ajji and Choplin, a linear relationship can be obtained by plotting (G′′/G′T)2/3 versus (1/T) and the intercept with the horizontal axis yields the Ts.
A typical plot of (G′′/G′T)2/3 versus (1/T) is shown in Fig. 5 for the control 60/40 blends (see inset of Fig. 5) and blends with 0.25 wt% r-GO. The slope of the curve is taken in the low-temperature regime, and the intercept with the 1/T axis gives Ts. It is observed that for the control 60/40 blends and blends with 0.25 wt% r-GO, the spinodal decomposition temperatures are 117 °C and 123 °C using FL plots, which are well above the Trheo. The original theory by Fredrickson and Larson was developed for concentration fluctuation in homogeneous systems. It means that the rheological data of the miscible domain is extrapolated to deduce the Ts. According to the mean field theory, the contribution of concentration fluctuation dominates the overall dynamic moduli estimated by shear rheology in the vicinity of phase separation temperature. Ts obtained using Fredrickson and Larson's (FL) approach works very well for the blend systems where the contribution of concentration fluctuation is very large. It is a prerequisite of mean field theory that the rheological data used to extrapolate the Ts should lie in the one phase regime. In the blends with strong dynamic asymmetry (as in the case of PS–PVME), the contribution of concentration fluctuation of the stress is much larger than the elastic component of the stress. This phenomenon is more evident in blends with r-GO as particle segregation can add to the evolving stresses and consequently, the concentration fluctuation can vary. The Ts for the 60/40 PS–PVME blends with 0.25 wt% r-GO is estimated to be 110 °C. Similar observations were also noted in PS–PVME blends with MWNTs.25
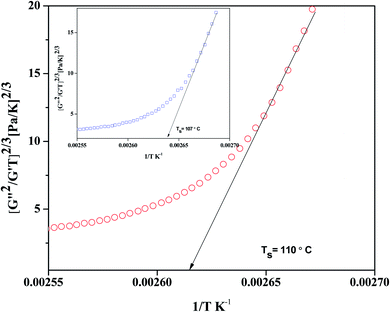 | ||
| Fig. 5 Determination of the spinodal temperature using the Fredrickson–Larson approach for the 60/40 PS–PVME neat blend (shown as inset) and with 0.25 wt% r-GO. | ||
Evolution of the morphology as assessed by POM
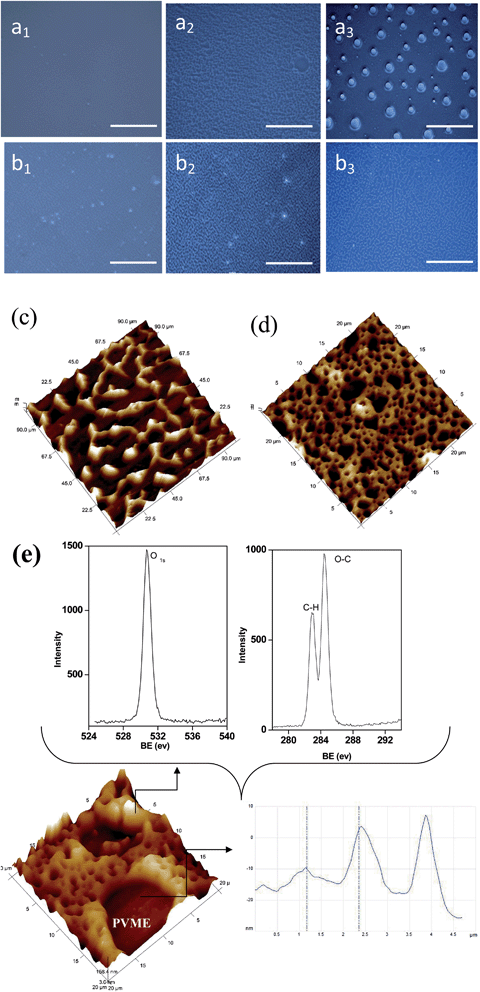
Evolution of the morphology was characterized by POM as the system passed through the metastable and unstable envelopes of the phase diagram. Fig. 6 shows the morphology evolution of the control 60/40 (w/w) PS–PVME blends (Fig. 6a1–a3) and with r-GO (Fig. 6b1–b3) in the metastable and in the unstable regions. The phase with a high phase of refraction, PS (which forms the matrix), appears darker while the PVME-rich phase forms the brighter dispersed phase. It should be noted that for blends with r-GO, objectives with higher resolution were used to probe the evolution of the morphology during phase separation, as the length scales of the domains were much more refined in contrast to the neat blends. In the case of the 60/40 (w/w) PS–PVME blends, in the early stages (Fig. 6a1) and in the intermediate stages (Fig. 6a2) of phase separation, PVME forms a network in a continuous PS-rich phase. This morphology is unstable and attains equilibrium in the late stages where the PS-rich continuous phase transforms into a continuous matrix and PVME forms droplets (Fig. 6a3). Preferential wetting of particles in the blends can alter the concentration fluctuation as well as the viscoelastic properties of the components. In the case of the 60/40 PS–PVME blends with 0.25 wt% r-GO, apart from significant refinement in the morphology, retention of interconnected ligaments of PVME can be observed even at late stages of phase separation (Fig. 6b2 and b3), suggesting that the coarsening of phase morphology has been slowed down in the presence of r-GO. These results correlate with the slow variation of ξ in the presence of r-GO, as discussed in the previous section (Fig. 4).The PVME phase evolves as a highly interconnected network in the blends. In the later stages, the interconnectivity breaks down due to hydrodynamic flow and interfacial tension. It should be noted that the evolution of morphology in the blends is a result of the interplay of phase separation, wetting and anisotropic interparticle interaction. In the presence of r-GO, the evolved morphology is much finer and a delay in the breakup of the initially developed co-continuous phase is evident.26
To support the presence of r-GO in the PVME phase, AFM images were captured on the samples which were annealed at 125 °C for 1 h followed by quenching in liquid N2 to arrest the phase morphology. In the AFM images (see Fig. 6c and d), the stiffer PS appears brighter. In the presence of r-GO, significant refinement in the morphology is observed. As expected, r-GO is localized in the energetically favored phase, i.e. PVME (see Fig. 6e), as PVME is more polar than PS. This is further supported by the roughness factor as shown in the inset of Fig. 6e. It is envisaged that owing to low interfacial tension and preferential affinity, PVME wets both the air–polymer interface and the substrate–polymer interface resulting in surface enrichment in the demixed samples. The XPS scans from the top 10 nm of the surface reveal this phenomenon (see inset of Fig. 6e).
Intermolecular and scale of cooperativity: effect of r-GO
Dielectric spectroscopy is performed as a function of frequency and temperature to study the effect of r-GO on the segmental relaxations and intermolecular cooperativity in the blends.27 By probing the segmental dynamics in the vicinity of Tg, one can gain information on the distinct segmental mobility, coupling and intermolecular cooperativity in the blends.Fig. 7 illustrates the ε′′ as a function of frequency in the temperature range where the segmental dynamics are active for the control and blends with r-GO (0.25 wt%). The Havriliak–Negami (HN) fitting parameters are compiled in Table 2. Above Tg, as can be seen in Fig. 7, a loss peak that is strongly dependent on temperature is evident. This peak corresponds to α-relaxation of PVME as only PVME reorients more quickly in an alternating ac field compared with PS owing to its higher dipole moment than PS.27 In the case of the blends with r-GO, the segmental relaxations are observed to be significantly altered (see Fig. 7b and Table 2). In particular, the loss maxima of the blends are shifted towards slightly higher frequencies. It is worth recalling that PVME is more polar than PS due to the high dispersive solubility parameter of PVME (δd = 7.1 MPa1/2) in stark contrast to that of PS (δd = 1.1 MPa1/2), even though the solubility parameter of PVME (δ = 22.6 MPa1/2) is comparable to that of PS (δ = 19.2 MPa1/2). Hence, r-GO preferentially interacts with PVME in the blends. Near the calorimetric Tg, the chain segments of the slower component could be considered immobile with respect to the component having lower Tg. This results in a distribution of segmental motions and an anomalously broad Tg.
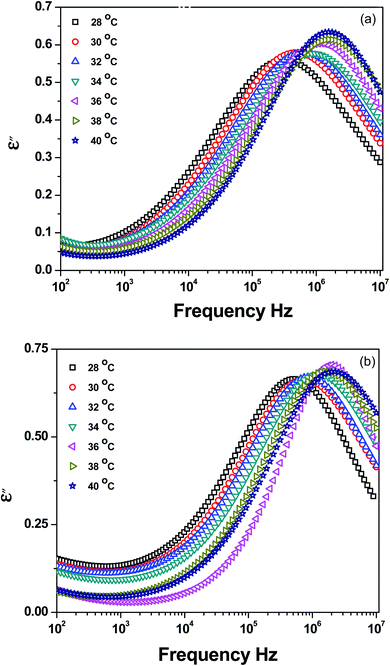 | ||
| Fig. 7 Dielectric loss (ε′′) as a function of frequency for 60/40 PS–PVME blends (a) neat and (b) with 0.25 wt% r-GO. | ||
| T (°C) | αHN | βHN | βKWW | c | τHN × 107 |
|---|---|---|---|---|---|
| PS–PVME 60/40 | |||||
| RT | 0.52 | 0.80 | 0.4901 | 0.5099 | 5.00 |
| 28 | 0.50 | 1.00 | 0.5691 | 0.4309 | 4.20 |
| 30 | 0.52 | 0.80 | 0.4901 | 0.5099 | 3.34 |
| 32 | 0.51 | 0.89 | 0.5261 | 0.4739 | 2.50 |
| 34 | 0.49 | 0.99 | 0.5595 | 0.4405 | 1.80 |
| 36 | 0.51 | 0.99 | 0.5780 | 0.4220 | 1.40 |
| 38 | 0.51 | 1.00 | 0.5784 | 0.4216 | 1.00 |
| 40 | 0.55 | 1.00 | 0.6150 | 0.3850 | 1.00 |
| PS–PVME 60/40 + 0.25 wt% r-GO | |||||
| RT | 0.60 | 0.89 | 0.6005 | 0.4000 | 3.26 |
| 28 | 0.58 | 0.99 | 0.6370 | 0.3630 | 2.95 |
| 30 | 0.60 | 0.70 | 0.4940 | 0.5060 | 2.07 |
| 32 | 0.60 | 0.80 | 0.5506 | 0.4494 | 1.77 |
| 34 | 0.60 | 0.75 | 0.5225 | 0.4475 | 1.28 |
| 36 | 0.60 | 0.75 | 0.5225 | 0.4475 | 0.96 |
| 38 | 0.60 | 0.75 | 0.5225 | 0.4475 | 0.96 |
| 40 | 0.60 | 0.69 | 0.4882 | 0.5118 | 0.74 |
The temperature dependence of the relaxation times can be explained by the Vogel–Fulcher (VF) equation,
 | (10) |
 | (11) |
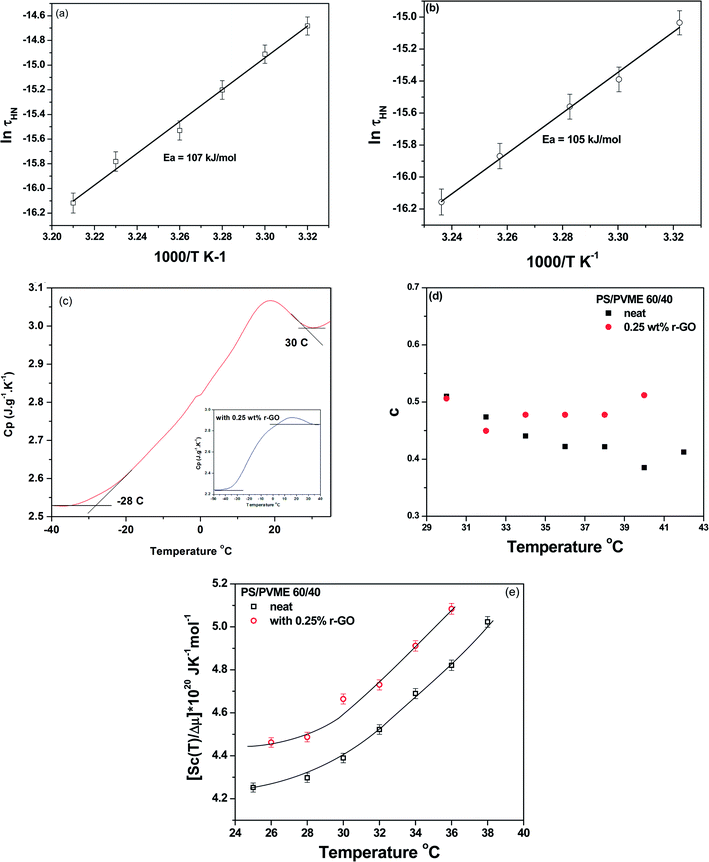
Fig. 8a and b illustrate the temperature dependent behavior of τmax and the activation energies (Ea) obtained from the slope. The results indicate that the energy barrier to rotation is lower in the case of the blends with r-GO, suggesting an increase in local free volume. This is also manifested in slightly hastened segmental dynamics (see Table 2).
Disparity in Tg leads to differences in the relaxation rates of the segments and hence, various theoretical models have been proposed to explain the heterogeneous nature of the α-relaxation process. The basic premise of the coupling model stems from the differences in coupling between the molecules and their surroundings and hence, the intermolecular cooperativity can be obtained from dielectric spectroscopy in time domain and is well described by the Kohlrausch–Williams–Watts (KWW) model.30,31 The KWW parameters can be obtained after the HN fit and are related as follows,
| βKWW = (αγ)1/1.23; c = 1 − βKWW | (12) |
where c is intermolecular cooperativity. The scale of cooperativity at Tg can also be estimated from DSC (see Fig. 8c) by the following relation,
| Va = kTg2ΔCp−1/ρ(δT)2 | (13) |
The cooperative volume and the scale of cooperativity (ra, assuming the volume to be an equivalent of a sphere and Rc, as a cube) is calculated from DSC (using eqn (13)) and are listed in Table 3. Interestingly, the intermolecular cooperativity of the blends with r-GO is higher than the neat blends (Fig. 8d) and moreover, it is decreasing with an increase in temperature. It is important to recall that r-GO enhanced the miscibility in the blends, which is contingent on the enhanced intermolecular interactions between the components. It is important to note that the cooperativity at different length scales may be quite different.
| Sample | Tg | Δ(Cp−1) (J K−1 g−1)−1 × 10⁻² | Volume of cooperativity Va = 4/3πra3 (Å)3 | Scale of cooperativity ra (Å) | Rc = (lK)1/3![[thin space (1/6-em)]](https://www.rsc.org/images/entities/char_2009.gif) c c |
||
|---|---|---|---|---|---|---|---|
| Tgi (°C)a | Tgf (°C)b | δT | |||||
| a Tgi: Tg initial;b Tgf: Tg final;c lK: length scale of cooperativity. | |||||||
| PS–PVME 60/40 | −28 | 30 | 29 | 6.43 | 75.8 | 2.63 | 4.2 |
| PS–PVME 60/40 + 0.25 wt% r-GO | −34 | 37 | 35.5 | 9.76 | 77.1 | 2.64 | 4.3 |
The cooperative volume in the case of blends with r-GO is more or less unaltered in contrast to the neat blends (see Table 3). The width of the Tg, which is moderately higher in case of the blends with r-GO suggests more heterogeneity and local nano-confined spaces with an increase in local free volume.32
Under the framework of Adam–Gibbs (AG) theory, the number of particles that cooperatively rearrange is assumed to increase with decreasing temperature and the configurational entropy per mol of particles, Sc(T), can be written as,
Sc(T) = NAs*cΔμ/kBT![[thin space (1/6-em)]](https://www.rsc.org/images/entities/char_2009.gif) ln ln![[thin space (1/6-em)]](https://www.rsc.org/images/entities/char_2009.gif) τ(T)/τo τ(T)/τo
| (14) |
By assuming a value of s*c (which is the entropy of the particles that can rearrange and is given by kB![[thin space (1/6-em)]](https://www.rsc.org/images/entities/char_2009.gif) ln
ln![[thin space (1/6-em)]](https://www.rsc.org/images/entities/char_2009.gif) 3! for polymers), a relationship between Sc(T)/Δμ can be derived.30,33 It is interesting to note that the macroscopic configurational entropy per mol of particles in the glassy state is not a constant but diminishes slowly with decreasing temperature (see Fig. 8e). This also essentially means that the number of particles that cooperatively rearrange is assumed to increase with decreasing temperature and is consistent for both the blends studied here.
3! for polymers), a relationship between Sc(T)/Δμ can be derived.30,33 It is interesting to note that the macroscopic configurational entropy per mol of particles in the glassy state is not a constant but diminishes slowly with decreasing temperature (see Fig. 8e). This also essentially means that the number of particles that cooperatively rearrange is assumed to increase with decreasing temperature and is consistent for both the blends studied here.
As seen from POM, the interconnected network of PVME is retained for longer time scales. This has further resulted in a significant increase in permittivity in blends with r-GO. An illustration (Fig. 9) of the effect of thermodynamically driven localization of r-GO in the PVME phase on the bulk permittivity of the blends is shown. From rheology, dielectric and Cp measurements, it is understood that the improving role of r-GO on the miscibility of PS–PVME blends may lead to increased local heterogeneity in the blends and wider distribution of cooperatively rearranged regions at Tg. The intermolecular coupling is higher in the case of blends with r-GO suggesting increased heterogeneity in which both the chains will cooperatively rearrange at Tg.33
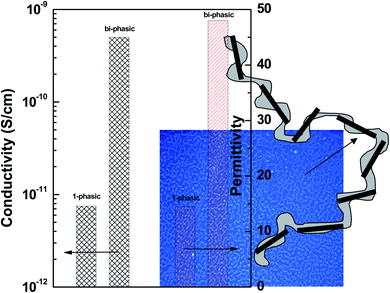 | ||
| Fig. 9 Illustration of the effect of thermodynamically driven localization of r-GO in the interconnected network of PVME on the bulk permittivity in the blends. | ||
Summary
In this work, we provided a comprehensive view for assessing the effect of r-GO on the concentration fluctuation and phase transition for near critical compositions of PS–PVME [polystyrene–poly(vinyl methyl ether)] blends using dynamic shear rheology. The rheological demixing temperature (Trheo) as obtained from the classical upturn in the dynamic moduli was observed to be in close harmony with those obtained from DSC measurements. Variance of concentration fluctuation, which takes into account the self concentration, chain connectivity and thermodynamic concentration fluctuations, was studied as a function of temperature. Interestingly, both the Trheo and the Ts up-shifted in the blends in the presence of 0.25 wt% r-GO, manifesting in molecular level miscibility. PVME, which evolved as an interconnected network during early stages of demixing coarsened into matrix-droplets in the late stages as observed from POM images. These phenomenal changes further led to significant permittivity in the blends. The improving role of r-GO on the miscibility of PS–PVME blends has led to increased heterogeneity in the blends, while the length scale of cooperatively rearranged regions at Tg is more or less unaltered. The intermolecular coupling is higher in the case of the blends with r-GO suggesting increased heterogeneity in which both the chains will cooperatively rearrange at Tg.Acknowledgements
AKS gives thanks for the support from the Nano – Mission of the Department of Science & Technology (DST), India and SB gratefully acknowledges the financial support from DST, India (Project code: DSTO 1096).References
- S. Bose, A. R. Bhattacharyya, R. A. Khare, A. R. Kulkarni and P. Pötschke, Macromol. Symp., 2008, 263, 11–20 CrossRef CAS.
- G. Vleminckx, S. Bose, J. Leys, J. Vermant, M. Wübbenhorst, A. A. Abdala, C. Macosko and P. Moldenaers, ACS Appl. Mater. Interfaces, 2011, 3, 3172–3180 CAS.
- Y. S. Lipatov, A. Nesterov, T. Ignatova and D. Nesterov, Polymer, 2002, 43, 875–880 CrossRef CAS.
- V. V. Ginzburg, Macromolecules, 2005, 38, 2362–2367 CrossRef CAS.
- V. V. Ginzburg, F. Qiu, M. Paniconi, G. Peng, D. Jasnow and A. C. Balazs, Phys. Rev. Lett., 1999, 82, 4026–4029 CrossRef CAS.
- A. C. Balazs, T. Emrick and T. P. Russell, Science, 2006, 314, 1107–1110 CrossRef CAS PubMed.
- H. Tanaka, Adv. Mater., 2009, 21, 1872–1880 CrossRef CAS.
- T. Xia, Y. Huang, X. Peng and G. Li, Macromol. Chem. Phys., 2010, 211, 2240–2247 CrossRef CAS.
- L. Li, C. Miesch, P. K. Sudeep, A. C. Balazs, T. Emrick, T. P. Russell and R. C. Hayward, Nano Lett., 2011, 11, 1997–2003 CrossRef CAS PubMed.
- S. Shenogin, R. Kant, R. H. Colby and S. K. Kumar, Macromolecules, 2007, 40, 5767–5775 CrossRef CAS.
- H. Tanaka, Faraday Discuss., 2012, 158, 371–406 RSC.
- H. M. Petri, A. Stammer and B. Wolf, Macromol. Chem. Phys., 1995, 196, 1453–1463 CrossRef CAS.
- Y. S. Lim, Y. P. Tan, H. N. Lim, N. M. Huang and W. T. Tan, J. Polym. Res., 2013, 20(6), 156 CrossRef.
- M. Suzuki and O. Hirasa, Responsive Gels, Springer, 1 edn, 1993 Search PubMed.
- Y. Guo, X. Sun, Y. Liu, W. Wang, H. Qiu and J. Gao, Carbon, 2012, 50, 2513–2523 CrossRef CAS PubMed.
- L. G. Canxado, K. Takai, T. Enoki, M. Endo, Y. A. Kim, H. Mizusaki, A. Jorio, L. N. Coelho, R. Magalhaes-Paniago and M. A. Pimenta, Appl. Phys. Lett., 2006, 88, 163106 CrossRef PubMed.
- K. Vasu, B. Chakraborty, S. Sampath and A. Sood, Solid State Commun., 2010, 150, 1295–1298 CrossRef CAS PubMed.
- K. De Silva, S. Gambhir, X. Wang, X. Xu, W. Li, D. Officer, D. Wexler, G. G. Wallace and S. Dou, J. Mater. Chem., 2012, 22, 13941–13946 RSC.
- K. Sharma, M. Sharma, A. Chandra and S. Bose, Macromol. Chem. Phys., 2013, 214, 2651–2669 CrossRef CAS.
- A. Ajji and L. Choplin, Macromolecules, 1991, 24, 5221–5223 CrossRef CAS.
- J. Dudowicz and K. F. Freed, J. Chem. Phys., 1992, 96, 1644–1647 CrossRef CAS PubMed.
- C. M. Roland, K. J. McGrath and R. Casalini, Macromolecules, 2006, 39, 3581 CrossRef CAS.
- R. K. Sergei Shenogin, R. H. Colby and S. K. Kumar, Macromolecules, 2007, 40, 5767 CrossRef.
- G. H. Fredrickson and R. G. Larson, J. Chem. Phys., 1987, 86, 1553–1560 CrossRef CAS PubMed.
- P. Xavier and S. Bose, J. Phys. Chem. B, 2013, 117, 8633–8646 CrossRef CAS PubMed.
- J. A. Pathak, R. H. Colby, G. Floudas and R. Jerome, Macromolecules, 1999, 32, 2553–2561 CrossRef CAS.
- I. S. Polios, M. Soliman, C. Lee, S. P. Gido, K. Schmidt-Rohr and H. H. Winter, Macromolecules, 1997, 30, 4470–4480 CrossRef CAS.
- J. Rault, J. Non-Cryst. Solids, 2000, 271, 177–217 CrossRef CAS.
- E. Chehrazi and N. Taheri Qazvini, Iran. Polym. J., 2013, 22, 613–622 CrossRef CAS PubMed.
- C. Roland and K. Ngai, Macromolecules, 1992, 25, 363–367 CrossRef CAS.
- C. Roland and K. Ngai, J. Rheol., 1992, 36, 1691 CrossRef CAS.
- G. Katana, E. Fischer, T. Hack, V. Abetz and F. Kremer, Macromolecules, 1995, 28, 2714–2722 CrossRef CAS.
- A. Alegria, E. Guerrica-Echevarria, L. Goitiandia, I. Telleria and J. Colmenero, Macromolecules, 1995, 28, 1516–1527 CrossRef CAS.
Footnote |
| † Priti Xavier and Keshav Sharma contributed equally to this work. |
| This journal is © The Royal Society of Chemistry 2014 |

