Lanthanum-based coordination polymers microplates using a “green ligand” EDTA with tailorable morphology and fluorescent property†
Zhurui Shen*ad,
Sisi Hea,
Pengcheng Yaoa,
Xun Laoa,
Bin Yangc,
Yejing Dai*a,
Xiaohong Suna and
Tiehong Chenb
aKey Laboratory for Advanced Ceramics and Machining Technology of Ministry of Education, Tianjin University & School of Material Science and Engineering, Tianjin University, Tianjin 300072, PR China. E-mail: shenzhurui@tju.edu.cn; daiyj04@tju.edu.cn
bKey Laboratory of Advanced Energy Materials Chemistry (MOE), College of Chemistry, Nankai University, Tianjin 300071, PR China
cShenyang Branch, Shimadzu (China) Co., LTD., PR China
dJiangsu Province Key Laboratory of Fine Petrochemical Engineering, Changzhou University, Changzhou 213164, PR China
First published on 22nd January 2014
Abstract
In this work, lanthanum (La)-based coordination polymers (CPs) microplates were fabricated in a simple bottom-up way by hydrothermal reaction of La3+ and a “green ligand” EDTA (ethylenediamine-N,N,N′,N′-tetraacetate). Under similar conditions, cerium (Ce)–EDTA CPs microplates could also be fabricated, which had the same crystalline phase and similar chemical composition to the La–EDTA CPs. The formation mechanism of the La–EDTA CPs was investigated and proved to follow the Ostwald ripening process. Moreover, its morphology could be tuned facilely by varying the quantity of EDTA and the total concentrations of reactants, and several kinds of micro/nanostructures were produced such as nanoparticle clusters, nanofibers, large or uniform microplates. Furthermore, the as-prepared La–EDTA CPs exhibited green light emission property after doping with Tb3+, and La2O3 nanorods as well as CeO2 microplates were also prepared by calcination of their corresponding CPs precursors.
Introduction
Metal organic frameworks or coordination polymers (CPs) have extensive potential applications in non-linear optics, gas storage, catalysis, and medicine etc.1–5 Recently, minimizing the bulk CPs to the micro- and nanometer-scale has attracted great attention due to their unique and highly tailorable properties.6–21 In the past few years, amazing results have been reported successively, for example, highly conductive [Pt2I(S2CCH3)4]n CPs nanoribbons have been reported, which could be a candidate material for applications in molecular electronics.16 Maspoch and his co-workers have developed a general spray-drying strategy to fabricate hollow superstructures assembled from kinds of CPs nanocrystals.21 Notably, it is found that interesting morphologies or applications could always be discovered by selecting proper organic reagents as the linkers in coordination frameworks.14,15,19,20 For instance, van der Boom et al. established that N donor aromatic ligands with a dendrimer-like structure would result in well-defined CPs nanotubes or nanospheres,19 whereas Hu and his co-workers have prepared a series of magnetic CPs micro/nanostructures by selecting CN− as the effective coupling ligands.20 As a result, it is meaningful to search and investigate novel ligands for CPs micro/nanostructures, which would not only enrich its family but also bring us some unexpected results on morphology control or interesting properties.EDTA (ethylenediamine-N,N,N′,N′-tetraacetate) is widely known as a kind of low-cost and biocompatible organic molecule.22,23 Due to its numerous N and O coordination sites and flexible connection modes, it has been demonstrated to be a particularly interesting candidate for the assembly of metal–organic coordination polymers and complexes.24–28 Moreover, it has also been demonstrated that EDTA-based coordination compounds have important roles in catalysis,26 magnetics,27 and the detection of poisonous metal ions.28 However, there have been very few reports focusing on CPs micro/nanostructures using EDTA as ligands.29
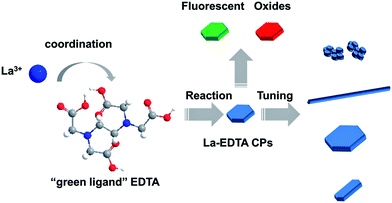
In this paper, we demonstrate the preparation of La–EDTA CPs microplates in a bottom-up manner by hydrothermal reaction of La3+ and EDTA ligands (Scheme 1). Ce–EDTA CPs microplates were also prepared and characterized here as their isologue. Multi-methods were used to elucidate the structure, composition and formation mechanism of the La–EDTA CPs. Moreover, its morphology control could be facilely achieved by altering the amount of EDTA or the total concentrations of reactants. Furthermore, the fluorescent properties of Tb3+-doped La–EDTA CPs and utilization of La–, Ce–EDTA CPs as precursors for lanthanide oxides are also discussed here. Our work offers a simple method to obtain CPs microstructures with tunable morphology and interesting properties. Besides that, low-cost, environmentally benign ligands would be beneficial for their conversion to oxides and possible mass production in the future.
Experimental section
Synthesis of La–, Ce–EDTA CPs and oxides
All chemical reagents are commercially available were and used without further purification. In a typical synthesis, 10 mmol of disodium EDTA (C10H14N2O8–2Na) was dissolved in 24 mL of H2O, then 8 mmol La(NO3)3·6H2O or Ce(NO3)3·6H2O was added to the disodium EDTA solution with continuous stirring. After several minutes, some white precipitates appeared, and the suspension obtained was then transferred into a 30 mL autoclave, sealed and heated at 160 °C for 24 h. The as-prepared Ln–EDTA CPs were washed with deionized water and ethanol successively, and finally dried at 60 °C. Lanthanide oxides were obtained by calcination of the Ln–EDTA precursors at the appropriate temperature (La2O3, 720 °C for 5 h, CeO2, 380 °C for 1.5 h).Characterization
SEM was undertaken using Shimadzu SS-550 and Hitachi Model S-4800 instruments. TEM was carried out using a Philips Tecnai F20 instrument. XRD patterns were recorded with a Rigaku D/max-2500 diffractometer. TG analysis was performed in N2 flow (20 mL min−1) using a thermogravimetric analyzer (Netzsch STA 449C). The samples were heated from 50 °C to 900 °C at a rate of 10 °C min−1. Elemental analysis (EA) data were obtained using an Elementar Vario-EL instrument. FT-IR spectra were carried out on KBr pellets using a BRUKER VECTOR 22 spectrometer. 13C CP/MAS NMR spectra were obtained using a Varian Infinity-400 instrument with a spin rate of 8–10 kHz. N2 adsorption and desorption isotherms were measured using a BELSORP miniII analyzer at 77 K. The specific surface area was calculated using the Brunauer–Emmett–Teller (BET) method.Results and discussion
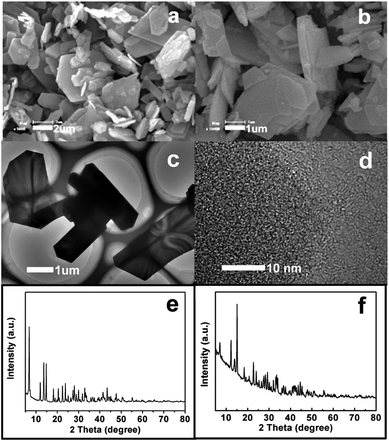
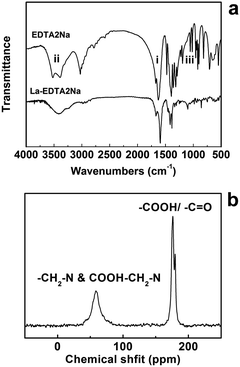
The microstructure of the as-prepared La–EDTA CPs was studied by scanning electron microscopy (SEM) and transmission electron microscopy (TEM). As shown in Fig. 1a, the main products were polygonal microplates with the size of 0.4–5 μm and thickness of ca. 200 nm, which displayed a smooth surface and regular shape, indicating their crystalline nature. The TEM image further excluded the hollow or porous structure for the La–EDTA CPs (Fig. 1c), and its powder X-ray diffraction (XRD) pattern (Fig. 1e) evidenced that it was highly crystallized via intense diffraction peaks. Under the same conditions, Ce–EDTA CPs microplates could also be produced (Fig. 1b), and their XRD pattern (Fig. 1f) was tested and resembled that of the La–EDTA CPs. However, these XRD patterns could not be assigned to known XRD reference data, and the crystalline information was difficult to be obtained due to the broken CPs under high resolution mode of TEM (Fig. 1d). Great efforts were also made for seeking their corresponding single crystals, but the particles with a proper size could hardly be obtained. Since most reported CPs micro- or nano-particles displayed unexplored crystalline structures and the single crystal structures were not often obtained, researchers have usually applied multi-analysis methods to study the compositions and structures of the CPs micro- or nano-particles.6–16,19Therefore, La–EDTA CPs were carefully characterized by Fourier transform infrared spectroscopy (FT-IR), 13C nuclear magnetic resonance (NMR), elemental analysis (EA) and thermogravimetric analysis (TGA) to investigate their chemical structure and compositions. The FT-IR spectrum of the CPs microplates displayed similar characteristics compared with pure EDTA ligands (Fig. 2a), which suggested that the reaction process caused little damage to the molecular structure of EDTA. But there were still small differences in the region of 1600–1620 cm−1 (i, very strong), 3300–3600 cm−1 (ii, strong) and 1000–1100 cm−1 (iii, medium). Firstly, the stretching band of –COO− at 1620 cm−1 for the EDTA ligands shifted to 1600 cm−1 for the CPs, indicating the coordination of La3+ and –COO−.14,15,28 Secondly, there were two obvious bands at 3495 cm−1 and 3520 cm−1 for EDTA, which could be ascribed to –OH stretching and the hydrogen bond formation in the free –COOH group.30 While for the CPs, there was only a wide band centered at ca. 3410 cm−1, which indicated that protonated carboxylic groups in EDTA might also coordinate with La3+ and thus the free –COOH groups were reduced. Thirdly, the sharp bands at 1020 cm−1 and 1080 cm−1 for EDTA could be assigned to –C–N– stretching,25 whereas in the same region, the CPs displayed a weak and wide band indicating the coordination of a tertiary amino group with La3+.
Recently, the NMR spectra have been used not only for fingerprint but also as an auxiliary tool to predict the network topology of poorly crystalline coordination polymers.31 Herein, the solid state 13C CP/MAS NMR spectrum of the La–EDTA CPs was obtained and is shown in Fig. 2b. The signal at 59 ppm could be deconvoluted to 54 and 60 ppm signals, which were assigned to –CH2 groups in the ethylenediamine or acetate part, respectively. The signal of 175 ppm with its shoulder at 180 ppm could be ascribed to carboxyl/carbonyl groups in EDTA.14 These results were consistent with the analysis by FT-IR spectra and proved again the integrity of the EDTA ligands after hydrothermal reaction. Notably, all the peaks in the NMR spectrum were broadened and overlapped, which was similar to those explained by a coordination effect with metal cations in our previous study.14 It is also reported that a change of the molecular conformation in the CPs would result the overlap of the NMR peaks.32 Therefore, we could propose that the widening and overlap of NMR peaks indicated the coordination of La3+ with EDTA ligands. EA analysis was also performed to study the chemical compositions of the CPs, providing the elemental quantities as follows: C: 26.51, H: 3.45 and N: 6.35%. Based on these results and charge balance, the empirical formula of the La–EDTA CPs could be defined as La3(EDTA)3(OH)3·H2O (EDTA = C10H14N2O82−, calcd C: 26.55, calcd H: 3.47 and calcd N: 6.20%). TGA analysis (Fig. S2a†) of La–EDTA CPs further confirmed this formula, with a weight loss of 1.20% (calcd ∼1.30%) and 60.51% (calcd ∼62.66%) for water and organic content, respectively. Here we recognized Ce–EDTA CPs as the isologue of La–EDTA CPs due to their identical XRD patterns. Moreover, their EA and TGA analysis also showed very close values to those of the La–EDTA CPs (C: 26.05, H: 3.65, N: 6.19%; weight loss: water ∼1.36%, organic part ∼60.02%, see Fig. S1b†). Therefore, we could also define the empirical formula of the Ce–EDTA CPs as Ce3(EDTA)3(OH)3·H2O (EDTA = C10H14N2O82−). Besides that, the FT-IR spectrum of Ce–EDTA was also tested and displayed similar characteristic of organic functional groups to that of the La–EDTA CPs (Fig. 2a and S2†), which further confirmed their close chemical structures.
To examine the formation mechanism of the La–EDTA microplates, tracking experiments were performed and carefully characterized by SEM and XRD. SEM observations showed that precipitation without hydrothermal treatment was dominated by irregular blocks with a size of 1–4 μm (Fig. S3a†). There were also a few microsticks among the products, which might be the initial state of the microplates. Its XRD pattern revealed that the precipitation has the same crystalline structure as that of the final product (Fig. S4a†). After reaction for 2 h, the products showed no blocks but only microplates and microsticks with the size of ∼2 μm (Fig. S3b†). With the progression of hydrothermal reaction (8 and 12 h), it was found that fewer microsticks and more microplates were produced, and the microplates became larger and more uniform (Fig. S3c and S3d†). Their XRD patterns displayed the same characteristics and were identical to that of the final product (Fig. S4b and S4c†). From these results, it is elucidated that the microplates were formed via an obvious morphology evolution process without alteration of the crystalline structure, which reminded us that they could be produced following the Ostwald ripening mechanism.14,15,28
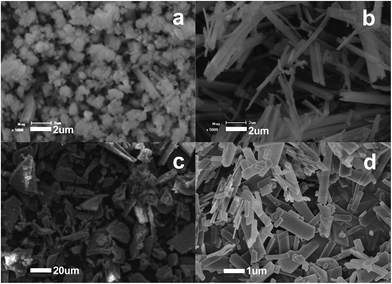
The morphology of the La–EDTA CPs could be tuned facilely by changing the amounts of reactants. Keeping the quantity of La3+ unchanged, when the EDTA was 1 mmol, the La–EDTA CPs were microclusters assembled from nanoparticles with the size of ∼1 μm (Fig. 3a). While increasing the amount of ligand to 6 mmol, the main products transformed into well-defined nanofibers with a diameter of less than 400 nm (Fig. 3b). Another sensitive parameter was the total concentration of La3+ and EDTA. When this value was 2 mmol![[thin space (1/6-em)]](https://www.rsc.org/images/entities/char_2009.gif) :
:![[thin space (1/6-em)]](https://www.rsc.org/images/entities/char_2009.gif) 2.5 mmol, the La–EDTA CPs were large microplates with a size larger than ∼20 μm (Fig. 3c). After changing this value to 4 mmol
2.5 mmol, the La–EDTA CPs were large microplates with a size larger than ∼20 μm (Fig. 3c). After changing this value to 4 mmol![[thin space (1/6-em)]](https://www.rsc.org/images/entities/char_2009.gif) :
:![[thin space (1/6-em)]](https://www.rsc.org/images/entities/char_2009.gif) 5 mmol, the microplates became smaller (length 4–5 μm/width <1 μm) and more uniform (Fig. 3d), which could be ascribed to the different nuclei-crystal growth process at lower or higher concentration of reactants.
5 mmol, the microplates became smaller (length 4–5 μm/width <1 μm) and more uniform (Fig. 3d), which could be ascribed to the different nuclei-crystal growth process at lower or higher concentration of reactants.
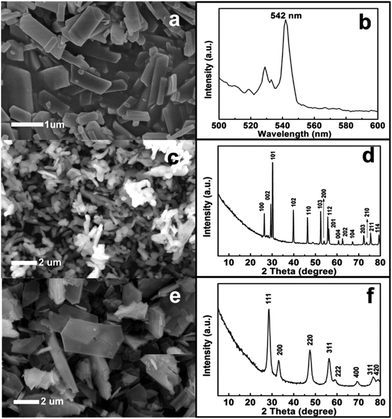
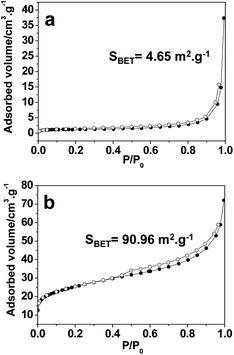
Luminescent nanomaterials have been widely used in the fields of optics, biology and medicine;33–35 in this work, we fabricated green fluorescent microplates by doping 5% Tb into the La–EDTA CPs microplates to evaluate their possibility as a potential candidate in the fields referred to above. It is shown that (Fig. 4a) the La–Tb–EDTA CPs consisted of microplates with a size of ∼1 μm, which is smaller than for pure La–EDTA CPs due to the doping effect of the Tb3+ (Fig. 1a). Its photoluminescence (PL) spectrum displayed a typical green emission at 542 nm (5D4–7F5) (Fig. 4b) without any other color emission as the disturbance. Considering the biocompatibility of EDTA,22,23 the La–Tb–EDTA CPs might be a promising material for a biological fluorescent probe in the fields of biology or medicine. Moreover, with the lanthanide–EDTA CPs as precursors, lanthanide oxide (Fig. 4c–f) materials could also be produced by calcination, including La2O3 nanorods (JCPDS no. 05-0602) obtained at high temperature (Fig. 4c and 4d) and CeO2 microplates (JCPDS no. 34-0394) at relatively low temperature (Fig. 4e and 4f). The N2 isotherms (Fig. 5a) showed that La2O3 nanorods had a relatively low BET surface area (4.65 m2 g−1), which could be ascribed to the large crystals observed in the SEM image (Fig. 4c). By contrast, the CeO2 microplates showed a larger BET surface area of 90.96 m2 g−1 (Fig. 5b), which might be derived from the nanoparticles formed during the calcination process.14 Rare earth oxides have wide applications due to their luminescent, catalytic, electric, and magnetic properties,36,37 and the low-cost EDTA ligands would be beneficial for their mass production using Ln–EDTA CPs as precursors in the future.
Conclusions
Our work demonstrated a simple method to fabricate crystalline La–EDTA CPs microplates with a tunable morphology and fluorescent property. Ce–EDTA CPs microplates could also be achieved under similar conditions as the isologue. The growth process of the La–EDTA CPs was proved to follow the Ostwald ripening mechanism, and its morphology could be facilely tuned by varying the amounts of EDTA and total concentrations of the reactants. Moreover, Tb3+-doped La–EDTA CPs microplates exhibited a typical green emission showing their potential as a fluorescent probe, and La2O3 nanorods as well as CeO2 microplates were also prepared by calcination of their corresponding CPs precursors.In the previous study, aromatic carboxylates or more complex ligands dominated the fabrication of nanoscale coordination polymers.18,38 Herein, we offered a different choice by using EDTA as a simple, inexpensive and environmentally benign substitute, which can be beneficial to some aspects, e.g. biology or conversion into oxides, and provide inspiration for more examples of new ligands from the “green” viewpoint.
Acknowledgements
We gratefully acknowledge funding for this work provided by the National Nature Sciences Foundation of China (Grant no. 21303118, 20973095, 51202159), the Seed Foundation of Tianjin University and the Jiangsu Province Key Laboratory of Fine Petrochemical Engineering.Notes and references
- B. Moulton and M. J. Zaworotko, Curr. Opin. Solid State Mater. Sci., 2002, 6, 117 CrossRef CAS.
- S. L. James, Chem. Soc. Rev., 2003, 32, 276 RSC.
- Y. G. Huang, F. L. Jiang and M. C. Hong, Coord. Chem. Rev., 2009, 253, 2814 CrossRef CAS PubMed.
- H. Uehara, S. Diring, S. Furukawa, Z. Kalay, M. Tsotsalas, M. Nakahama, K. Hirai, M. Kondo, O. Sakata and S. Kitagawa, J. Am. Chem. Soc., 2011, 133, 11932 CrossRef CAS PubMed.
- H. Wu, J. Yang, Z. M. Su, S. R. Batten and J. F. Ma, J. Am. Chem. Soc., 2011, 133, 11406 CrossRef CAS PubMed.
- M. Oh and C. A. Mirkin, Nature, 2005, 438, 651 CrossRef CAS PubMed.
- X. Sun, S. Dong and E. Wang, J. Am. Chem. Soc., 2005, 127, 13102 CrossRef CAS PubMed.
- M. Oh and C. A. Mirkin, Angew. Chem., Int. Ed., 2006, 45, 5492 CrossRef CAS PubMed.
- H. Maeda, M. Hasegawa, T. Hashimoto, T. Kakimoto, S. Nishio and T. Nakanishi, J. Am. Chem. Soc., 2006, 128, 10024 CrossRef CAS PubMed.
- W. J. Rieter, K. M. L. Taylor, H. Y. An, W. L. Lin and W. B. Lin, J. Am. Chem. Soc., 2006, 128, 9024 CrossRef CAS PubMed.
- Y. M. Jeon, J. Heo and C. A. Mirkin, J. Am. Chem. Soc., 2007, 129, 7480 CrossRef CAS PubMed.
- S. Jung and M. Oh, Angew. Chem., Int. Ed., 2008, 47, 2049 CrossRef CAS PubMed.
- W. Lu, S. S. Y. Chui, K. M. Ng and C. M. Che, Angew. Chem., Int. Ed., 2008, 47, 4568 CrossRef CAS PubMed.
- Z. R. Shen, G. J. Zhang, H. J. Zhou, P. C. Sun, B. H. Li, D. T. Ding and T. H. Chen, Adv. Mater., 2008, 20, 984 CrossRef CAS.
- Z. R. Shen, J. G. Wang, P. C. Sun, D. T. Ding and T. H. Chen, Chem. Commun., 2009, 1742 RSC.
- L. Welte, A. Calzolari, R. D. Felice, F. Zamora and J. Gómez-Herrero, Nat. Nanotechnol., 2010, 5, 110 CrossRef CAS PubMed.
- J. Choi, H. Y. Yang, H. J. Kim and S. U. Son, Angew. Chem., Int. Ed., 2010, 49, 7718 CrossRef CAS PubMed.
- R. Mas-Ballesté, J. Gómez-Herrero and F. Zamora, Chem. Soc. Rev., 2010, 39, 4220 RSC.
- R. Kaminker, R. Popovitz-Biro and M. E. van der Boom, Angew. Chem., Int. Ed., 2011, 50, 3224 CrossRef CAS PubMed.
- M. Hu, A. A. Belik, M. Imura and Y. Yamauchi, J. Am. Chem. Soc., 2013, 135, 384 CrossRef CAS PubMed.
- A. Carné-Sánchez, I. Imaz, M. Cano-Sarabia and D. Maspoch, Nat. Chem., 2013, 5, 203 CrossRef PubMed.
- D. Chatterjee, A. Mitra, A. Levina and P. A. Lay, Chem. Commun., 2008, 2864 RSC.
- A. Mondry and R. J. Janicki, Dalton Trans., 2006, 4702 RSC.
- T. Yi, S. Gao and B. Li, Polyhedron, 1998, 17, 2243 CrossRef CAS.
- V. Stavila, A. Gulea, N. Popa, S. Shova, A. Merbach, Y. A. Simonov and J. Lipkowski, Inorg. Chem. Commun., 2004, 7, 634 CrossRef CAS PubMed.
- R. S. Shukla, S. D. Bhatt, R. B. Thorat and R. V. Jasra, Appl. Catal., A, 2005, 294, 111 CrossRef CAS PubMed.
- H. Liu, L. Xu, G.-G. Gao, F.-Y. Li, Y. Y. Yang, Z.-K. Li and Y. Sun, J. Solid State Chem., 2007, 180, 1664 CrossRef CAS PubMed.
- K. Sasaki, S. Oguma, Y. Namiki and N. Ohmura, Anal. Chem., 2009, 81, 4005 CrossRef CAS PubMed.
- M. Yang, T. H. Chen, Z. Q. Wei, M. Li, H. C. Bi, Q. D. Zeng, Z. R. Shen and Y. T. Shen, CrystEngComm, 2012, 14, 3653 RSC.
- A. D. Cross, Introduction to practical infra-red spectroscopy, Butterworths, London, 2nd edn, 1964, p. 57 Search PubMed.
- N. Masciocchi, S. Galli, E. Alberti, A. Sironi, C. DiNicola, C. Pettinari and L. Pandolfo, Inorg. Chem., 2006, 45, 9064 CrossRef CAS PubMed.
- H. A. Habib, A. Hoffmann, H. A. Höppe and C. Janiak, Dalton Trans., 2009, 1742 RSC.
- A. A. Ansari and J. P. Labis, J. Mater. Chem., 2012, 22, 16649 RSC.
- F. F. Li, C. G. Li, X. M. Liu, T. Y. Bai, W. J. Dong, X. Zhang, Z. Shi and S. H. Feng, Dalton Trans., 2013, 42, 2015 RSC.
- Q. Jua and A. V. Mudring, RSC Adv., 2013, 3, 8172 RSC.
- M. Flytzani-Stephanopoulos, M. Sakbodin and Z. L. Wang, Science, 2006, 312, 1508 CrossRef CAS PubMed.
- B. Dong, Y. Doi and Y. Hinatsu, J. Alloys Compd., 2008, 453, 282 CrossRef CAS PubMed.
- A. Carné, C. Carbonell, I. Imaza and D. Maspoch, Chem. Soc. Rev., 2011, 40, 291 RSC.
Footnote |
| † Electronic supplementary information (ESI) available: SEM images, XRD patterns and TGA curves of Ln–EDTA CPs. See DOI: 10.1039/c3ra46829a |
| This journal is © The Royal Society of Chemistry 2014 |

