Colloidal synthesis of ultrathin γ-Fe2O3 nanoplates

Xiangui Dinga, Liu Baob, Jiang Jiang*b and Hongwei Gu*a
aCollege of Chemistry, Chemical Engineering and Materials Science, Soochow University, Suzhou, China 215123. E-mail: hongwei@suda.edu.cn; Fax: +86-512-6588 2030; Tel: +86-512-6288 0905
bi-Lab and Division of Nanobiomedicine, Suzhou Key Laboratory of Nanobiomedical Characterization, Suzhou Institute of Nano-tech and Nano-bionics, Chinese Academy of Sciences, Suzhou, China 215123. E-mail: jjiang2010@sinano.ac.cn; Fax: +86-512- 6260 3079; Tel: +86-512-6287 2662

Received 15th November 2013 , Accepted 22nd January 2014

First published on 23rd January 2014


Abstract

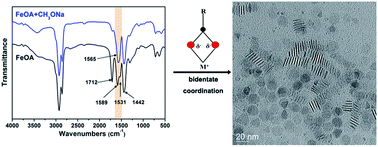
A facile method of synthesizing γ-Fe2O3 ultrathin nanoplates has been developed. These nanoplates are single crystalline and superparamagnetic at room temperature, with a thickness of only 1.4 nm. FTIR analysis has shown that the coordination mode between Fe and carboxyl group is dominated by bidentate configuration in the as prepared iron oleate complex, which is the key for producing the nanoplate morphology. By changing the reaction temperatures, the lateral size and thickness of nanoplates can be varied.

Introduction

Magnetic nanoparticles (NPs) have gained considerable attention in the past decades due to their applications in broad scientific and technological fields, such as contrast enhancer for magnetic resonance imaging (MRI),1–5 remote-controlled drug delivery,6,7 hyperthermia therapeutics,8,9 magnetic field assisted separation,10–12 and anode materials for Li-ion batteries.13,14 Among all the magnetic nanomaterials, iron oxide NPs are the most often used in biomedical application because they are stable under ambient condition, non-toxic, biocompatible and biodegradable (can be metabolized or degraded in vivo).15 Previously, iron oxide nanostructures with a variety of morphologies and structures have been successfully synthesized, including nanoparticles,16,17 nanocubes,18,19 nanorods,20,21 nanotubes,22,23 nanodisks,24,25 hollow nanospheres,26,27 nanoprism,28 nanowires,29 and nanoflowers.30 What is more, many methods of preparing iron oxide nanomaterials have been developed, including hydrothermal,31 sol–gel process,32 co-precipitation,33 reduction,34 thermal decomposition19 and so on. One of the classical methods for synthesizing monodisperse iron oxide NPs is the thermal decomposition of iron percursors such as iron acetylacetonate,35,36 iron acetates,37 or iron oleates.17,38,39 In a solvothermal approach, Hou et al. utilized oleylamine to control different growth rate of different planes, and obtained Fe3O4 nanoprisms.28 In a separate study, relatively thick (∼10 nm) iron oxide nanoplates have been obtained by Chen et al. through a kinetically controlled growth process.25

Different reaction conditions, such as temperature, solvent, ligands, and metal ions can influence the formation of iron oxide nanoparticles with different shapes, sizes, and crystal structures. For example, adding ions such as Na+ and Cl resulted the formation of iron oxide nanocubes,40 and adding trioctylammonium bromide induced growth of iron oxide octahedrons.41 Although extensive efforts have been devoted into the synthesis of iron oxide nanoparticles with different morphologies and dimensions, it is still difficult to form anisotropic γ-Fe2O3 or Fe3O4 nanocrystals due to their intrinsic cubic spinel structure, with very limited report on preparing 1-D or 2-D anisotropic magnetic nanostructures to date. By selectively passivating certain crystallographic facets using poly(vinylpyrrolidone) as ligand, for the first time, Chen et al. obtained γ-Fe2O3 nanoplates by a simple solvothermal process using ethanol solvent, which can be further reduced to Fe3O4 nanoplates using hydrazine.25 However, anisotropic iron oxide nanoplates with thickness down to less than 10 nm have not been reported yet.

Other than the reaction parameters mentioned above, iron precursor structure is another critical factor influencing its thermal decomposition as well as nucleation behaviour of forming nanoparticles. Gao and co-workers have observed that complexation between HOOC–PEG–COOH ligand and Fe(acac)3 produced a gel, which largely altered the pyrolysis behaviour of the Fe precursor.42 Bronstein et al. discussed the influence of iron oleate complex structure on iron oxide nanoparticle formation by post-synthesis treatment of the Fe oleate precursor.43 Through washing or varying the temperature under which Fe oleate complex was dried, the composition and structure of Fe oleate can be changed, which would then affect the thermal decomposition conditions and the final nanocrystals morphology.

Previously, we have observed anisotropic iron oxide nanocrystal growth by decomposing methanol treated iron oleate complexes at relative lower temperatures (200 °C) compared to commonly prepared iron oleate precursors. We proposed that iron oleate complex structure is the key factor in controlling the anisotropic iron oxide nanoparticle formation. The bridging coordination between Fe and oleate ligand, and possible existence of Fe–OH, resulted the 1-D nanorod formation, which evolved to thick and short nanoplates with elevating reaction temperatures.21

Herein, we report the preparation of iron oleate precursor in methanol, and the subsequent colloidal synthesis of 2D monodisperse ultrathin magnetic nanoplates (with aspect ratio >10) by thermal decomposition of this iron oleate precursor in high boiling point solvents. Elemental analysis and FTIR spectroscopy studies revealed that the as prepared iron oleate was different from all other reported so far, in which a dry solid with a molecular formula of C57H108FeOx was obtained, rather than a viscous or waxy solid produced normally through a two-phase method first developed by Hyeon and co-workers.39 Structural characterizations confirmed that less than 2 nm thick iron oxide nanoplates were formed with spinel structures. Combined with XPS measurement, the exact chemical phase of these nanoplates was determined to be γ-Fe2O3. We discovered that lateral size and thickness of the nanoplates can be changed by varying the reaction temperature, and the possible role of methoxide in directing the nanoplate growth is also discussed.

Experimental section

Materials

Sodium oleate ((C17H33COO)Na, >97.0%) and sodium stearate (((C17H35COO)Na), >80%) were purchased from TCI. Oleylamine (OAM, 80–90%), octadecene (ODE, 90%), iron chloride hexahydrate (FeCl3·6H2O, AR, 99%) were purchased from Aladdin reagent company. Oleic acid (OA, 90%), benzyl ether (98%), and 1-dodecanol (98%) were purchased from Sigma-Aldrich. Lauric acid sodium salt, sodium acetate anhydrous, chloroform (99%), ethanol (99.7%) were purchased from Sinopharm Chemical Reagent Co., Ltd. Methanol anhydrate (99.5%), 2-propanol (99.7%), hexane (97%) were purchased from Guangdong Guanghua Chemical Factory Co., Ltd.

Synthesis of Fe–X complex (X = oleate, stearate, laurate, acetate) complex

Iron oleate complex(I) was synthesized by the following method. Sodium oleate (9.125 g, 30 mmol) and FeCl3·6H2O (2.7 g, 10 mmol) were added to 70 mL methanol. The mixture were refluxed at 70 °C for 3 h, then a yellow brown solid was collected, and washed several times with methanol to remove NaCl. The resulting solid iron oleate complex was then used for further experiments.

The method of preparing other Fe–X complex was similar to the synthesis of Fe oleate, by simply replacing sodium oleate with sodium–X (X = stearate, laurate, acetate).

The normal iron oleate complex(II) is referring to the product obtained with commonly used two phase method. Briefly, FeCl3·6H2O (2.7 g, 10 mmol) and sodium oleate (9.125 g, 30 mmol) were added to a mixture of ethanol (20 mL), deionized water (15 mL), and hexane (35 mL). The mixture was refluxed at 70 °C for 4 h, then the upper reddish brown hexane solution containing iron–oleate complex was separated, washed three times with deionized water (10 mL), and dried in a rotary evaporator, yielding a dark reddish brown, oily iron oleate complex.

Synthesis of iron oxide nanoplates

Iron oleate complex(I) (5 mmol) was dissolved in 25 mL of 1-octadecene with the addition of sodium oleate (1.522 g, 5 mmol). Under N2 flux, this mixture was heated to 120 °C at a ramp rate of 3–5 °C min−1 and kept for 0.5 h at this temperature to eliminate H2O. After that, the mixture was heated to 210 °C at a ramp rate of 1 °C min−1 and kept for 15 h at this temperature. Finally, the mixture was heated to 240 °C and the reaction was allowed to proceed for 1 h. The resulting black brown nanocrystal solution was cooled to room temperature naturally, and 2-propanol (50 mL) was then added to precipitate the magnetic nanoparticles. After centrifugation, nanoparticles were washed with chloroform and methanol for three times, and then redispersed in chloroform or hexane for further usage.

Synthesis of iron oxide nanoplates with the aid of sodium methoxide was carried out by heating up reaction mixture containing iron oleate complex(II) (1 mmol), oleic acid (0.5 mmol), and sodium methoxide (1 mmol) in methanol, and ODE (5 mL) to the desired temperatures, with the product purification procedures the same as described above.

Characterizations

Transmission electron microscopy (TEM) and high-resolution transmission electron microscopy (HRTEM) images were taken by FEI Technai G2 S-Twin at an accelerating voltage of 200 kV. A sample for TEM analysis was prepared by placing 1–2 drops of the nanocrystal dispersed in chloroform on a carbon-coated copper grid and letting it dry in air. X-Ray diffraction (XRD) analyses were performed using a Bruker D8 Advance X-ray diffractometer (with Cu Kα radiation at 0.15418 nm). X-ray photoelectron spectra (XPS) analysis was conducted on a PHI 5000 VersaProbe spectrometer (ULVACPHI) using Al Ka radiation (1486.71 eV). UV-Vis absorption spectra were recorded on a Lambda-25 spectrometer (PerkinElmer Inc., USA). Fourier transform infrared (FTIR) spectra were recorded on a Nicolet spectrometer (Nicolet 6700, Thermo Fisher Scientific). Thermogravimetric (TG) and differential thermal analysis (DTA) spectra were recorded on a Thermogravimetry/Differential Thermal Analyzer (Exstar TG/DTA6200, SII Nanotechnology Inc.). The magnetic properties of the samples were characterized by using a vibrating sample magnetometer. Elemental analysis on Fe oleate was carried out using ICP (Inductively Coupled Plasma Emission Spectrometer, 710-ES, Varian) and Elemental Analyzer (Vario EL III, Elementar).

Results and discussion

Synthesis and characterization of iron oleate complexes

Different from iron oleate(II) synthesized in an oil-water two phase method, the iron oleate(I) prepared in methanol was yellow brown solid with a rubber like feel, indicating that structurally distinct iron oleate complex was formed in methanol, and a color photograph of the final dry product is shown in Fig. 1A. To investigate the structure of this iron oleate complex, FTIR, elemental analysis, and TG were performed.
image file: c3ra46728g-f1.tif
Fig. 1 (A) A color photograph of iron oleate(I) synthesized in methanol. (B) Schematic drawings of the four different coordination modes of metal atom with carboxyl group. (C) FTIR spectrum of (a) pure oleic acid, (b) normal iron oleate(II) synthesized in two-phase system, and (c) as prepared iron oleate(I) in methanol.

FTIR spectroscopy is a powerful method to probe the metal-carboxylate coordination, as the position and separation of the ν(COO) bands can be used to infer the carboxylate coordination mode. As indicated by previous studies, there are four different coordination modes between metal and carboxyl functional groups (illustrated schematically in Fig. 1B): ionic, unidentate, bidentate, and bridging.44 As shown in Fig. 1C, the peak at 609 cm−1 corresponds to the Fe–O stretching mode.45 The FTIR spectrum of Fe oleate(I) synthesized in methanol contains several strong bands in the ν(COO) region: 1539 and 1438 cm−1, while that of OA contains two strong bands at 1712 and 1438 cm−1 (trace (c) and (a) in Fig. 1C). The observed separation between two ν(COO) bands at 1539 and 1438 cm−1 is 101 cm−1, revealing the as synthesized iron oleate(I) was dominated by bidentate coordination mode.43 It was also seen that ν(C[double bond, length as m-dash]O) peak at 1712 cm−1 disappeared, indicating that there had no free OA in the iron oleate complex(I) when Fe oleate was synthesized in methanol. The strong 1049 cm−1 band is assigned to C–O stretching in primary alcohol, and the broad 3444 cm−1 band is attributed to OH group association, both indicating the existence of methanol in Fe oleate complex(I). Commonly prepared Fe oleate complex(II) was shown for comparison (trace (b) in Fig. 1C), and the peaks at 1531, 1600, and 1712 cm−1 indicate that there had free OA in the normal iron oleate complex, with both bidentate and bridging coordination between the carboxyl group and Fe atom.21,43

Elemental analysis shows that the percentages of C, H, Fe contained in the as prepared iron oleate(I) were 54.791%, 8.644%, 4.700% respectively, and the weight percentage of O was back calculated to be 31.860%. That is, the molecular formula of the synthesized iron oleate(I) can be written as C57H108FeOx (x is ∼12). However, there might be contamination of small amount of NaCl in the synthesized iron oleate precursors, which hinders determination of the exact molecular formula. Assuming molar ratio of Fe to oleate ligand is 1[thin space (1/6-em)]:[thin space (1/6-em)]3, the normally formed iron oleate(II) would have a theoretical molecular formula of C54H99FeO6, such that there would exist approximately 3 methoxyl groups per Fe atom in the synthesized iron oleate(I) complex. The detailed structure of this complex is not known, other than that the dominating coordination mode between Fe and carboxyl groups is bidentate as opposed to both bidentate and bridging coordination as revealed in the FTIR study (Fig. 1C).

The Fe oleate complex(I) was further characterized by TG analysis. Fig. 2 shows the TG and derivative TG (DTG) traces of Fe oleate. The DTG trace of Fe oleate shows a small weight loss peak at 71 °C that could be attributed to the removal of some low boiling point substances such as methanol. The second peak with an onset starting from 170 °C to 250 °C can be assigned to first oleate group dissociation and nuclei formation stage.39 The third peak at 323 °C is due to the removal of remaining oleate groups, while 380 °C is the temperature where Fe oleate precursor was completely decomposed, in accordance with previous report.43 For the normal iron oleate, Hyeon and co-workers have shown that its thermal decomposition started at 272 °C from oleic acid either free or weakly bound to Fe(III) ion.46 From the above results, it is clear that iron oleate(I) synthesized in methanol with dominating bidentate coordination between iron and carboxyl group, had a lower thermal decomposition temperature compared to iron oleate(II) prepared following published procedures.


image file: c3ra46728g-f2.tif
Fig. 2 TG and DTG traces of iron oleate(I), with a prominent weight loss peak centered at 210 °C observed.

Synthesis of iron oxide nanoplates

Based on the above TG/DTG studies on iron oleate precursor, the iron oxide nanocrystal synthesis was conducted by its thermal decomposition in the temperature range from 170 °C to 320 °C. Fig. 3A and B are transmission electron microscopy (TEM) images of the resulting iron oxide nanocrystals synthesized with the reaction temperature set to 240 °C. The synthesized iron oxide displayed a low image contrast with lateral dimension of 20 ± 2 nm (Fig. 3A, statistics shown in Fig. 3C), indicating possible anisotropic geometry. TEM image of these hexagonally shaped iron oxide nanocrystals stacked together and standing on their edges confirmed their plate-like morphology, with their thickness at only 1.4 nm (Fig. 3B and inset), the uniform spacing of 2–3 nm between the stacks agrees well with the molecular length of the oleate group. Fig. 3D shows The HRTEM image of the iron oxide nanoplates, indicating that these thin nanoplates are single crystals. The measured interplanar spacing of 0.297 nm was close to the interfringe distance of the {220} plane of the iron oxide spinel structure. X-ray diffraction pattern of these nanoplates supported the formation of inverse spinel iron oxide nanocrystals (Fig. 3E). The exact chemical phase was determined using XPS, as XRD cannot differentiate γ-Fe2O3 and Fe3O4 phase due to line width broadening of nanocrystals. Fig. 3F shows the core-level XPS spectrum in Fe 2p region, where the main peaks at 710.9 eV and 724.4 eV correspond to 2p3/2 and 2p1/2 core levels of iron oxide respectively. The 2p1/2 peak position, along with the satellite peaks at around 718.0 eV and 732.0 eV, indicating the valence state is Fe3+ only,47 that is, the as synthesized nanoplates are maghemite (γ-Fe2O3) rather than magnetite (Fe3O4) nanocrystals. These γ-Fe2O3 nanoplates displayed a saturation magnetization of 27.6 emu g−1 at room temperature, measured by a vibrating sample magnetometer (Fig. S1A). Based on the net weight of iron oxide content determined by TG result (Fig. S1B), the saturation magnetization value of pure iron oxide nanoplates is calculated to be 55.6 emu g−1, which is still lower than the bulk value (∼70 emu g−1), due to surface spin canting effect of small nanoparticles. Compared to the ∼10 nm thick maghemite nanoplates synthesized by Chen et al., the thinner nanoplates obtained in this study exhibited weaker magnetization. This is also manifested in their self-assembly behaviour, as larger nanoplates with stronger magnetization properties can easily form extensive chain-like structures with face to face stacking,25 which is not observed for our nanoplates with relatively weak magnetic properties.
image file: c3ra46728g-f3.tif
Fig. 3 (A) and (B) TEM images of iron oxide nanoplates, inset in (B) shows the HRTEM of the nanoplates standing on their edges; (C) histogram of the nanoplates lateral dimensions presented in (A); (D) HRTEM image of the nanoplates; (E) X-ray diffraction data of iron oxide nanoplates synthesized at 240 °C; (F) core-level X-ray photoelectron spectrum of nanoplates in the Fe 2p region, indicating the nanoplates are γ-Fe2O3.

The sizes of iron oxide nanoplates can be changed by varying the reaction temperatures. As shown in Fig. S2, nanoplates with lateral dimension of 6 nm were made when reaction temperature was set to 170 °C and kept for 2 h (Fig. S2A), while nanoplates with lateral size of 13 nm (Fig. S2B) and 20 nm (Fig. 3A) were obtained when the reaction temperature was increased to 210 and 240 °C, respectively. When the reaction temperature was further increased to the solvent boiling point of 320 °C, the nanoplate thickness increased to 4–5 nm, and the morphology of nanoplates became less uniform (Fig. S2C). Coupled with the TG results shown in Fig. 2, it is clear that the iron oleate complex(I) thermal decomposition and nucleation started at temperature as low as 170 °C, and in the window of 170 °C to 250 °C, the temperature played a role in dictating the final nanoplate sizes. Further increasing the reaction temperature beyond this window, possible ripening process induced decreased surface energy and structure anisotropy, resulting thicker nanoplates with reduced lateral dimensions.

Effect of solvent and Fe precursor on iron oxide formation

The effect of solvent and Fe precursors on iron oxide nanoparticle formation was also investigated. Fig. 4 shows typical TEM images of iron oxide nanostructure synthesized in different solvents and by thermal decomposing different Fe precursors. The solvent used for Fe oleate thermal decomposition was usually non-coordinating in nature, such as ODE and other long chain alkanes. When oleylamine was used as solvent, nanoplates mostly in trigonal shape were observed (Fig. 4A), while using benzyl ether produced nanocrystals similar to the case of ODE (Fig. 4B). Dramatic difference was observed when 1-dodecanol was used as solvent, as only nanoparticles were found under TEM examination (Fig. 4C). This might be due to possible interaction of dodecanol with the Fe oleate complex, changing iron carboxylate coordination modes, thus disrupting the nanoplate formation. This is confirmed by FTIR study of iron oleate treated with little amount of 1-dodecanol (0.2 mmol iron oleate with 250 μL dodecanol), and the result shows that a new peak at 1589 cm−1 appeared after addition of dodecanol (Fig. S3), indicating both bidentate and bridging coordination between the carboxyl group and Fe atom.43
image file: c3ra46728g-f4.tif
Fig. 4 TEM images (A–C) showing solvent effect on iron oxide nanocrystal morphology with iron oxide formed in (A) oleylamine, (B) benzyl ether, and (C) 1-dodecanol, respectively. (D–F) Influence of Fe precursors on thermal decomposition, with TEM images showing the resulting nanocrystals using (D) iron acetate, (E) iron laurate, and (F) iron stearate, respectively.

Other Fe carboxylate complexes were prepared by replacing sodium oleate with sodium acetate, sodium laurate, and sodium stearate respectively. When Fe acetate was used, only irregular nanoparticles were formed (Fig. 4D). Thicker nanoplates were obtained by using Fe laurate precursors (Fig. 4E). When Fe oleate was replaced by Fe stearate, apart from small nanoparticles, nanoplates and their coalesced products were also observed (Fig. 4F). We speculate that with longer alkyl chain coordinating with Fe atom, there is higher possibility to form the nanoplate morphology by the templating effect, due to van der Waals interaction and steric hindrance between neighboring chains. The various reaction condition and parameters leading to the different final product morphologies are summarised in Table 1.

Table 1 Reaction conditions and the resulting nanoparticle morphologies
Precursor Solvent Reaction temperature Main product morphorlogy
a 4–5 nm as compared to 1–2 nm thick at lower reaction temperatures.
Iron oleate(I) ODE 170 °C ∼6 nm nanoplates
    210 °C ∼13 nm nanoplates
    240 °C ∼20 nm nanoplates
    320 °C 15–20 nm thicker nanoplatesa
  Benzyl ether 240 °C Hexagon nanoplates
  Oleylamine   Triangle nanoplates
  1-Dodecanol   Small spherical particles
Iron acetate ODE 240 °C Irregular nanoparticles
Iron laurate     Thick nanoplates
Iron stearate     Small nanoparticles + coalesced nanoplates


Effect of sodium methoxide on iron oxide nanoplate formation

It is interesting that there were no nanoplates observed when sodium oleate was replaced by oleic acid using iron oleate(I) as precursor (Fig. 5A). In previous studies on synthesizing iron oxide nanorods,21,48 it was proposed that oleic ligand was directing the anisotropic nanostructure formation, and the additional oleic acid might disrupt this templating effect. A recent report by Bao and co-workers indicated that a by-product from iron oleate precursor preparation, sodium ethoxide, facilitated the formation of nanoplates,24 although the exact mechanism is not known. In our system, we have used methanol in the iron oleate precursor synthesis, and this lets us wonder whether sodium methoxide existed as a by-product in the synthesized iron oleate. To check the possible role of sodium methoxide, we performed the following experiment. Iron oleate(I) was first dissolved in chloroform by ultrasonic treatment, which then underwent centrifugation to remove NaCl salt. Using this purified iron oleate precursor, we investigated the influence of sodium methoxide on final nanocrystal morphology. As shown in Fig. 5B, the addition of sodium methoxide clearly induced the formation of thin iron oxide nanoplates, with slightly worse monodispersity. In comparison, thermal decomposition of this iron oleate precursor without addition of any surfactant such as OA or sodium oleate produced thick nanoplates with irregular morphologies as shown in Fig. S4. Similarly, using normally prepared iron oleate(II) as precursor, spherical nanoparticles were produced, while growth of thin nanoplates was induced when sodium methoxide was added again (Fig. S5).
image file: c3ra46728g-f5.tif
Fig. 5 TEM images of iron oxide nanocrystals produced by thermal decomposition of iron oleate(I) with (A) OA only and (B) with OA and sodium methoxide added in the reaction mixture.

Sodium methoxide and ethoxide are well known strong base in organic chemistry. As thermal decomposition of iron oleate complex involves bond breaking between Fe and carboxyl group and subsequent Fe–O–Fe bond formation,49 sodium methoxide may served as a nucleophile attacking the carboxyl group, yielding Fe–O˙ free radicals and facilitating Fe–O–Fe iron oxide cluster formation. However, based on our observed strong effect of oleic acid (Fig. 5A) and 1-dodecanol (Fig. 4C) on disrupting nanoplates formation, simple contamination of sodium methoxide during the iron precursor synthesis step cannot be the actual reason. We believe that the specific structural characteristics of bidentate bonding between Fe and carboxyl group is the key for the nanoplates formation, which is favoured in the presence of base. Base or proton scavenger has been observed to induce anisotropic growth of iron oxide nanorods, in which case a clear bidentate coordination mode was also observed from the FTIR spectrum.32 This hypothesis is proved by FTIR analysis of normal iron oleate(II) treated with sodium methoxide. Shown in Fig. 6, FTIR spectrum of the hexane solution of the as prepared iron oleate(II) is plotted along with that treated with 1[thin space (1/6-em)]:[thin space (1/6-em)]1 molar ratio sodium methoxide. ν(C[double bond, length as m-dash]O) peak at 1712 cm−1 disappeared after sodium methoxide was addeded in, indicating disappearance of free oleic acid. Moreover, the 1589 cm−1 and 1531 cm−1 bands, which is the result of band splitting of νas(COO) vibration mode due to bridging and bidendate coordination, changed to a single peak at 1565 cm−1, suggesting the bidentate coordination mode between carboxyl group and Fe after sodium methoxide treatment. Thus, we conclude that iron oxide nanoplate formation is mainly determined by iron oleate precursor structures. Compared to sodium methoxide, a caustic strong base highly sensitive to moisture, the iron oleate(I) we have synthesized is much easier to handle with better stability.


image file: c3ra46728g-f6.tif
Fig. 6 FTIR spectra of iron oleate(II) (lower black line) and that treated with sodium methoxide (upper blue line). Obvious changes such as disappearance of 1712 cm−1 peak, and the 1589 cm−1 and 1531 cm−1 doublet changed to a single peak at 1565 cm−1 were observed, indicating disappearance of free oleic acid and the change of coordination mode between carboxyl group and Fe after sodium methoxide treatment.

Fe2O3 and Fe3O4 nanostructures have been regarded as one of the potential anode candidates for Li-ion batteries, and thin nanoplate morphology can reduce Li+ ion diffusion path, thus enhancing its rate performance.13 We expect the synthesized ultrathin nanoplates have great potential serving as high performance anode materials for Li-ion batteries after surface treatment and interface engineering.14

Conclusions

We have developed a facile method of synthesizing anisotropic single crystalline superparamagnetic γ-Fe2O3 ultrathin nanoplates. The key is to prepare iron oleate complex in pure methanol, resulting dominating bidentate coordination between Fe and carboxyl group as demonstrated by FTIR analysis. FTIR and elemental analysis indicated there were about 3 methoxyl groups per Fe atom in the synthesized iron oleate(I) complex. The lateral sizes and thickness of nanoplates can be varied by changing the reaction conditions such as temperature. Influence of possible sodium methoxide on the nanoplate formation was investigated, and the strong base induced iron oleate complex structural change is possibly the reason for the observed nanoplate formation.

Acknowledgements

J.J. acknowledges financial support from the “Hundred Talents” program of Chinese Academy of Sciences, and Natural Science Foundation of China (NSFC) (no. 21175148); H.W. Gu acknowledges financial support from the Natural Science Foundation of China (no. 21003092) and the Key Project of Chinese Ministry of Education (no. 211064).

Notes and references

  1. B. H. Kim, N. Lee, H. Kim, K. An, Y. I. Park, Y. Choi, K. Shin, Y. Lee, S. G. Kwon, H. B. Na, J.-G. Park, T.-Y. Ahn, Y.-W. Kim, W. K. Moon, S. H. Choi and T. Hyeon, J. Am. Chem. Soc., 2011, 133, 12624–12631 CrossRef CAS PubMed .
  2. Y. M. Huh, Y. W. Jun, H. T. Song, S. Kim, J. S. Choi, J. H. Lee, S. Yoon, K. S. Kim, J. S. Shin, J. S. Suh and J. Cheon, J. Am. Chem. Soc., 2005, 127, 12387–12391 CrossRef CAS PubMed .
  3. N. A. Frey, S. Peng, K. Cheng and S. Sun, Chem. Soc. Rev., 2009, 38, 2532–2542 RSC .
  4. Z. J. Zhou, D. T. Huang, J. F. Bao, Q. L. Chen, G. Liu, Z. Chen, X. Y. Chen and J. H. Gao, Adv. Mater., 2012, 24, 6223–6228 CrossRef CAS PubMed .
  5. Z. Zhao, Z. Zhou, J. Bao, Z. Wang, J. Hu, X. Chi, K. Ni, R. Wang, X. Chen, Z. Chen and J. Gao, Nat. Commun., 2013, 4, 2266 Search PubMed .
  6. C. Xu, B. Wang and S. Sun, J. Am. Chem. Soc., 2009, 131, 4216–4217 CrossRef CAS PubMed .
  7. J. H. Lee, K. Lee, S. H. Moon, Y. Lee, T. G. Park and J. Cheon, Angew. Chem., Int. Ed., 2009, 48, 4174–4179 CrossRef CAS PubMed .
  8. M. Chastellain, A. Petri, A. Gupta, K. V. Rao and H. Hofmann, Adv. Eng. Mater., 2004, 6, 235–241 CrossRef CAS .
  9. J. T. Jang, H. Nah, J. H. Lee, S. H. Moon, M. G. Kim and J. Cheon, Angew. Chem., Int. Ed., 2009, 48, 1234–1238 CrossRef CAS PubMed .
  10. B. Yoza, M. Matsumoto and T. Matsunaga, J. Biotechnol., 2002, 94, 217–224 CrossRef CAS .
  11. H. W. Gu, K. M. Xu, C. J. Xu and B. Xu, Chem. Commun., 2006, 941–949 RSC .
  12. A. Sinha and N. R. Jana, Chem. Commun., 2012, 48, 9272–9274 RSC .
  13. J. Lu, Q. Peng, Z. Wang, C. Nan, L. Li and Y. Li, J. Mater. Chem. A, 2013, 1, 5232–5237 CAS .
  14. C. Lei, F. Han, D. Li, W.-C. Li, Q. Sun, X.-Q. Zhang and A.-H. Lu, Nanoscale, 2013, 5, 1168–1175 RSC .
  15. K. Briley-Saebo, A. Bjørnerud, D. Grant, H. Ahlstrom, T. Berg and G. M. Kindberg, Cell Tissue Res., 2004, 316, 315–323 CrossRef CAS PubMed .
  16. X. Chen, L. Li, X. Sun, Y. Liu, B. Luo, C. Wang, Y. Bao, H. Xu and H. Peng, Angew. Chem., Int. Ed., 2011, 50, 5486–5489 CrossRef CAS PubMed .
  17. N. R. Jana, Y. F. Chen and X. G. Peng, Chem. Mater., 2004, 16, 3931–3935 CrossRef CAS .
  18. A. Shavel, B. Rodríguez-González, M. Spasova, M. Farle and L. M. Liz-Marzán, Adv. Funct. Mater., 2007, 17, 3870–3876 CrossRef CAS .
  19. M. V. Kovalenko, M. I. Bodnarchuk, R. T. Lechner, G. Hesser, F. Schaffler and W. Heiss, J. Am. Chem. Soc., 2007, 129, 6352–6353 CrossRef CAS PubMed .
  20. H. Sun, B. Chen, X. Jiao, Z. Jiang, Z. Qin and D. Chen, J. Phys. Chem. C, 2012, 116, 5476–5481 CAS .
  21. L. Bao, W.-L. Low, J. Jiang and J. Y. Ying, J. Mater. Chem., 2012, 22, 7117–7120 RSC .
  22. K. Pitzschel, J. M. M. Moreno, J. Escrig, O. Albrecht, K. Nielsch and J. Bachmann, ACS Nano, 2009, 3, 3463–3468 CrossRef CAS PubMed .
  23. C.-J. Jia, L.-D. Sun, Z.-G. Yan, L.-P. You, F. Luo, X.-D. Han, Y.-C. Pang, Z. Zhang and C.-H. Yan, Angew. Chem., Int. Ed., 2005, 44, 4328–4333 CrossRef CAS PubMed .
  24. S. Palchoudhury, Y. Xu, A. Rushdi, R. A. Holler and Y. Bao, Chem. Commun., 2012, 48, 10499–10501 RSC .
  25. J. Lu, X. Jiao, D. Chen and W. Li, J. Phys. Chem. C, 2009, 113, 4012–4017 CAS .
  26. P. Hu, L. Yu, A. Zuo, C. Guo and F. Yuan, J. Phys. Chem. C, 2008, 113, 900–906 Search PubMed .
  27. S. Peng and S. Sun, Angew. Chem., Int. Ed., 2007, 46, 4155–4158 CrossRef CAS PubMed .
  28. Y. Zeng, R. Hao, B. Xing, Y. Hou and Z. Xu, Chem. Commun., 2010, 46, 3920–3922 RSC .
  29. S. Mathur, S. Barth, U. Werner, F. Hernandez-Ramirez and A. Romano-Rodriguez, Adv. Mater., 2008, 20, 1550–1554 CrossRef CAS .
  30. F. Hu, K. W. MacRenaris, E. A. Waters, E. A. Schultz-Sikma, A. L. Eckermann and T. J. Meade, Chem. Commun., 2010, 46, 73–75 RSC .
  31. X. Liang, X. Wang, J. Zhuang, Y. Chen, D. Wang and Y. Li, Adv. Funct. Mater., 2006, 16, 1805–1813 CrossRef CAS .
  32. K. Woo, H. J. Lee, J. P. Ahn and Y. S. Park, Adv. Mater., 2003, 15, 1761–1764 CrossRef CAS .
  33. Z. Li, B. Tan, M. Allix, A. I. Cooper and M. J. Rosseinsky, Small, 2008, 4, 231–239 CrossRef CAS PubMed .
  34. V. Yathindranath, L. Rebbouh, D. F. Moore, D. W. Miller, J. van Lierop and T. Hegmann, Adv. Funct. Mater., 2011, 21, 1457–1464 CrossRef CAS .
  35. S. H. Sun, H. Zeng, D. B. Robinson, S. Raoux, P. M. Rice, S. X. Wang and G. X. Li, J. Am. Chem. Soc., 2004, 126, 273–279 CrossRef CAS PubMed .
  36. Z. Li, H. Chen, H. Bao and M. Gao, Chem. Mater., 2004, 16, 1391–1393 CrossRef CAS .
  37. F. X. Redl, C. T. Black, G. C. Papaefthymiou, R. L. Sandstrom, M. Yin, H. Zeng, C. B. Murray and S. P. O'Brien, J. Am. Chem. Soc., 2004, 126, 14583–14599 CrossRef CAS PubMed .
  38. W. W. Yu, J. C. Falkner, C. T. Yavuz and V. L. Colvin, Chem. Commun., 2004, 2306–2307 RSC .
  39. J. Park, K. An, Y. Hwang, J.-G. Park, H.-J. Noh, J.-Y. Kim, J.-H. Park, N.-M. Hwang and T. Hyeon, Nat. Mater., 2004, 3, 891–895 CrossRef CAS PubMed .
  40. Z. Xu, C. Shen, Y. Tian, X. Shi and H. J. Gao, Nanoscale, 2010, 2, 1027–1032 RSC .
  41. A. Shavel, B. Rodríguez-González, J. Pacifico, M. Spasova, M. Farle and L. M. Liz-Marzán, Chem. Mater., 2009, 21, 1326–1332 CrossRef CAS .
  42. Q. Jia, J. Zeng, R. Qiao, L. Jing, L. Peng, F. Gu and M. Gao, J. Am. Chem. Soc., 2011, 133, 19512–19523 CrossRef CAS PubMed .
  43. L. M. Bronstein, X. Huang, J. Retrum, A. Schmucker, M. Pink, B. D. Stein and B. Dragnea, Chem. Mater., 2007, 19, 3624–3632 CrossRef CAS .
  44. Y. Lu and J. D. Miller, J. Colloid Interface Sci., 2002, 256, 41–52 CrossRef CAS .
  45. A. G. Roca, J. F. Marco, M. d. P. Morales and C. J. Serna, J. Phys. Chem. C, 2007, 111, 18577–18584 CAS .
  46. S. G. Kwon, Y. Piao, J. Park, S. Angappane, Y. Jo, N. M. Hwang, J. G. Park and T. Hyeon, J. Am. Chem. Soc., 2007, 129, 12571–12584 CrossRef CAS PubMed .
  47. T. Fujii, F. M. F. de Groot, G. A. Sawatzky, F. C. Voogt, T. Hibma and K. Okada, Phys. Rev. B: Condens. Matter Mater. Phys., 1999, 59, 3195–3202 CrossRef CAS .
  48. S. Palchoudhury, W. An, Y. L. Xu, Y. Qin, Z. T. Zhang, N. Chopra, R. A. Holler, C. H. Turner and Y. P. Bao, Nano Lett., 2011, 11, 1141–1146 CrossRef CAS PubMed .
  49. J. Lynch, J. Zhuang, T. Wang, D. LaMontagne, H. Wu and Y. C. Cao, J. Am. Chem. Soc., 2011, 133, 12664–12674 CrossRef CAS PubMed .

Footnote

Electronic supplementary information (ESI) available: Magnetization measurement and TG analysis of synthesized iron oxide nanoplates, TEM images of nanoplates synthesized under different reaction temperatures, γ-Fe2O3 morphologies synthesized with iron oleate(I), and iron oxide morphologies synthesized with iron oleate(II) and sodium methoxide. See DOI: 10.1039/c3ra46728g

This journal is © The Royal Society of Chemistry 2014
Click here to see how this site uses Cookies. View our privacy policy here.