Temperature dependent 2D self-assembled motif transition of copper–phthalocyanine derivates at air/HOPG interface: an STM study

Yamin Wangab, Hongbo Xuab, HuanHuan Wanga, Shouzhu Lia, Wei Gan*a and Qunhui Yuan*a
aLaboratory of Environmental Science and Technology, Xinjiang Technical Institute of Physics & Chemistry, Key Laboratory of Functional Materials and Devices for Special Environments, Chinese Academy of Sciences, Urumqi 830011, China. E-mail: ganwei@ms.xjb.ac.cn; yuanqh@ms.xjb.ac.cn; Fax: +86-991-3838957; Tel: +86-991-3677875
bUniversity of Chinese Academy of Sciences, Beijing, 100049, P. R. China

Received 13th November 2013 , Accepted 23rd April 2014

First published on 23rd April 2014


Abstract

It is known that copper(II) 2,3,9,10,16,17,23,24-octakis(octyloxy)-29H,31H-phthalocyanine (CuPcOC8) molecules can self-organize on highly oriented pyrolytic graphite and form both quartic symmetry structures with relatively low molecular packing density and hexagonal symmetry structures with high packing density. However, the mechanism of the formation of the two types of molecular adlayers, and the tunability of this metal phthalocyanine film in ambient atmosphere has not been discussed. In this work, by increasing the temperature during the self-assembly process, or applying an annealing treatment to the self-assembled film, the transition of the self-assembled structure from quartic to hexagonal symmetry was observed. With images obtained with scanning tunnelling microscopy under different conditions and statistical analysis of the ratios of the quartic to hexagonal domain areas, this work revealed the existence of an energy barrier between the quartic and the hexagonal structures. The hexagonal phase corresponds to a thermodynamically stable state while the quartic phase is kinetically favorable but thermodynamically metastable. It was also found that with high enough temperature and given enough time, uniform ordered assembly motifs of CuPcOC8 molecules on a large scale can be obtained.

Introduction

Metal phthalocyanines (MePcs) and their derivatives have attracted remarkable interest because of their reliable thermal and chemical stabilities, as well as their fine-tunable electronic, optical, and optoelectronic properties exerted by various central metal ions.1–3 For successful incorporation of the MePc films into devices, appropriate control of the spatial arrangement of every MePc building block is required because it directly affects the performance of the devices.4–6 Therefore, a deep understanding of the formation of MePc arrays on solid surfaces is an important prerequisite for fabricating and property tailoring of functional devices.4–7

The molecular self-assembly process on surfaces is essentially controlled by the balance between molecule–molecule and molecule–substrate interactions.4–6,8–12 Fine adjustment of intermolecular interactions can generally be achieved by changing the non-covalent forces, such as van der Waals interactions, hydrogen bonds, metal–ligand coordination, π–π stacking, and dipole–dipole interactions, while molecule–substrate interactions can be tuned by the addition of side groups and the use of different substrates.4–6,8–10,12–14 Environmental factors such as light, temperature, solvent, electric/magnetic fields and the addition of blending components are also expected to be important controlling factors for both molecule–molecule and molecule–substrate interactions.4,15–22 The dependence of the adlayer structures on environmental factors could be complicated, and sometimes polymorphs and phase transitions can be observed because of the effect of both kinetic and thermodynamical factors.19,20 However, the investigation on self-assembled structures with multiple phases, as well as the transition between them, also provides the opportunity to control the morphology of surface adsorbed layers, which would benefit the development of molecular devices.20

Among these approaches, temperature adjustment has been found to be a convenient way to tune the assembly structure.15,18–20,23 To perform these fine adjustments, scanning tunnelling microscopy (STM) with sub angstrom resolution has naturally been relied on.4–6,8–10,13–20,23 For example, Gutzler et al. observed a temperature-controlled opening-closing switch of nanopores formed with 1,3,5-tris(4-carboxyphenyl)benzene (BTB) molecules at carboxylic acid/graphite interface.24 Blunt et al. also reported bidirectional phase transitions between linear and porous phases by heating or cooling treatment of self-assembled network on highly oriented pyrolytic graphite (HOPG) surface.20 As a comparison, Li et al. reported the self-assembly of stilbenoid dendrimers and an irreversible phase transition from hexagonal structures to parallelogram nanostructures by thermal annealing treatment.15 Irreversible phase transformations of hexakis-(n-dodecyl)-peri-hexabenzocoronene (HBC-C12) with the increment of temperature have also been demonstrated by Fichou's group.18 These studies show that the manipulation of surface structures by temperature adjustment is of great interest in the fabrication of nanostructures with self-assembly methods.

As for MePcs, the growth and characterization of their molecular adlayers on various substrates, such as Au(111), Au(100), Ag(111), Pb(111)/Si(111), Cu(111), Cu(100), HOPG, TiO2, NaCl, InAs, and InSb, have been intensively studied experimentally and/or theoretically.4–6,9,13,14,25–41 There are also reports of different adsorption structures and their evolutions owing to the change of the environmental factors, including those performed under ultra-high vacuum (UHV) conditions,4,6,26,28,30,32–35,40 or on the surface of electrodes.9,29,36 Among these studies, the good tunability exerted by metal ions and side groups of MePcs has been commonly taken into consideration due to their versatility in the adjustment of molecule–molecule and molecule–substrate interactions. In many of these works, HOPG was chosen as the substrate owing to the large-scale atomically flat terraces of the basal plane of graphite, which are readily available for the adsorption of the alkyl-substituted molecules. In addition, the outstanding electrical property of HOPG would naturally be a benefit for its potential integration into devices.42,43

Bai et al. firstly used eight-carbon alkyl chains connected to copper and zinc phthalocyanine molecules to form ordered adlayers on HOPG in ambient atmosphere at room temperature.13,14 After that, quite some papers have been published on the formation of ordered adlayers on surfaces/interfaces with alkyl-substituted phthalocyanines.31,42–45 For example, molecular level manipulation on the functional double or triple-decker complex containing phthalocyanine derivative with STM tips under room temperature were demonstrated for their potential application in molecular switch or molecular motor.42,43 It has been observed that copper(II) 2,3,9,10,16,17,23,24-octakis(octyloxy)-29H,31H-phthalocyanine (CuPcOC8) molecules can self-organize into 4-fold and 6-fold symmetry on HOPG or Au(111) surface.13,14,31

However, the reason for the formation of the two types of mixed molecular adlayers, and the tunability of MePc adlayers in ambient atmosphere has not been discussed. In this study, we present our observations of the motif transition of CuPcOC8 adlayers from 4-fold symmetry to 6-fold symmetry on the HOPG surface. Furthermore, we adjusted the experiment condition by increasing the sample temperature or adding an annealing process after the self-assembly process, and obtained uniform adlayers with only hexagonal symmetry structures.

Experimental details

Copper(II) 2,3,9,10,16,17,23,24-octakis(octyloxy)-29H,31H-phthalocyanine (CuPcOC8, 95%) was purchased from Aldrich and used without further purification. CuPcOC8 was dissolved in HPLC grade toluene (99.8%, Saifurui, China) to form a sample solution with concentration around 10−5 M. The assemblies were formed by deposition of 7 μL sample solution on a freshly cleaved HOPG surface (HOPG, ZYB grade, Bruker).

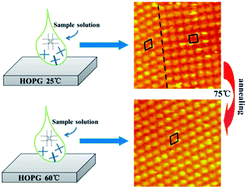
The temperature of the self-assembling process or a post thermal annealing treatment was used to control or modify the self-assembled adlayer, as shown in Scheme 1, using a constant-temperature-oven (±0.5 °C). The STM investigations were performed with a Nanoscope IIId scanning probe microscopy (Bruker, USA) system under ambient conditions. Mechanically cut Pt/Ir wires (90/10) were used as the STM tips. All of the STM images were obtained under constant current mode with a high-resolution scanner and presented without further processing, except for necessary image flattening.


image file: c3ra46651e-s1.tif
Scheme 1 Schematic diagrams of the annealing treatment (A) and direct deposition (B) at controlled temperature (for example, 55 °C), respectively. The samples were all cooled to room temperature before the STM observations.

Result and discussion

CuPcOC8 molecules have been reported to form arrangements with coexisting phases bearing quartic and hexagonal symmetries in the monolayer on the HOPG surface.14 In our experiment, both quartic (Phase-I) and hexagonal (Phase-II) domains can also be observed when CuPcOC8 molecules assembled on the HOPG at room temperature, which is kept at 25 ± 1 °C, as shown in Fig. 1B. The measured parameters of the quartic and hexagonal unit cells outlined by the square or rhombus in the high resolution images (Fig. 1C and D) where a = b = 2.6 ± 0.1 nm, with θ = 90° ± 5° and a = 2.6 ± 0.1 nm, b = 2.7 ± 0.1 nm, with θ = 65° ± 5°, respectively, which agree well with the result reported by Bai's group.14
image file: c3ra46651e-f1.tif
Fig. 1 (A) Molecular structure of CuPcOC8. (B) Typical large-scale STM image of the coexistence of quartic and hexagonal domains in the CuPcOC8 adlayer on the HOPG surface. (V = 722.7 mV, I = 254.9 pA) Dashed lines indicate the boundaries between domains with different symmetries. The squares and parallelograms indicate quartic and hexagonal unit cells, respectively. High-resolution STM images of (C) the quartic symmetry structure and (D) the hexagonal symmetry structure, respectively (V = 700.0 mV, I = 248.2 pA).

Furthermore, we observed a new structural transition process from quartic to hexagonal symmetry, as shown in Fig. 2A–D. From the STM images consecutively obtained with a CuPcOC8 film freshly prepared at room temperature, the initially dominant quartic-phase partly changed into the hexagonal-phase during the imaging process. The growth of hexagonal domains and the merge of molecules into ordered domains near the boundary, which were commonly described as Ostwald ripening,8,46–48 can originate from different reasons. Firstly, we need to consider if this change is caused by the scanning tunnelling tips.48


image file: c3ra46651e-f2.tif
Fig. 2 (A–D) Structure transition of CuPcOC8 film at room temperature. STM images were consecutively taken with no pause using an acquisition rate of 60 s per image. (V = 700.0 mV, I = 300.0 pA) Dashed lines and arrows highlight the regions where the structure transition occurred. Circled bright spot indicates that the STM images are captured in the same area, although slightly shift can be observed during the experiment.

To consider this possibility, freshly prepared CuPcOC8 films were first checked with STM and then stored at room temperature. The films were imaged again after storing for 3 days. Since we could not make observations on exactly the same areas, multiple samples were checked and the obtained images were analyzed following the reported statistic method,10,20 as detailed in the ESI. With this method, since data from multiple experiments instead of a single one were analyzed, more reliable conclusions can be made.10,20 The ratio of the area of the quartic domains to the area of the hexagonal domains (Qa/Ha) was calculated and the results were listed in Table 1. For the calculation of each Qa/Ha ratio, at least 10 STM images from more than 3 samples were used (see the ESI for typical images of each case).

Table 1 Ratios of integrated areas of the quartic domains to the hexagonal domains obtained under different experiment conditions. S and A indicate whether the temperature was controlled in self-assembly or annealing process, respectively
  25 °C, S 30 min 25 °C, S 3 days 55 °C, A 30 min 75 °C, A 30 min 55 °C, S 30 min 60 °C, S 5 min
Qa/Ha 3.0 ± 0.3 1.3 ± 0.2 0.8 ± 0.2 0 ± 0.1 0.3 ± 0.2 0 ± 0.1


From the ratios in Table 1, the HOPG surface is mainly covered by quartic domains in the freshly prepared films, with a Qa/Ha ratio as high as 3.0. However, this structure is not the most stable structure, because it partly changes into the hexagonal structure after 3 days. This result proves that the structure transition shown in Fig. 2 is most probably because of the energy requirement of the molecular adlayer itself rather than the STM tip effect. This can also be supported by the fact that the structure transition observed during the imaging process being rare, with only one observation in more than 10 times experiments at room temperature. Therefore, we believe that the phase transition process observed in this figure is not because of the STM tip effect.

Although the phase transition is mostly from quartic to hexagonal domain, a few exception were also observed. In the area around the central rectangle in Fig. 2B, a small amount of the hexagonal domain changes into quartic domain between Fig. 2B and C. This observation shows the complexity of the localized energetics at this solid surface. Although it is hard to determine the origin of the energy differences at different locations on this assembled film, this might be because of tiny defects on the HOPG surface or twisted orientation/packing of CuPcOC8 molecules.

To better understand the energetics of the two phases in CuPcOC8 films, thermal annealing treatments were applied after the films had formed at room temperature. After annealed for 30 min at 55 °C, the area of hexagonal arrangements increases significantly at the expense of the quartic domains. Statistical analysis gives a Qa/Ha ratio of 0.8 (Table 1). Furthermore, with an annealing process at a higher temperatures (75 °C), the quartic arrays disappear, leading to a Qa/Ha ratio of zero.

Based on the above observation, we attempted to obtain a two-dimensional self-assembled motif in a controlled manner by adjusting the self-assembly temperature. From Table 1, when the deposition of the sample solution to the HOPG surface was controlled at 55 °C, the Qa/Ha ratio was less than the ratio obtained with the annealing treatment at the same temperature. Moreover, at a higher deposition temperature (60 °C), the CuPcOC8 molecules form uniform hexagonal symmetry domains in 5 min. Furthermore, the film forms an ordered monolayer with only a few defects, as shown in Fig. 3 (also see Fig. S7 in ESI).


image file: c3ra46651e-f3.tif
Fig. 3 Typical STM image of the freshly prepared CuPcOC8 adlayer formed at 60 °C on the HOPG surface (V = 687.9 mV, I = 300.0 pA).

The temperature effect also suggests an energy barrier between the two types of surface arrangements. Upon increasing the annealing temperature, the thermal energy can be transferred to the adsorbed molecules, providing sufficient kinetic energy to overcome the energy barrier. Since the phase transition can also occur at room temperature, this energy barrier is most probably at the kBT level, as has been discussed by Piot et al.49

In all the annealing experiments, once the energy barrier of the transition from metastable quartic phase to thermally stable hexagonal phase was overcome by increasing the temperature, the formed hexagonal phase was stable in both high temperature and room temperature conditions. This indicates an irreversible trend for the phase transition to the close-packed hexagonal structure with lower potential energy. In addition, further increasing the annealing temperature (90 °C) did not result in a new structure. The unit cell parameters measured after this treatment were identical with those obtained at room temperature (Fig. 4). This indicates that the observed hexagonal phase is a thermodynamically stable state in the potential energy diagram. The initial Qa/Ha ratio as high as 3.0 also indicates that the thermodynamically preferred hexagonal symmetry structure is kinetically less accessible, while the metastable quartic arrays is more easily obtained. A similar effect has also been observed and discussed by Gutzler et al.46


image file: c3ra46651e-f4.tif
Fig. 4 STM images of hexagonal domains formed at (A) room temperature (25 °C, V = 722.7 mV, I = 254.9 pA) and (B) high temperature (90 °C, V = 722.7 mV, I = 254.9 pA), respectively. The dashed line in (A) separates the quartic domain from the hexagonal domain. Parallelograms and squares indicate the unit cells of the hexagonal and quartic symmetry structures, respectively.

In order to obtain more information about the energy barrier of the phase transition process, we also performed the following experiments: freshly prepared CuPcOC8 films assembled at 25 °C were annealed at 55 °C for different time periods and imaged with STM. The change of the Qa/Ha ratio with annealing time was obtained to analyze the phase transition process. It was found that the measured Qa/Ha ratio initially decreases with annealing time, and then levels off, as shown in Table 2. The same experiments were also performed with the annealing temperature changed to 35 °C. As shown in Table 2, the same trend was also obtained. We believe this observation indicates another type of complexity of the energetics of the assembled CuPcOC8 film. For part of the quartic phase with a relatively low phase transition energy barrier that can be overcome by increasing the temperature to a certain value, the phase transition was completed within a few minutes. For the other part of the quartic phase with a relatively high phase transition energy barrier, phase transition could not occur unless a higher annealing temperature was applied. We believe that this situation may exist in dynamic processes in other systems. The self-assembled CuPcOC8 film on the HOPG surface provides a good example for the observation of these potential energy differences.

Table 2 Ratios of the quartic domain areas to the hexagonal domains obtained with CuPcOC8 films annealed for different time periods. The data from films with no annealing treatment are also listed for comparison (0 min)
  0 min 10 min 20 min 30 min
Qa/Ha after 55 °C annealing 3.0 ± 0.3 0.8 ± 0.2 0.7 ± 0.2 0.8 ± 0.2
Qa/Ha after 35 °C annealing 3.0 ± 0.3 1.0 ± 0.2 1.0 ± 0.2 1.2 ± 0.2


STM can only give localized snapshots of the CuPcOC8 films. In our analysis the data obtained from more than 10 STM images from multiple samples were averaged to obtain a general trend of the phase transition, as well as the energy difference of different phases on the surface. The results obtained with this method were sufficient for the drawing of the conclusions mentioned above. However, more detailed information about the phase transition process, such as the temperature dependent transition rate, was not able to be measured with our experimental setup. STM imaging with in situ temperature control stage is required for such an analysis.

This irreversible trend of the phase transition is similar to the observations reported by Fichou's group.18,49 In their reports, the observed irreversible phase transition of HBC-C12 molecules on a HOPG surface or Au(111) surface was explained by the energy requirement of the surface assembly structures. As mentioned in the introduction, Gutzler et al. and Blunt et al. reported another type of phase transition with the change of the temperature.20,24 They pointed out that the change of entropy plays an important role in the potential energy variation between the different phases in the surface adlayers. Hence, the change of the temperature causes the change of the energy diagram, i.e., the relative stability of different phases, and results in a switchable phase transition. Ahn et al. also used a crossed energy–concentration diagram to interpret the observation of different assemblies from one building block at the liquid/solid interface.17 The most stable phase of the amide amphiphile assembly film varied with the change of the molecular concentration used in the self-assembly process.

Most of the reports on phase modulation of self-assembled adlayers were performed at the liquid/solid interface, where the solvent effect may play an important role in the phase transition processes.20,24 In contrast, the observations in this work show that phase modulation of CuPcOC8 films can be performed during the assembly process when the solution is just deposited on the HOPG surface, or at the air/solid interface after the formation of the assembled layer. With proper selection of temperature, uniform assembly motifs with only the hexagonal symmetry phase can be obtained with either liquid/solid, or air/solid systems. Therefore, this observation could also provide insight into the convenient control of self-assembly films of other functional molecules.

The diverse assembled structure observed at room temperature and the uniform 6-fold symmetric structure obtained at higher temperature makes an interesting comparison with previous studies, in which lowering the molecular mobility on the surfaces by attaching long alkyl chains was used to form ordered surface monolayers of conjugated π-systems like phthalocyanine or porphyrin.8,13,14 In another work reported by Hipps group, temperature lower than a criteria (55 °C) was found to be a threshold for the formation of a good molecular layer when the Au(111) surface was in contact with coronene–heptanoic acid solution, indicating that the control of the surface adlayer must be limited to a specific temperature range.50 This work suggests that there is still “much to be learned” in the manipulation of the surface structure at elevated temperature with STM. Stabel et al. also suggested the use of a cooling process to distinguish different surface assembly structures of anthrone derivatives on graphite, because STM observations implied an oscillation between two different forms owing to their very small energy difference.8 These studies, together with the results in this study, show that control of the molecular mobility on the surface, either increase or decrease it, may play an important role in achieving certain structure of the surface assembly.

It has been shown that self-assembly structures of molecules with relatively long alkyl chains, which are known to have strong molecule–substrate interactions, can be controlled by a small change of temperature, either at a liquid–solid20 or an air–solid interface as observed in this work. The adsorption energy of these molecules to the HOPG surface is normally considered to be very high (the side chains alone can add at least 50 kcal mol−1 additional desorption energy for CuPcOC8 on the HOPG surface13). The phase transition observed in our experiments should not be caused by desorption/re-adsorption of CuPcOC8 molecules. The growth of hexagonal phase from quartic phase at boundary area is a more plausible explanation. Furthermore, differing from phase modulation performed in UHV chambers or solutions, in this work, the phase transition process takes place after the molecular films have formed and dried in ambient atmosphere. For these reasons, the structure transition we observed most possibly originates from in situ orientation/structure adjustment rather than a desorption/re-adsorption process, which is essentially different from the Ostwald ripening process in emulsion systems, where the resolving of small droplets and growing of larger droplets is thought to be a main cause.

Conclusions

In summary, self-assembly of CuPcOC8 molecules on the HOPG surface was further studied with STM. For this well studied system, a new structural transition from 4-fold to 6-fold symmetry at room temperature was observed. The temperature dependent behavior of this structural transition was also studied. This work reveals the existence of a kinetic energy barrier between the two potential energy minima of the two structures. This energy barrier can be overcome either by a post-annealing treatment or by increasing the self-assembly temperature. The obtaining of uniform ordered assembly motifs of CuPcOC8 molecules in large scale with proper selection of temperature can also shed light on the preparation of self-assembled film with other functional molecules, and the usage of them in the devices.

Acknowledgements

The authors acknowledge the financial support from the ‘One Hundred Talents Project Foundation Program’ and the ‘Western Light Program’ from Chinese Academy of Sciences, National Natural Science Foundation of China (21203244) and the ‘Young Creative Sci-Tech Talents Cultivation Project of Xinjiang Uyghur Autonomous Region (2013711012, 2013711016)’.

Notes and references

  1. P. Peumans, A. Yakimov and S. R. Forrest, J. Appl. Phys., 2003, 93, 3693 CrossRef CAS PubMed.
  2. G. de la Torre, P. Vázquez, F. Agulló-López and T. Torres, Chem. Rev., 2004, 104, 3723 CrossRef CAS PubMed.
  3. H. Imahori, T. Umeyama and S. Ito, Acc. Chem. Res., 2009, 42, 1809 CrossRef CAS PubMed.
  4. K. W. Hipps, L. Scudiero, D. E. Barlow and M. P. Cooke, J. Am. Chem. Soc., 2002, 124, 2126 CrossRef CAS PubMed.
  5. S. Yoshimoto and N. Kobayashi, in Functional Phthalocyanine Molecular Materials, ed. J. Jiang, 2010, vol. 135, p. 137 Search PubMed.
  6. Y. Wang, K. Wu, J. Kroeger and R. Berndt, AIP Adv., 2012, 2, 041402 CrossRef PubMed.
  7. J. H. Park, J. E. Royer, E. Chagarov, T. Kaufman-Osborn, M. Edmonds, T. Kent, S. Lee, W. C. Trogler and A. C. Kummel, J. Am. Chem. Soc., 2013, 135, 14600 CrossRef CAS PubMed.
  8. A. Stabel, R. Heinz, J. P. Rabe, G. Wegner, F. C. Deschryver, D. Corens, W. Dehaen and C. Siiling, J. Phys. Chem., 1995, 99, 8690 CrossRef CAS.
  9. K. Suto, S. Yoshimoto and K. Itaya, Langmuir, 2006, 22, 10766 CrossRef CAS PubMed.
  10. T. Chen, W.-H. Yang, D. Wang and L.-J. Wan, Nat. Commun., 2013, 4, 1389 CrossRef PubMed.
  11. D. Bonifazi, S. Mohnani and A. Llanes-Pallas, Chem.–Eur. J., 2009, 15, 7004 CrossRef CAS PubMed.
  12. D. M. Cyr, B. Venkataraman and G. W. Flynn, Chem. Mater., 1996, 8, 1600 CrossRef CAS.
  13. X. H. Qiu, C. Wang, S. X. Yin, Q. D. Zeng, B. Xu and C. L. Bai, J. Phys. Chem. B, 2000, 104, 3570 CrossRef CAS.
  14. X. H. Qiu, C. Wang, Q. D. Zeng, B. Xu, S. X. Yin, H. N. Wang, S. D. Xu and C. L. Bai, J. Am. Chem. Soc., 2000, 122, 5550 CrossRef CAS.
  15. C. J. Li, Q. D. Zeng, Y. H. Liu, L. J. Wan, C. Wang, C. R. Wang and C. L. Bai, ChemPhysChem, 2003, 4, 857 CrossRef CAS PubMed.
  16. T. Takami, U. Mazur and K. W. Hipps, J. Phys. Chem. C, 2009, 113, 17479 CAS.
  17. S. Ahn and A. J. Matzger, J. Am. Chem. Soc., 2010, 132, 11364 CrossRef CAS PubMed.
  18. C. Marie, F. Silly, L. Tortech, K. Müllen and D. Fichou, ACS Nano, 2010, 4, 1288 CrossRef CAS PubMed.
  19. A. Bellec, C. Arrigoni, G. Schull, L. Douillard, C. Fiorini-Debuisschert, F. Mathevet, D. Kreher, A.-J. Attias and F. Charra, J. Chem. Phys., 2011, 134, 124702 CrossRef PubMed.
  20. M. O. Blunt, J. Adisoejoso, K. Tahara, K. Katayama, M. Van der Auweraer, Y. Tobe and S. De Feyter, J. Am. Chem. Soc., 2013, 135, 12068 CrossRef CAS PubMed.
  21. S. Sadegh Hassani, Y.-G. Kim and E. Borguet, Langmuir, 2011, 27, 14828 CrossRef CAS PubMed.
  22. L. Scudiero, K. W. Hipps and D. E. Barlow, J. Phys. Chem. B, 2003, 107, 2903 CrossRef CAS.
  23. Y. Li, C. Liu, Y. Xie, X. Li, X. Li, X. Fan, K. Deng, Q. Zeng and C. Wang, Phys. Chem. Chem. Phys., 2013, 15, 125 RSC.
  24. R. Gutzler, T. Sirtl, J. F. Dienstmaier, K. Mahata, W. M. Heckl, M. Schmittel and M. Lackinger, J. Am. Chem. Soc., 2010, 132, 5084 CrossRef CAS PubMed.
  25. P. Smolenyak, R. Peterson, K. Nebesny, M. Törker, D. F. O'Brien and N. R. Armstrong, J. Am. Chem. Soc., 1999, 121, 8628 CrossRef CAS.
  26. M. Lackinger and M. Hietschold, Surf. Sci., 2002, 520, L619 CrossRef CAS.
  27. J. Y. Grand, T. Kunstmann, D. Hoffmann, A. Haas, M. Dietsche, J. Seifritz and R. Moller, Surf. Sci., 1996, 366, 403 CrossRef CAS.
  28. N. Papageorgiou, E. Salomon, T. Angot, J.-M. Layet, L. Giovanelli and G. Le Lay, Prog. Surf. Sci., 2004, 77, 139 CrossRef CAS PubMed.
  29. S. Yoshimoto, N. Higa and K. Itaya, J. Am. Chem. Soc., 2004, 126, 8540 CrossRef CAS PubMed.
  30. J. Ahlund, J. Schnadt, K. Nilson, E. Gothelid, J. Schiessling, F. Besenbacher, N. Martensson and C. Puglia, Surf. Sci., 2007, 601, 3661 CrossRef PubMed.
  31. L. Wang, L. Ou-Yang and S.-L. Yau, Microsc. Res. Tech., 2008, 71, 20 CrossRef CAS PubMed.
  32. L. Zhang, Z. Cheng, Q. Huan, X. He, X. Lin, L. Gao, Z. Deng, N. Jiang, Q. Liu, S. Du, H. Guo and H.-j. Gao, J. Phys. Chem. C, 2011, 115, 10791 CAS.
  33. C. Stadler, S. Hansen, I. Kroger, C. Kumpf and E. Umbach, Nat. Phys., 2009, 5, 153 CrossRef CAS.
  34. S. D. Wang, X. Dong, C. S. Lee and S. T. Lee, J. Phys. Chem. B, 2004, 108, 1529 CrossRef CAS.
  35. S. Berner, M. de Wild, L. Ramoino, S. Ivan, A. Baratoff, H. J. Guntherodt, H. Suzuki, D. Schlettwein and T. A. Jung, Phys. Rev. B, 2003, 68, 115410 CrossRef.
  36. S. Yoshimoto, E. Tsutsumi, K. Suto, Y. Honda and K. Itaya, Chem. Phys., 2005, 319, 147 CrossRef CAS PubMed.
  37. X. H. Kong, K. Deng, Y. L. Yang, Q. D. Zeng and C. Wang, J. Phys. Chem. C, 2007, 111, 17382 CAS.
  38. V. Oison, M. Koudia, M. Abel and L. Porte, Phys. Rev. B, 2007, 75, 035428 CrossRef.
  39. J. D. Baran, J. A. Larsson, R. A. J. Woolley, Y. Cong, P. J. Moriarty, A. A. Cafolla, K. Schulte and V. R. Dhanak, Phys. Rev. B, 2010, 81, 075413 CrossRef.
  40. A. Scarfato, S. H. Chang, S. Kuck, J. Brede, G. Hoffmann and R. Wiesendanger, Surf. Sci., 2008, 602, 677 CrossRef CAS PubMed.
  41. Z. Li, B. Li, J. Yang and J. G. Hou, Acc. Chem. Res., 2010, 43, 954 CrossRef CAS PubMed.
  42. S.-B. Lei, K. Deng, Y.-L. Yang, Q.-D. Zeng, C. Wang and J.-Z. Jiang, Nano Lett., 2008, 8, 1836 CrossRef CAS PubMed.
  43. T. Takami, T. Ye, B. K. Pathem, D. P. Arnold, K.-i. Sugiura, Y. Bian, J. Jiang and P. S. Weiss, J. Am. Chem. Soc., 2010, 132, 16460 CrossRef CAS PubMed.
  44. S. Lei, Y. Yang, Q. Zeng and C. Wang, Langmuir, 2011, 27, 3496 CrossRef CAS PubMed.
  45. K. Miyake, Y. Hori, T. Ikeda, M. Asakawa, T. Shimizu and S. Sasaki, Langmuir, 2008, 24, 4708 CrossRef CAS PubMed.
  46. R. Gutzler, L. Cardenas and F. Rosei, Chem. Sci., 2011, 2, 2290 RSC.
  47. K. Kim, K. E. Plass and A. J. Matzger, Langmuir, 2003, 19, 7149 CrossRef CAS.
  48. A. Stabel, R. Heinz, F. C. Deschryver and J. P. Rabe, J. Phys. Chem., 1995, 99, 505 CrossRef.
  49. L. Piot, A. Marchenko, J. Wu, K. Müllen and D. Fichou, J. Am. Chem. Soc., 2005, 127, 16245 CrossRef CAS PubMed.
  50. W. A. English and K. W. Hipps, J. Phys. Chem. C, 2008, 112, 2026 CAS.

Footnote

Electronic supplementary information (ESI) available: Typical STM images obtained under different conditions and the detailed procedure on the calculation of the Qa/Ha ratios shown in Tables 1 and 2. See DOI: 10.1039/c3ra46651e

This journal is © The Royal Society of Chemistry 2014
Click here to see how this site uses Cookies. View our privacy policy here.