Hepatotoxicity induced by ZnO quantum dots in mice

Yanjie Yanga, Tong Zhaoa, Ting Chenga, Jianmin Shenb, Xiaoyan Liua, Bianfei Yua, Shuangyu Lvb and Haixia Zhang*a
aKey Laboratory of Nonferrous Metal Chemistry and Resources Utilization of Gansu Province, Lanzhou University, Lanzhou 730000, China. E-mail: zhanghx@lzu.edu.cn; Fax: +86-931-8912582; Tel: +86-931-8912510
bInstitute of Biochemistry and Molecular Biology, School of Life Sciences, Lanzhou University, Lanzhou, Gansu 730000, China

Received 11th November 2013 , Accepted 11th December 2013

First published on 17th December 2013


Abstract

ZnO quantum dots (QDs) with unique optical properties are potential useful tools for biological labeling and biosensing. With the increasing use of ZnO QDs, the toxicity evaluation of ZnO QDs is urgent. In this study, the hepatotoxicity including serum aminotransferases (ALT and AST), antioxidant enzymes (CAT, GSH-Px and SOD), lipid peroxidation and ultrastructure were evaluated after consecutive intravenous injection of ZnO QDs and ZnO QDs–PEG for 7 days in mice. Both ZnO QDs and ZnO QDs–PEG did not affect the coefficient of liver and the levels of serum aminotransferases. The antioxidant enzymes and lipid peroxidation had significant change after injecting 5 mg kg−1 ZnO QDs in 24 h, but all of these parameters returned to control levels in 28 days. ZnO QDs–PEG had a less harmful effect on antioxidant enzymes and malondialdehyde than ZnO QDs at the same dose. According to the results of hepatocyte ultrastructure, both ZnO QDs and ZnO QDs–PEG were located in the mitochondrion and induced nuclear malformation in 24 h. The ultrastructure of hepatocyte was as normal as of the control group in 28 days and ZnO QDs were mainly trapped in the mitochondrion while ZnO QDs–PEG mainly accumulated in the lysosomes. These findings would be helpful for wide use of quantum dots based bioimaging and biomedical applications in the future.
1. Introduction

Quantum dots (QDs) are a class of semiconductor nanoparticles with size smaller than 30 nm.1 QDs display unique optical properties in terms of absorption and emission bandwidths, quantum yield, and resistance to photobleaching.2 Compared with conventional organic fluorophores and fluorescent proteins, QDs are more suitable for use as imaging probes in biology, such as cellular labeling and tissue imaging.2,3 The biggest challenge for QDs application is their toxicity, which is caused mainly by their chemical composition of metal atoms (e.g., cadmium, mercury, lead, arsenic).4 Due to absent of toxic metal elements, ZnO QDs are superior to other QDs in the field of biomedical applications. Zhao et al. synthesized ZnO QDs as fluorescent probe for detecting dopamine with high selectivity and sensitivity.5 Matsuyama et al. reported ZnO QDs coating with silica and biotin could accomplish cell-labeling in nerve cells.6

Due to the growth of production and application of nanoparticles, the probability of human contact with nanomaterials in occupational and environmental settings are increasing,7 which is potentially serious health hazard. Aboulaich et al. reported that ZnO QDs were low cytotoxicity and good biocompatibility in Escherichia coli bacterial cells8 and Yu et al. demonstrated that they had no adverse effect on BGC 803 cells even at the concentration of 1 mM.9 But Zhang et al. found that ZnO QDs selectively inhibited the growth of human cancer cells (leukemia K562, K562/A02 cells and HepG2 cells).10 Because in vitro cultures can not provide accurate data for the complex living system, it is important to assess the systemic toxicity of nanoparticles before their application in pharmaceutics and medicine.11–13 There are fewer studies about the toxicity of ZnO QDs in vivo. In our previous reports,14 we studied the biodistribution and toxicity of aqueous synthesized ZnS and ZnO quantum dots in mice. It was found that ZnO QDs were mainly trapped in the lung and liver, and could not change hematology, clinical biochemistry or tissue morphology. These conclusions were consistent with the toxicity results of aqueous synthesized CdTe QDs with different size15 and CdSe–ZnS QDs with different coating.13 The low toxicity of QDs may be owing to the relative insensitivity of these parameters,16 so other mechanisms should be assessed in the toxicology study of ZnO QDs.

Nanomaterials could induce the production of reactive oxygen species (ROS) in the treated cells owing to their tiny size, high surface reactivity and large specific surface area (e.g., C60 fullerenes, single wall carbon nanotubes, and quantum dots).17 Oxidative stress is an imbalance between the intracellular production of free radicals and the cellular protective antioxidants18,19 which is the most appealing paradigm for detecting the adverse effects of different nanoparticles at the molecular and cellular level.17 ZnO nanoparticles have been reported to induce oxidative stress in cell lines (>30 nm),20 zebrafish embryos (50–100 nm)21 and in the liver of mice (272 nm).7 Particle size could affect the toxicity by influencing the body responds and the cellular uptake mode.11 The effect of ZnO QDs (5.4 nm) with smaller size on oxidative stress is not known.

Liver as reticuloendothelial system can clear the circulating nanoparticles from intravenous exposure route by resident phagocytes.22 Liver is the main organ to metabolize foreign compounds23 and is the primary exposure site to toxins. Many nanoparticles were mainly cumulated in the liver, such as quantum dots,13,15 mesoporous silica nanoparticles,24 Au nanoparticles,25,26 etc. On the basis of previous works,13,15 here we focus on the hepatotoxicity induced by repeated intravenous injection of ZnO QDs and ZnO QDs–PEG in 24 hours and 28 days. Hemolysis in vitro, body weight, the coefficient of liver, serum aminotransferases (ALT and AST), antioxidant enzymes (CAT, GSH-Px and SOD), lipid peroxidation and the ultrastructure of hepatic cell were investigated in the work.

2. Materials and methods

2.1 Chemicals

The synthesis and characterization of ZnO QDs and ZnO QDs–PEG were the same as described in our previous work.14 The average diameter of ZnO QDs and ZnO QDs–PEG in water were 5.4 and 94.0 nm from dynamic light scattering measurements (BI-200SM, Brookhaven, USA). Glutaraldehyde was obtained from Sinopharm Chemical Reagent Co. Ltd (Shanghai, China). Normal saline (NS, 0.9%) was supplied by Double-crane Pharmaceutical Co. Ltd (Beijing, China). Deionized water was prepared from Millipore (Bedford, MA, USA). Other reagents used were of analytical grade.

2.2 Hemolysis assay in vitro

Briefly, two milliliter of human blood (Gansu Blood Center, China) was centrifuged (H-2050 R, Xiang Yi, China) at 3500 rpm for 10 min to discard serum. Then, the red blood cells (RBCs) were washed at least five times using NS and diluted to a 10-fold volume. We used deionized water as positive (+) and NS as negative controls (−), and the final absorbance value of the positive control supernatant was approximate 0.5 at 576 nm (Puxi TU-1810 visible spectrophotometer, Beijing, China). 0.2 mL of RBCs was added in a series of 0.8 mL ZnO QDs solutions, making the final concentrations of ZnO QDs were 20, 50, 125, 250, 500, 1000 μg mL−1. After shaking gently, the mixtures were kept standstill at room temperature for three hours. Centrifugation and the absorbance value of supernatant were recorded at 576 nm. All of the experiments were repeated three times and the percent of RBCs hemolysis was calculated from the following formula:
Hemolysis% = (absorbance of sample − absorbance of negative control)/(absorbance of positive control − absorbance of negative control) × 100%

2.3 Animal treatment

Male kunming mice (22 ± 1 g) were purchased from the Experimental Animal Center of Lanzhou University (Lanzhou, China). The animal were maintained under a 12 h light–dark cycle, 22 ± 1 °C and 50–60% relative humidity with free access to food and water. All the experiments were conducted according to the protocols approved by the Ethics Committee of Animal Experiments of Lanzhou University.

For the experiment, animals were randomly divided into four groups of twelve mice each: (a) control, (b) 1 mg kg−1 ZnO QDs, (c) 5 mg kg−1 ZnO QDs, and (d) 5 mg kg−1 ZnO QDs–PEG. Mice were injected via tail veins for 7 consecutive days with a total volume of 100 μL samples per mouse. Body weights were recorded every other day during the treatment and experiment. After injection, six animals were sacrificed at the time point of 24 hours or 28 days. The liver was carefully removed, weighed, and prepared liver extracts as soon as possible after dissection to avoid drying.

2.4 Coefficient of liver

After weighing the body and liver at 24 h and 28 days, the coefficient of liver was calculated as the ratio of liver (wet weight, mg) to body weight (g).

2.5 Quantification of serum ALT and AST activity

Serum was obtained by centrifugation of the blood at 3500 rpm for 10 min, and stored at −20 °C until measurement. The aminotransferase in serum including alanine aminotransferase (ALT) and aspartate aminotransferase (AST) were determined colorimetrically at 505 nm by the formation of a highly colored hydrazone with 2,4-dinitrophenylhydrazine in alkaline solution according to kit protocols (Nanjing Jiancheng Bioengineering Institute, China).

2.6 Preparation of liver tissue homogenates

About 500 mg of liver tissues were rinsed with cold normal saline and then homogenized using glass homogenizer in NS (liver mass[thin space (1/6-em)]:[thin space (1/6-em)]NS = 1[thin space (1/6-em)]:[thin space (1/6-em)]9). The liver homogenates were centrifuged at 2500 rpm for 10 min at 4 °C. The supernatant was collected and used for analysis of the activities of antioxidant enzymes and the lipid peroxidation.

2.7 Determination of oxidative stress related enzymes in liver tissue

The activities of the following enzymes were determined according to the manufacturer's protocol (Nanjing Jiancheng Bioengineering Institute, China).
2.7.1 Catalase (CAT). The hydrogen peroxide (H2O2) was catalyzed by CAT for 1 min at 37 °C, and then terminated by forming stable complexes with ammonium molybdate. The CAT level was calculated by recording the visible absorbance of these complexes at 405 nm.
2.7.2 Glutathione peroxidase (GSH-Px). 1 mmol L−1 GSH were incubated with liver extracts for 5 min at 37 °C, and then centrifuged for 10 min at 4000 rpm. The GSH in the supernatant reduced 5, 5′-dithiobis 2-nitrobenzoic acid (DTNB) to 2-nitro-5-thiobenzoate anion (NTP). The GSH-Px level was calculated by recording the absorbance of NTP at 412 nm. Non-enzymatic control was used to eliminate the interference from endogenous GSH.
2.7.3 Superoxide dismutase (SOD). Xanthine/xanthine oxidase system produces free radicals of superoxide anions (O2˙) which can oxidize hydroxylamine into nitrous salt. The function of SOD was specifically inhibiting superoxide anion-free radicals and controlling the amount of nitrous salt. Chromogenic reagent was added to form a mauve complex with nitrous salt and determined at 550 nm.

2.8 Assay of lipid peroxidation levels in liver

The concentration of malondialdehyde (MDA, lipid peroxidation end product) was widely used to show lipid peroxidation level, and determined according to kit protocols (Nanjing Jiancheng Bioengineering Institute, China). Liver extracts reacted with thiobarbituric acid under boiling water bath for 80 min, and then the mixtures were centrifuged at 4000 rpm for 10 min. The OD values of these supernatant were determined at 532 nm.

2.9 Observation of hepatocyte ultrastructure

Liver was fixed using 3% glutaraldehyde in 1/15 phosphate buffer (pH 7.4) for 48 h at 4 °C, and post-fixed for 1 h in 1% osmium tetraoxide. The tissue was dehydrated progressively in concentrated ethanol and embedded in Epon 812. Ultrathin sections were cut and contrasted with uranyl acetate and lead citrate, and then visualized using a JEM-1230 transmission electron microscope (JEOL, Japan).

2.10 Statistical analysis

All the data were presented as mean ± S.E.M. Comparison of the results between various experimentally treated groups and corresponding controls was evaluated by Dunnett's test using SPSS 16.0 and p < 0.05 was considered statistically significant.

3. Results

3.1 Hemolysis assays

The hemolytic experiment was used to evaluate the cytotoxicity of ZnO QDs to RBCs. The hemoglobin in the supernatant of nanoparticles–RBCs was quantified by the visible absorbance at 576 nm. Fig. 1A showed the UV-vis absorption spectra of the supernatant and the percentage of hemolysis and Fig. 1B showed the photographs of RBCs after incubation with different concentration of ZnO QDs for 3 h at room temperature. The maximum percent of hemolysis was only 3.84% at the dose of 20 μg mL−1 ZnO QDs compared with the hemolysis in positive control (+) solution.
image file: c3ra46583g-f1.tif
Fig. 1 (A) UV-vis absorption spectra of the supernatant of QDs–RBCs after incubation with deionized water, normal saline and ZnO QDs. Insert on the right represent the percentage of hemolysis at different concentrations. (B) The photographs of RBCs hemolysis assay (+: positive control, deionized water; −: negative control, normal saline).

3.2 Body weight and liver coefficient

The animal body weights (Fig. 2) were recorded all over the experiment of 7 days injection and 28 days post-injection. There was no significant difference between treated group and control group (from 23.03 ± 0.36 g to 40.30 ± 1.44 g). The coefficients of liver in ZnO QDs, ZnO QDs–PEG and control groups were shown in Table 1. The liver coefficient after intravenous administration of 5 mg kg−1 ZnO QDs at 24 h (48.78 ± 2.50 mg g−1) was lower than control (54.23 ± 3.70 mg g−1), but without statistical significance. Other data from treated groups were nearly same as that of the control group. During the entire study period, no unusual daily behaviors such as eating, drinking, moving and hunching were observed from mice.
image file: c3ra46583g-f2.tif
Fig. 2 Body weight obtained from mice consecutive intravenous injection of ZnO QDs and ZnO QDs–PEG. The “0” day was the day completed injection. All data are presented as mean ± S.E.M. (n = 6).
Table 1 Coefficients of liver to body weight (BW) of mice at 24 h and 28 days after consecutive intravenous injection of ZnO QDs and ZnO QDs–PEGa
Index 24 h after injection 28 days after injection
a p < 0.01 versus vehicle control according to Dunnett's test.
Control 54.23 ± 3.70 45.73 ± 1.50
1 mg kg−1 ZnO QDs 51.35 ± 1.77 44.96 ± 1.27
5 mg kg−1 ZnO QDs 48.78 ± 2.50 47.52 ± 1.68
5 mg kg−1 ZnO QDs–PEG 53.41 ± 2.75 45.46 ± 1.38


3.3 Serum aminotransferases analysis

The toxicity of ZnO QDs and ZnO QDs–PEG to the mouse liver was evaluated by biochemical analysis. Regardless of the time post-treatment and dosage, the levels of ALT and AST in serum had no remarkable change in ZnO QDs and ZnO QDs–PEG groups (Fig. 3A and B).
image file: c3ra46583g-f3.tif
Fig. 3 Serum aminotransferases levels after intravenous injection ZnO QDs and ZnO QDs–PEG with different concentrations at 24 h and 28 days. (A) Alanine aminotransferase (ALT) and (B) aspartate aminotransferase (AST). All data are presented as mean ± S.E.M. (n = 6).

3.4 Antioxidant enzymes activity in the liver

The activities of oxidative stress related enzymes of CAT, GSH-Px and SOD were shown in Fig. 4. After intravenous administration of 1 mg kg−1 ZnO QDs at 24 h, the levels of enzymatic activities were obviously decreased to 139.15 ± 14.96 U mg−1 prot (p < 0.05) compared with control (206.31 ± 20.13 U mg−1 prot) for GSH-Px (Fig. 4B) and to 152.22 ± 3.65 U mg−1 prot (p < 0.05) compared with control (181.75 ± 8.78 U mg−1 prot) for SOD (Fig. 4C), while the CAT (Fig. 4A) activity had no change (control: 13.10 ± 1.09 U mg−1 prot, 1 mg kg−1 ZnO QDs: 11.19 ± 1.00 U mg−1 prot, p > 0.05). On the contrary, the CAT activity was increased to 19.88 ± 2.34 U mg−1 prot (p < 0.01), and GSH-Px activity increased to 196.98 ± 6.02 U mg−1 prot (p < 0.05) after treated with 5 mg kg−1 ZnO QDs at 24 h, while the SOD activity was the same as of control group. None of the three enzymes was affected by injection of 5 mg kg−1 ZnO QDs–PEG at this time point. After 28 days, all of the changed enzymatic activities by 1 and 5 mg kg−1 ZnO QDs at 24 h came back to control levels, and 5 mg kg−1 ZnO QDs–PEG had no effect on these enzymes yet (Fig. 4D–F).
image file: c3ra46583g-f4.tif
Fig. 4 Changes of catalase (CAT), glutathione peroxidase (GSH-Px) and superoxide dismutase (SOD) in the liver of mice treated with ZnO QDs and ZnO QDs–PEG on the time point of 24 h (A–C) and 28 days (D–F). All data are presented as mean ± S.E.M. (n = 6). *p < 0.05 and **p < 0.01 versus control according to Dunnett's test.

3.5 Lipid peroxidation assay

The level of lipid peroxidation was present as the concentration of MDA (Fig. 5). Exposure with 5 mg kg−1 ZnO QDs caused an increase of MDA (control: 0.34 ± 0.02 nmol mg−1 prot, 5 mg kg−1 ZnO QDs: 0.43 ± 0.02 nmol mg−1 prot, p < 0.01) at 24 h, and returned to control level at 28 days. The concentration of MDA had no change in either 1 mg kg−1 ZnO QDs or 5 mg kg−1 ZnO QDs–PEG group at 24 h and 28 days.
image file: c3ra46583g-f5.tif
Fig. 5 MDA levels in the liver of mice treated with ZnO QDs and ZnO QDs–PEG at 24 h (A) and 28 days (B). All data are presented as mean ± S.E.M. (n = 6). **p < 0.01 versus control according to Dunnett's test.

3.6 Ultrastructure of liver

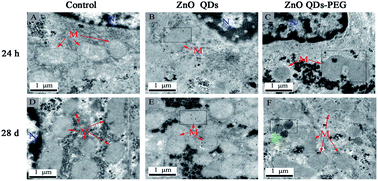
Fig. 6 showed the changes of animal hepatic cell ultrastructure after treated with control, 5 mg kg−1 of ZnO QDs and ZnO QDs–PEG at 24 h and 28 days. In the control group, the hepatic cell contained elliptical nuclei with homogeneous chromatin, clear cristae in the mitochondrion, and a few lysosomes at both 24 h (Fig. 6A) and 28 days (Fig. 6F). After intravenous administration of 5 mg kg−1 ZnO QDs at 24 h, the amount of QDs located in the mitochondrion (Fig. 6B and C) were low, and part of nucleus displayed with chromatin condensation and margination, and irregularity of the nuclear membrane. More ZnO QDs distributed in the mitochondrion at 28 days (Fig. 6G and H), while the shape of cell and nuclear looked similar as those in the control group. The existence of QDs in the mitochondrion and malformation nuclear were also found in the 5 mg kg−1 ZnO QDs–PEG group at 24 h (Fig. 6D and E). The ZnO QDs–PEG were mainly deposited in the increased lysosomes rather than mitochondrion and the hepatocyte ultrastructure was similar with that in the control group at 28 days (Fig. 6I and J).
image file: c3ra46583g-f6.tif
Fig. 6 Ultrastructure of hepatocyte after treated with control, 5 mg kg−1 of ZnO QDs and ZnO QDs–PEG at 24 h and 28 days. Red arrows indicate mitochondria, green arrows indicate lysosome, and pink arrows indicate ZnO QDs. Abbreviations: (N) nucleus, (M) mitochondria, (L) lysosome.

4. Discussion

ZnO QDs have wide applications in many fields, such as biological labeling, biosensing and drug delivery, but their in vivo behavior had not been fully understood. In this work, we focus on the liver damage by ZnO QDs and ZnO QDs–PEG after intravenous injection to mice for 7 consecutive days. The serum aminotransferases had no change in all experiment groups at both 24 h and 28 days. The antioxidant enzymes activities were changed in ZnO QDs treated groups at 24 h, and returned to normal at 28 days. All of these parameters studied were in the normal range in ZnO QDs–PEG treated groups. It was found that the final distributions of the nanoparticles in hepatic cells were different between ZnO QDs group and ZnO QDs–PEG group at 28 days.

Repeated doses are used to evaluate the harmful results after long-term exposure to relatively low doses of toxicant.24 Intravenous administration of exogenous agents can avoid the complication of the absorption phase, and provide a clearer pharmacokinetic profile,27 In this experiment, we chose the route of intravenous administration of ZnO QDs and ZnO QDs–PEG for 7 consecutive days to analyze the long-term toxicity of liver in mice.

Before the experiments, the potential hemolysis should be evaluated. Erythrocyte hemolysis in vitro is probably the simplest and most reliable assay for estimating blood compatibility. In our previous reports, the ZnO QDs–PEG did not damage RBCs-membrane even at the relatively high concentration of 1600 μg mL−1.14 Lin et al.28 reported that PEG improved the biocompatibility of mesoporous silica nanoparticles by masking the surface silanol groups and preventing infiltration of additional silanol groups from collapsed pores, and finally decreased their hemolytic activity. The hemolysis activities of ZnO QDs without PEG coating were evaluated and present as the hemoglobin concentration in the supernatant of the QDs–RBCs mixture. No significant hemolysis (<5%) was determined until the relatively high concentration of 1000 μg mL−1, and we infer that ZnO QDs have good blood compatibility.

The fluctuation of body weight, a useful indicator for qualitative assessing in vivo toxicity of compounds,15,29 was recorded every other day in entire experiment. The body weight of treated groups was approximate to that of the vehicle group indicating that ZnO QDs have no apparent toxicity even at long-time exposure. To eliminate the influence of the factors such as water, age, gender and malnutrition on body weight, organ coefficient was further used to assess ZnO QDs hepatotoxicity in mice. The increase in the organ coefficient indicates that there are changes in congestion, edema, hyperplasia, hypertrophy in organs, while the decrease means there are changes in shrink and degeneration.30 The liver coefficients in experiment groups were same as in control group at both 24 h and 28 days. It seemed the ZnO QDs and ZnO QDs–PEG were mild or no damages to liver of mice after treatment for consecutive 7 days.

The serum aminotransferases (ALT and AST) mainly exist in the liver. ALT distributes in the cytoplasm mainly and AST in the cytoplasm and mitochondria.26 The activities of ALT and AST in serum are corresponding well with the liver cell damage. In our work, regardless of the doses or time post treatment, ALT and AST were all in the normal range after intravenous injection. These results suggest that ZnO QDs and ZnO QDs–PEG did not affect the levels of serum aminotransferases.

Many different mechanisms participate in nanomaterials toxicity in the body, the main one is the induction of oxidative stress.7,11,31 The nanoparticle could lead to spontaneous ROS generation at its surface, and induce the generation of free radicals after interaction with cellular components, e.g. lipids, proteins, and DNA.7 The major antioxidative enzymes in cells are CAT, GSH-Px, and SOD, who can protect polyunsaturated fatty acid (PUFA) from lipid peroxidation by reducing H2O2 and superoxide radical.32 All of these enzymes were disturbed by consecutive injection of ZnO QDs at 24 hours, indicating that ZnO QDs induced damage of liver cells. After 28 days, the levels of these enzymes returned to normal value suggesting the hepatotoxicity induced by ZnO QDs was recoverable. However, the ZnO QDs–PEG had no effect on the activities of antioxidative enzymes, suggesting that coating of PEG on the ZnO QDs surface can decrease their toxicity. The similar phenomenon was found by Tan et al.33 and Park et al., who deemed that the decreased toxicity was due to the less production of ROS from the conjugates.34

Lipid peroxidation is an important index of oxidative stress, and one of its products is MDA. Significant increasing of MDA content was observed in 5 mg kg−1 ZnO QDs group compared to the control at 24 h, indicating ZnO QDs induced oxidative stress in the liver.7 Both the oxidative stress and the increased antioxidative enzymes levels induced by 5 mg kg−1 ZnO QDs indicated that the antioxidant capability of hepatocytes was elevated.35 Additionally, the condensation and margination of nucleus chromatin also verified that ZnO QDs had adverse effect on hepatic cells at 24 h. The enhanced levels of MDA content in 5 mg kg−1 ZnO QDs group were returned to normal value range within 4 weeks, which was similar to the transient increase of lipid hydroperoxide (LHPO) level caused by iron oxide magnetic nanoparticles.36 ZnO QDs–PEG caused no apparent change of MDA content at both 24 h and 28 days.

In conclusion, aqueous ZnO QDs and ZnO QDs–PEG were synthesized and their hepatotoxicity was assessed after consecutively intravenous injection for 7 days in mice. Serum aminotransferases were not affected by the QDs, while the levels of antioxidant enzymes and malondialdehyde had significant change at 24 h in the group of ZnO QDs. Both ZnO QDs and ZnO QDs–PEG induced nuclear malformation at 24 h. However all the changed parameters in ZnO QDs group made a full recovery at 28 days. These results reflected that ZnO QDs induced recoverable hepatocyte toxicity and ZnO QDs–PEG were less toxic than ZnO QDs.

Acknowledgements

This study was supported by the research funds from the research funds from the National Science Foundation (no. 21375052) and the National Science Foundation for Fostering Talents in Basic Research of the National Natural Science Foundation of China (Grant no. J1103307).

References

  1. P. Kovacic and R. Somanathan, in Oxidative Stress and Nanotechnology, ed. D. Armstrong and D. J. Bharali, Springer Science + Business Media, New York, 2013, vol. 1028, ch. 2, pp. 15–35 Search PubMed.
  2. F. M. Winnik and D. Maysinger, Acc. Chem. Res., 2012, 46, 672–680 CrossRef PubMed.
  3. H. Mattoussi, G. Palui and H. B. Na, Adv. Drug Delivery Rev., 2012, 64, 138–166 CrossRef CAS PubMed.
  4. D. K. Tiwari, T. Jin and J. Behari, Int. J. Nanomed., 2011, 6, 463–475 CAS.
  5. D. Zhao, H. Song, L. Hao, X. Liu, L. Zhang and Y. Lv, Talanta, 2013, 107, 133–139 CrossRef CAS PubMed.
  6. K. Matsuyama, I. Neil, K. Irie, K. Mishima, T. Okuyama and H. Muto, J. Colloid Interface Sci., 2013, 19–25 CrossRef CAS PubMed.
  7. V. Sharma, P. Singh, A. K. Pandey and A. Dhawan, Mutat. Res., Genet. Toxicol. Environ. Mutagen., 2012, 745, 84–91 CrossRef CAS PubMed.
  8. A. Aboulaich, C.-M. Tilmaciu, C. Merlin, C. Mercier, H. Guilloteau, G. Medjahdi and R. Schneider, Nanotechnology, 2012, 23, 335101 CrossRef PubMed.
  9. S. Yu, J. Zhao and H.-Q. Su, J. Nanosci. Nanotechnol., 2013, 13, 4066–4071 CrossRef CAS PubMed.
  10. Y. Zhang, H. Wang, H. Jiang and X. Wang, Nanoscale, 2012, 4, 3530–3535 RSC.
  11. K. L. Aillon, Y. Xie, N. El-Gendy, C. J. Berkland and M. L. Forrest, Adv. Drug Delivery Rev., 2009, 61, 457–466 CrossRef CAS PubMed.
  12. A. A. Shvedova, A. Pietroiusti, B. Fadeel and V. E. Kagan, Toxicol. Appl. Pharmacol., 2012, 261, 121–133 CrossRef CAS PubMed.
  13. T. S. Hauck, R. E. Anderson, H. C. Fischer, S. Newbigging and W. C. Chan, Small, 2010, 6, 138–144 CrossRef CAS PubMed.
  14. Y. Yang, J. Lan, Z. Xu, T. Chen, T. Zhao, T. Cheng, J. Shen, S. Lv and H. Zhang, Nanotoxicology, 2014, 8, 107–116 CrossRef CAS PubMed.
  15. Y. Su, F. Peng, Z. Jiang, Y. Zhong, Y. Lu, X. Jiang, Q. Huang, C. Fan, S.-T. Lee and Y. He, Biomaterials, 2011, 32, 5855–5862 CrossRef CAS PubMed.
  16. C.-H. Lin, M.-H. Yang, L. W. Chang, C.-S. Yang, H. Chang, W.-H. Chang, M.-H. Tsai, C.-J. Wang and P. Lin, Nanotoxicology, 2011, 5, 650–663 CrossRef CAS PubMed.
  17. (a) M. Auffan, J. Rose, J.-Y. Bottero, G. V. Lowry, J.-P. Jolivet and M. R. Wiesner, Nat. Nanotechnol., 2009, 4, 634–641 CrossRef CAS PubMed; (b) S. Lanone and J. Boczkowski, Curr. Mol. Med., 2006, 6, 651–663 CrossRef CAS.
  18. V. Stone and K. Donaldson, Nat. Nanotechnol., 2006, 1, 23–24 CrossRef CAS PubMed.
  19. M. Simkó, A. Gazsó, U. Fiedeler and M. Nentwich, NanoTrust-Dossier, 2011, 12, 1–3.
  20. (a) C. Shen, S. A. James, M. D. de Jonge, T. W. Turney, P. F. Wright and B. N. Feltis, Toxicol. Sci., 2013, 136, 120–130 CrossRef CAS PubMed; (b) M. I. Setyawati, C. Y. Tay and D. T. Leong, Biomaterials, 2013, 34, 10133–10142 CrossRef CAS PubMed.
  21. X. Zhao, S. Wang, Y. Wu, H. You and L. Lv, Aquat. Toxicol., 2013, 136–137, 49–59 CrossRef CAS PubMed.
  22. B. Sha, W. Gao, S. Wang, X. Gou, W. Li, X. Liang, Z. Qu, F. Xu and T. J. Lu, J. Appl. Toxicol., 2013 DOI:10.1002/jat.2900.
  23. M. J. Gómez-Lechón, J. V. Castell and M. T. Donato, in Hepatocytes, ed. P. Maurel, Springer, Berlin, 2010, vol. 640, ch. 21, pp. 389–415 Search PubMed.
  24. (a) T. Liu, L. Li, X. Teng, X. Huang, H. Liu, D. Chen, J. Ren, J. He and F. Tang, Biomaterials, 2011, 32, 1657–1668 CrossRef CAS PubMed; (b) Q. He, Z. Zhang, F. Gao, Y. Li and J. Shi, Small, 2011, 7, 271–280 CrossRef CAS PubMed.
  25. M. Semmler-Behnke, W. G. Kreyling, J. Lipka, S. Fertsch, A. Wenk, S. Takenaka, G. Schmid and W. Brandau, Small, 2008, 4, 2108–2111 CrossRef CAS PubMed.
  26. X.-D. Zhang, D. Wu, X. Shen, P.-X. Liu, F.-Y. Fan and S.-J. Fan, Biomaterials, 2012, 33, 4628–4638 CrossRef CAS PubMed.
  27. R. S. Yang, L. W. Chang, J.-P. Wu, M.-H. Tsai, H.-J. Wang, Y.-C. Kuo, T.-K. Yeh, C. S. Yang and P. Lin, Environ. Health Perspect., 2007, 115, 1339–1343 CrossRef CAS PubMed.
  28. Y.-S. Lin and C. L. Haynes, J. Am. Chem. Soc., 2010, 132, 4834–4842 CrossRef CAS PubMed.
  29. L. Xiong, T. Yang, Y. Yang, C. Xu and F. Li, Biomaterials, 2010, 31, 7078–7085 CrossRef CAS PubMed.
  30. C. Wang, M. Cao, D. Shi, Z. Yin, R. Jia, K. Wang, Y. Geng, Y. Wang, X. Yao and Z. Yang, Hum. Exp. Toxicol., 2013, 32, 904–913 CAS.
  31. S. T. Stern and S. E. McNeil, Toxicol. Sci., 2008, 101, 4–21 CrossRef CAS PubMed.
  32. J. Wang, C. Chen, B. Li, H. Yu, Y. Zhao, J. Sun, Y. Li, G. Xing, H. Yuan and J. Tang, Biochem. Pharmacol., 2006, 71, 872–881 CrossRef CAS PubMed.
  33. S. J. Tan, N. R. Jana, S. Gao, P. K. Patra and J. Y. Ying, Chem. Mater., 2010, 22, 2239–2247 CrossRef CAS.
  34. S. Park, H. Chibli and J. Nadeau, J. Visualized Exp., 2012, 65, e3969,  DOI:10.3791/3969.
  35. W. Liu, S. Zhang, L. Wang, C. Qu, C. Zhang, L. Hong, L. Yuan, Z. Huang, Z. Wang and S. Liu, PLoS One, 2011, 6, e24406 CAS.
  36. (a) S. Prijic and G. Sersa, Radiol. Oncol., 2011, 45, 1–16 CrossRef CAS PubMed; (b) T. K. Jain, M. K. Reddy, M. A. Morales, D. L. Leslie-Pelecky and V. Labhasetwar, Mol. Pharmaceutics, 2008, 5, 316–327 CrossRef CAS PubMed.

This journal is © The Royal Society of Chemistry 2014