Porous graphitic carbon prepared from the catalytic carbonization of Mo-containing resin for supercapacitors
Pengpeng Taoab,
Jing Hua,
Wenxi Wangb,
Shuai Wanga,
Minchan Liab,
Hong Zhonga,
Yougen Tang*a and
Zhouguang Lu*b
aKey Laboratory of Resource Chemistry of Nonferrous Metals, Ministry of Education, School of Chemistry & Chemical Engineering, Central South University, Changsha, Hunan 410083, China. E-mail: ygtang@csu.edu.cn; Fax: +86-755-88018904; Tel: + 86-755-88018966
bDepartment of Materials Science and Engineering, South University of Science and Technology of China, Shenzhen, Guangdong 518055, China. E-mail: luzg@sustc.edu.cn
First published on 28th January 2014
Abstract
A polystyrene-based ion exchange resin was utilized to recover Mo from wastewater, and the Mo was used as a catalyst and template to produce porous graphitic carbon possessing a large specific surface area and high electronic conductivity at moderate temperature. Further H2O2 oxidation leads to an increase in the pore volume due to the removal of molybdenum carbide and the partial oxidation of the porous carbon, resulting in a considerable enhancement of the specific capacitance.
1. Introduction
With the worsening fossil energy depletion and global warming, there is an urgent need for efficient, clean and sustainable energy storage devices with high energy densities and power densities.1 Electrochemical double layer capacitors (EDLCs) or supercapacitors possessing the advantages of high efficiency, high power capability, excellent cycling stability, and fast charging and discharging capabilities are attracting increasing research interest.2,3 These splendid features make them promising candidates for a wide range of applications, such as hybrid power sources for electric vehicles, portable electronic devices, consumer electronics, and so on.4,5Recently, numerous materials with a diversity of components and nanostructures have been explored as electrodes for supercapacitors.6–8 Among them, carbon materials including active carbon, carbon nanotubes, carbon fibers, and graphene, owing to their low cost, high conductivity, environmental friendliness, and stable mechanical strength, have been intensively investigated.9,10 Compared with other carbon materials, porous activated carbons have attracted great research attention due to their well-developed microstructure, excellent physico-chemical stability and low cost.11,12 However, in the micropores, the mass transfer resistances of electrolyte ions are increased with the current densities increasing, leading to reduced rate capability.2,13 In addition, the electrical conductivity of activated carbons is low due to the amorphous framework.14 To solve the aforementioned problems, porous graphitic carbons (PGCs) with high crystalline structures and abundant mesopores have been synthesized. These studies demonstrated that catalytic graphitization was an effective method to develop PGCs.15,16 Conventionally, PGCs with well-developed graphitic order are prepared at extremely high temperature (>2500 °C). Another strategy is to promote the graphitization of amorphous carbon at relatively low temperature (<1000 °C) through the catalytic effect of transitional metal catalysts like Fe, Co, Ni, etc.17,18 More importantly, the transition metals function not only as catalysts for the graphitization on the basis of the dissolution–precipitation mechanism, but also act as a template for the formation of the porous structures in this process.19
Molybdate is generally considered as an excellent catalyst.20,21 A great deal of wastewater containing molybdate is drained in industrial processes, for instance in the metallurgical industry, pigments industry, and MoS2 based lubricants production. This Mo-containing wastewater causes serious heavy metal pollution. According to the World Health Organization, it is harmful to human beings when the concentration of molybdenum in water is higher than 7 μg L−1.22 It has become increasingly urgent to clean and recycle the heavy metal Mo from the industrial wastewater before it is released into rivers. In the recycling process, chemical adsorption treatment by ion exchange resins has been proved to be one of the most effective techniques to recover molybdate from aqueous solutions owing to its high performance and practicality.23,24 However the resins easily lost their activity after several cycles of adsorption. Therefore it remains a great challenge to reuse the dead resins after the heavy metal treatment.25
In this paper, we reported a facile method to prepare highly graphitized porous carbon from the Mo-adsorbed resins and apply the highly graphitized porous carbon as an electrode material for supercapacitors. In this method as illustrated in Fig. 1, ion exchange resins adsorb Mo ions with different valence states from solution. During the carbonization procedure, the Mo species act as a catalyst and promote the graphitization of carbon at moderate temperature. Simultaneously highly porous structures are developed after the removal of Mo2C by H2O2 treatment. Our recent work on the preparation of PGCs by a facile Mo catalysis approach greatly reduces the graphitization temperature of carbon materials and is a controllable and low-cost method for preparation of porous PGCs. Furthermore, this strategy successfully utilizes the cleaning of Mo heavy metal industrial wastewater and the production of sustainable energy materials.
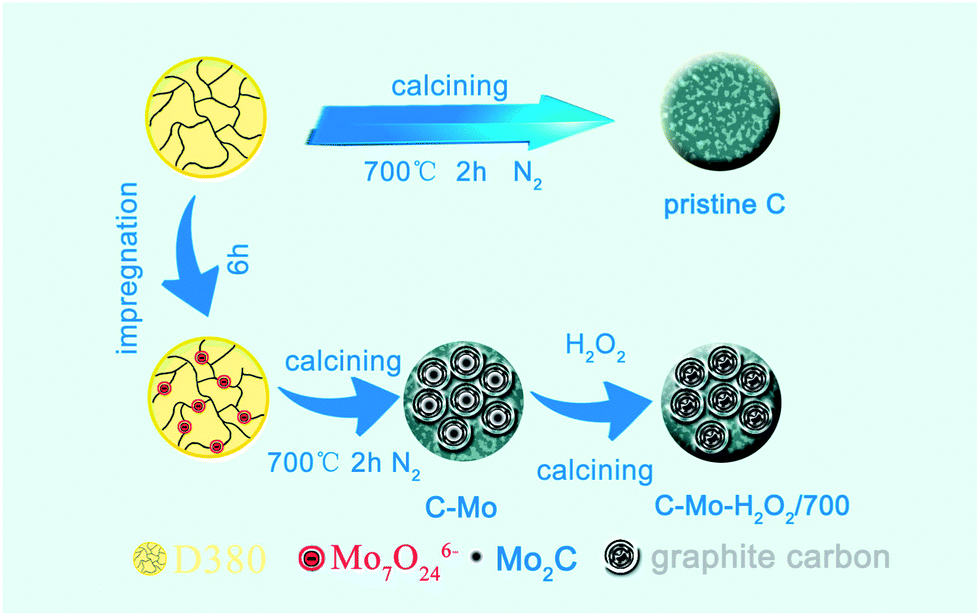 | ||
| Fig. 1 Schematic illustration of the formation procedure for the PGCs sample. | ||
2. Experimental section
2.1 Preparation of PGCs
The polystyrene-based anion-exchange resins (D380) were firstly soaked with absolute ethanol for 10 hours to remove adsorbed organic components. After that, the resins were treated with 5% HCl solution and washed with copious deionized water until the pH value of the eluate was neutral. Subsequently, the wet resins were dried under vacuum at 60 °C for 12 hours.After soaking and stirring in 0.1 mol L−1 (NH4)6Mo7O24 solution for 6 h, the resins were washed with deionized water and dried under vacuum. The Mo-containing resins were then placed into a ceramic boat and heated from room temperature to 700 °C at a rate of 5 °C min−1 in a tube furnace under a flow of N2 (150 mL min−1), and were maintained at that temperature for 2 h. After cooling to ambient temperature, the products were washed, dried, ground and sieved to 80–140 mesh. The resultant carbon sample is labelled as C-Mo, which was immersed in 30% H2O2 for 1 day and then washed completely with plenty of deionized water. After being dried, the C-Mo-H2O2 sample was fabricated. Finally, the product C-Mo-H2O2/700 was obtained after being further calcined at 700 °C for 2 h under N2. For the sake of comparison, resins without any metal adsorption were carbonized in identical conditions and the obtained carbon was named as pristine C.
2.2 Characterization
The X-ray diffraction (XRD) measurements were carried out in a Rigaku D/max-2500 X-ray diffractometer with Cu Kα radiation (λ = 1.54056 Å).The TEM characterizations were carried out in a JEOL JEM-2010 (JEOL Ltd., Tokyo, Japan) at 200 kV. In the sample preparation for the TEM, the powder sample was dispersed in ethanol by ultrasonication for 30 min and then transferred onto a micro-grid with a support membrane. The morphologies and microstructures of samples were observed.
Raman spectroscopy measurements were performed in a LabRAM HR 800 Raman microscope using an excitation laser beam with a wavelength of 633 nm.
The specific surface areas of the samples were analyzed by nitrogen (N2) adsorption–desorption isotherms at 77 K using a NOVA 1200e Surface Area and Pore Size Analyzer (Quantachrome Instruments).
2.3 Electrochemical measurements
The electrochemical performances of the various carbon samples were characterized by cyclic voltammetry, galvanostatic charge–discharge and electrochemical impedance spectroscopy (EIS) techniques. The electrodes were obtained by pressing a mixture of carbon sample (85 wt%), acetylene black (10 wt%) and polytetrafluoroethylene (PTFE) (5 wt%) to the nickel foam.The electrodes were assembled to be a typical three-electrode system in an electrolyte of 6 mol L−1 KOH, where a Hg/HgO electrode was used as a reference electrode and platinum foil was used as a counter electrode.
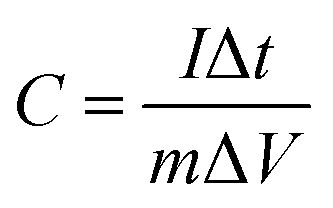
Galvanostatic charge–discharge analysis was carried out in a CHI66D (Shanghai China) instrument. The specific capacitance of the EDLC was calculated according to the following equation:
 | (1) |
3. Results and discussion
3.1 XRD
The XRD patterns of the as-prepared samples are shown in Fig. 2.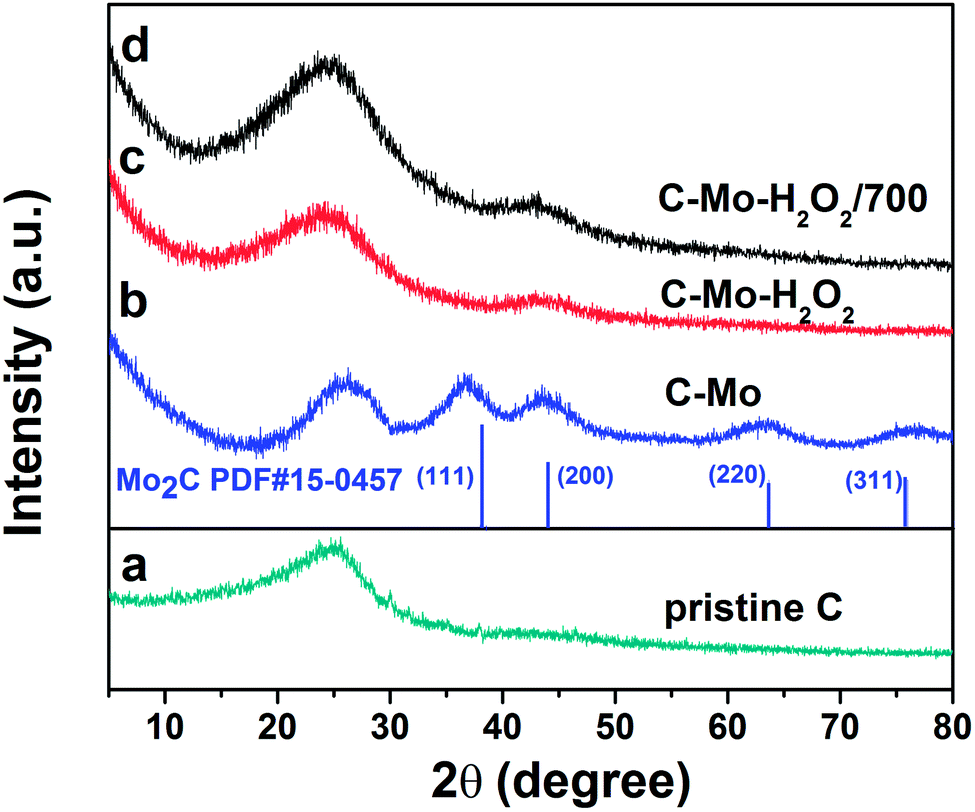 | ||
| Fig. 2 XRD patterns of as-prepared samples: (a) pristine C, (b) C-Mo, (c) C-Mo-H2O2 and (d) C-Mo-H2O2/700. | ||
The diffractions centered at 2θ = 37.7°, 43.7°, 63.4° and 75.7° are indexed as (111), (200), (220) and (311) facets of Mo2C (JCPDS no. 15-0457), respectively. The diffractions at around 25.2° and 43° can be assigned to the (002) and (101) planes of graphite, respectively. We can see that, in addition to carbon, phase purity Mo2C has been produced after carbonization of the Mo-treated samples. Mo acted as a catalyst to promote the graphitization of the resin at moderate temperature, as indicated by the increase of the graphite peak at around 25.2° and the shift of the graphitic carbon peak toward the right side.26 It is worth noting that the peaks originating from the Mo2C phase have almost disappeared after H2O2 treatment. The reason is that Mo2C can be completely dissolved in H2O2 to obtain a carbon-containing heteropoly acid represented as [CxMoyO]z−.27 Yehai Xu et al. demonstrated the mechanism of the process as follows.28
| H2O2 + Mo2C → [CxMoyO]z− + H2O | (2) |
The conclusion was also proved to be right by other researchers.29–31 Moreover, the intensity of the peak at 25.2° weakens to some extent due to the oxidation of carbon by H2O2 occurring on the surface. As expected, the C-Mo-H2O2/700 exhibits a very high degree of graphitization, considerably contributing to the enhancement of the electronic conductivity of the carbon material.
3.2 TEM
Fig. 3a shows the TEM image of the pristine C sample. No crystalline structure can be found, indicating that this sample contains a disordered carbon framework. In contrast, the TEM image of C-Mo, obtained after carbonization of the Mo-adsorbed resins, as shown in Fig. 3b demonstrates clear lattice fringes with spacings of 2.41 and 2.01 Å, corresponding to the (111) and (200) facets of Mo2C, respectively. The selected area electron diffraction (SAED) pattern (inset in Fig. 3b) shows distinct diffraction rings that can be ascribed to the (111) and (200) planes of Mo2C. From Fig. 3c, we can see that the carbon appears as an amorphous layer, resulting from the oxidation by H2O2 treatment. Fig. 3d distinctly shows graphitic (002) layers with an interplanar spacing of 3.51 Å, indicating that a highly graphitized structure was formed in the H2O2 sample after annealing at 700 °C. These TEM results are quite consistent with the aforementioned XRD results (Fig. 2). It suggests that the Mo species can serve as a catalyst for the graphitization of carbon materials. Furthermore, it can be seen that Mo2C nanoparticles with a diameter of about 10 nm are homogeneously dispersed in the carbon framework (Fig. 3e). Meanwhile, the inset EDS pattern exactly confirms the coexistence of C and Mo elements. However, Mo2C nanoparticles disappear after H2O2 treatment, resulting in the formation of a porous structure with a pore size of around 10 nm (Fig. 3f).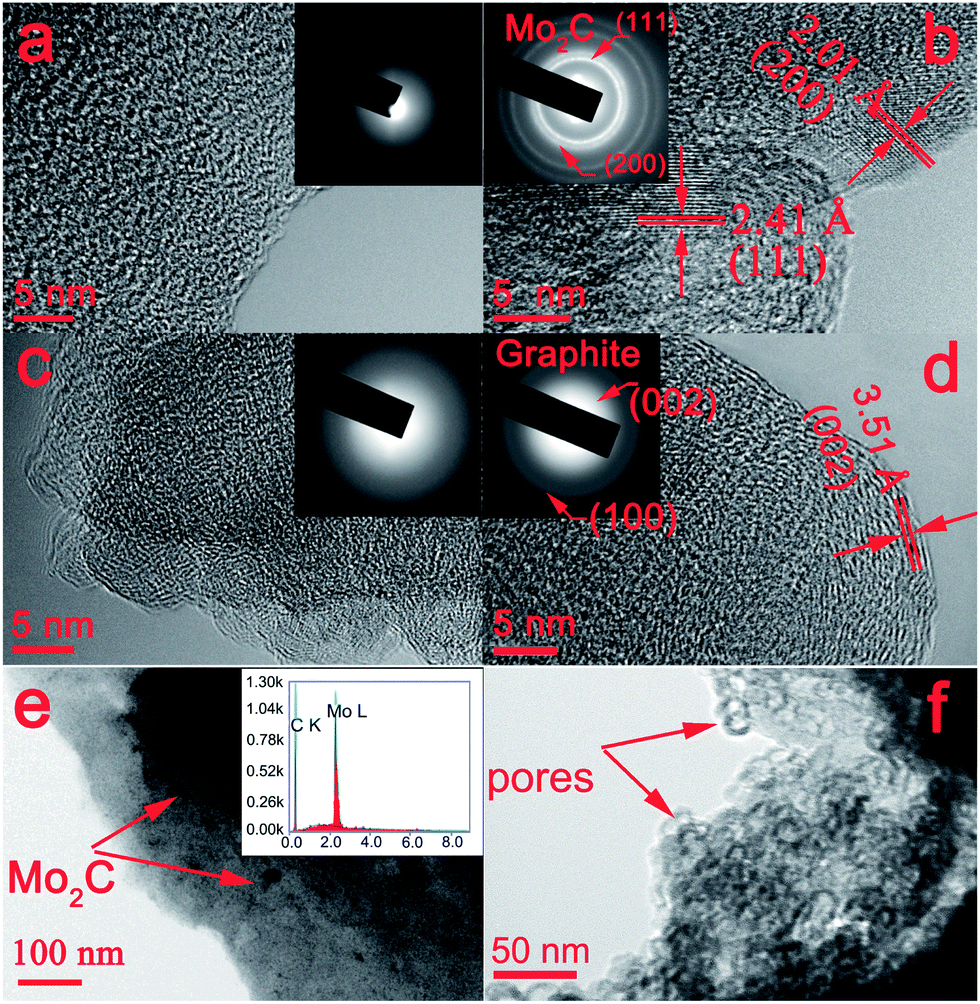 | ||
| Fig. 3 TEM and HRTEM images of as-prepared samples: (a) pristine C, (b and e) C-Mo, (c) C-Mo-H2O2, (d and f) C-Mo-H2O2/700. The insets of (a–d) show the corresponding SAED patterns. The inset of (e) displays the corresponding EDS pattern. | ||
3.3 Raman spectroscopy
Fig. 4 shows the Raman spectra of all the prepared carbon materials demonstrating two characteristic peaks symbolized as the G band and D band. The G band at 1600 cm−1 represents ordered graphite-like carbon arising from the in-plane bond-stretching motion of pairs of sp2 atoms in both rings and chains, while the D band appearing at 1360 cm−1 is assigned to breathing modes of rings.32–35 The relative intensity of the G vs. D band (IG/ID) reflects the ordering degree of the carbon material, namely, a higher value of IG/ID signifies a better graphitization degree.36,37 The Raman spectrum of the C-Mo sample, compared with the pristine C, shows a larger intensity ratio of IG/ID and thereby indicates a great improvement in graphitization after carbonization and thermal treatment of pristine C adsorbed Mo7O246−. Another two dramatically sharp peaks in the C-Mo sample (Fig. 4b), located at 820 and 994 cm−1, are coming from the Mo2C that was derived from the product after catalysis, which are well consistent with the XRD results.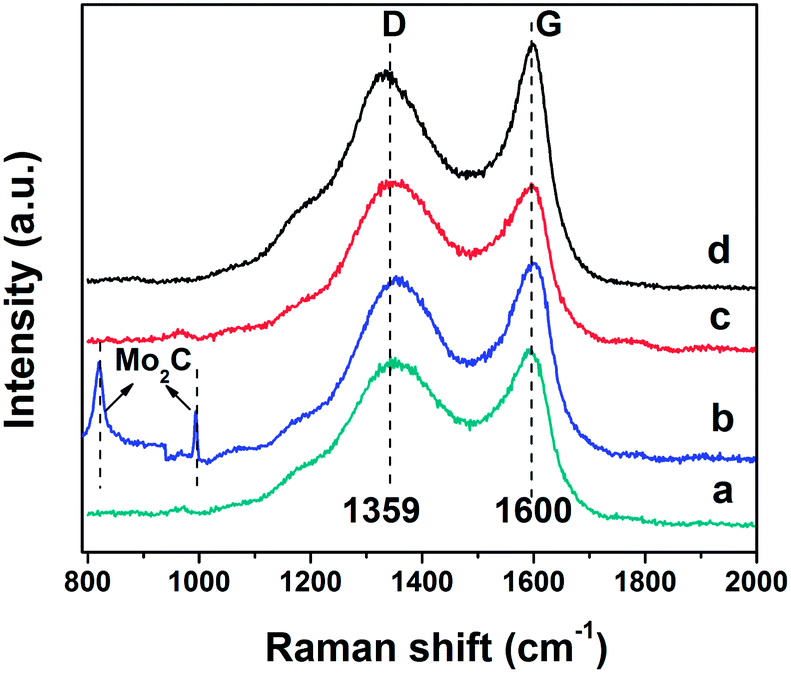 | ||
| Fig. 4 Raman spectra of as-prepared samples: (a) pristine C (1.03), (b) C-Mo (1.06), (c) C-Mo-H2O2 (0.99) and (d) C-Mo-H2O2/700 (1.11). | ||
3.4 Nitrogen adsorption studies
The specific surface areas of the produced carbon materials were calculated by the conventional Brunauer–Emmett–Teller (BET) method. As shown in Fig. 5a, the N2 adsorption–desorption isotherm of the pristine C sample presents a type I-like curve according to the IUPAC classification, which implies the existence of micropores. The pore size distribution curve as shown in the inset of Fig. 5a indicates that there are very limited pores inside the pristine carbon with a very narrow pore size distribution of about 2 nm. However, in the case of the C-Mo-H2O2/700 sample, a type I isotherm with a type H4 hysteresis loop in the range of ca. 0.45–1.0 P/P0 was observed (Fig. 5b). It suggests the material consists of micropores and mesopores which are embedded into a microporous matrix. A flat adsorption curve is a signature of micropores, while the relatively conspicuous hysteresis loop proves the presence of mesopores.38–40 The corresponding pore size distribution diagram as shown in the inset of Fig. 5b implies a broad pore size distribution with micro-sized pores distributed at about 2 nm and a relatively large amount of mesopores ranging from 10 to 60 nm. The specific surface area of the pristine C sample and C-Mo-H2O2/700 sample are about 287.0 and 664.3 m2 g−1, respectively. It suggests that the specific surface area was considerably increased after the Mo treatment.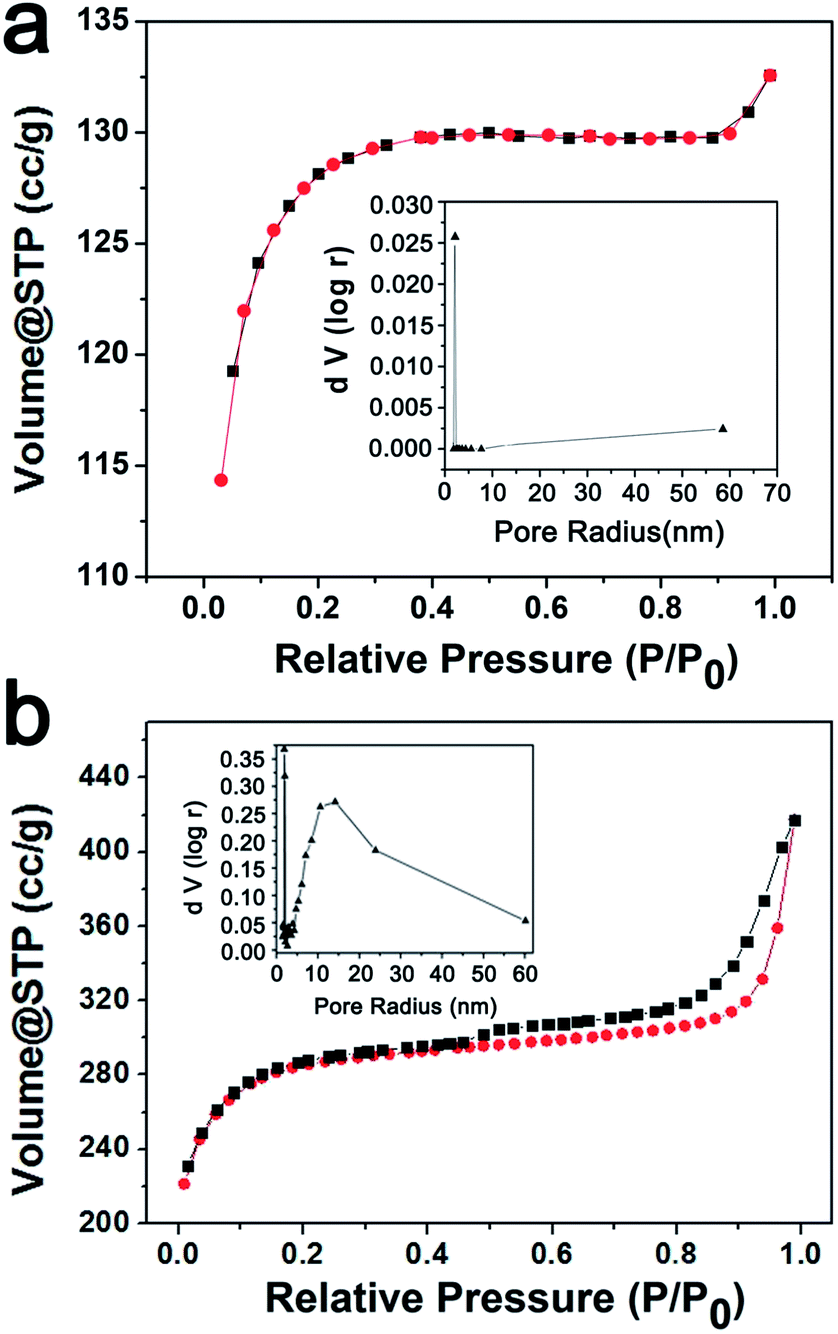 | ||
| Fig. 5 N2 sorption isotherm of the pristine C (a) and the C-Mo-H2O2/700 sample (b). The insets show the corresponding pore size distribution diagrams. | ||
4. Electrochemical measurements
Electrochemical properties of the carbon materials were investigated by cyclic voltammetry, galvanostatic charge–discharge and electrochemical impedance spectroscopy.4.1 CV
Fig. 6a shows the CV curves of the obtained various carbon samples at a sweep rate of 50 mV s−1, covering the voltage window from −0.8 V to 0.2 V. It is obvious that except for C-Mo-H2O2, the other three samples present good rectangular shaped CV curves, an indication of the typical capacitive properties of the carbon samples. However, the C-Mo-H2O2 sample exhibits quite distinctive CV features as compared with the other three samples showing a relatively weak redox peak owing to the surface oxygen species after H2O2 treatment. The specific capacitance is proportional to the area of the CV curves. Therefore, the gradual increase in CV area from pristine C to C-Mo-H2O2/700, indicates an improvement in capacitance.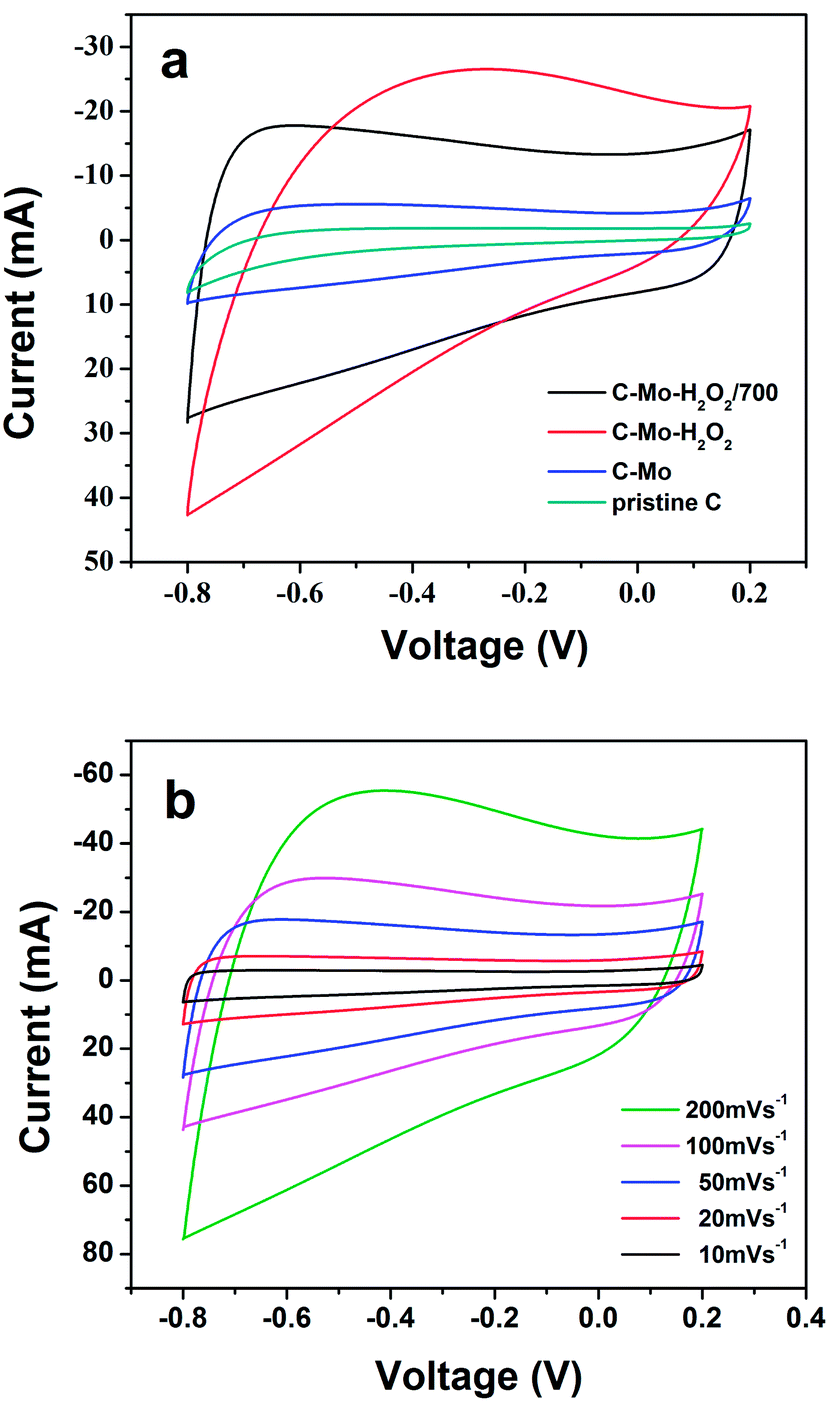 | ||
| Fig. 6 (a) Comparison of the CV curves for different samples at a scan rate of 50 mV s−1 and (b) CV curves of the C-Mo-H2O2/700 samples at different scan rates. | ||
Fig. 6b depicts the CV curves of the C-Mo-H2O2/700 sample at different scan rates varying from 10 to 200 mV s−1. The CV curves show a good rectangular shape without very oblique angles even at a high sweep rate of 200 mV s−1, implying a typical behaviour of double layer capacitance.41 It implies that the C-Mo-H2O2/700 sample has very good fast charge and discharge capabilities and outstanding electrical conductivity.
4.2 Galvanostatic charge–discharge
Fig. 7a shows the galvanostatic charge–discharge profiles of the as-obtained different carbon samples. It is clear that the voltage profiles of the pristine C and C-Mo samples display a triangular shape even at a high current density of 1 A g−1, an indication of ideal double-layer capacitive behaviour. In good contrast, the galvanostatic charge–discharge curves of the C-Mo-H2O2 samples before and after annealing at 700 °C are not so symmetric and slightly distorted. Furthermore, the charge and discharge duration is considerably prolonged. It is speculated that the surface of the pores of the carbon was oxidized by the H2O2 treatment, resulting in pseudocapacitive properties, which is the central reason behind the voltage profiles.42 On the basis of eqn (1), the specific discharge capacitances of the pristine C, C-Mo, C-Mo-H2O2, and C-Mo-H2O2/700 samples at the current density of 1 A g−1 are 42 F g−1, 65 F g−1, 209 F g−1 and 265 F g−1, respectively. It implies that the specific capacitance is obviously enhanced after Mo treatment, which is well consistent with the CV results.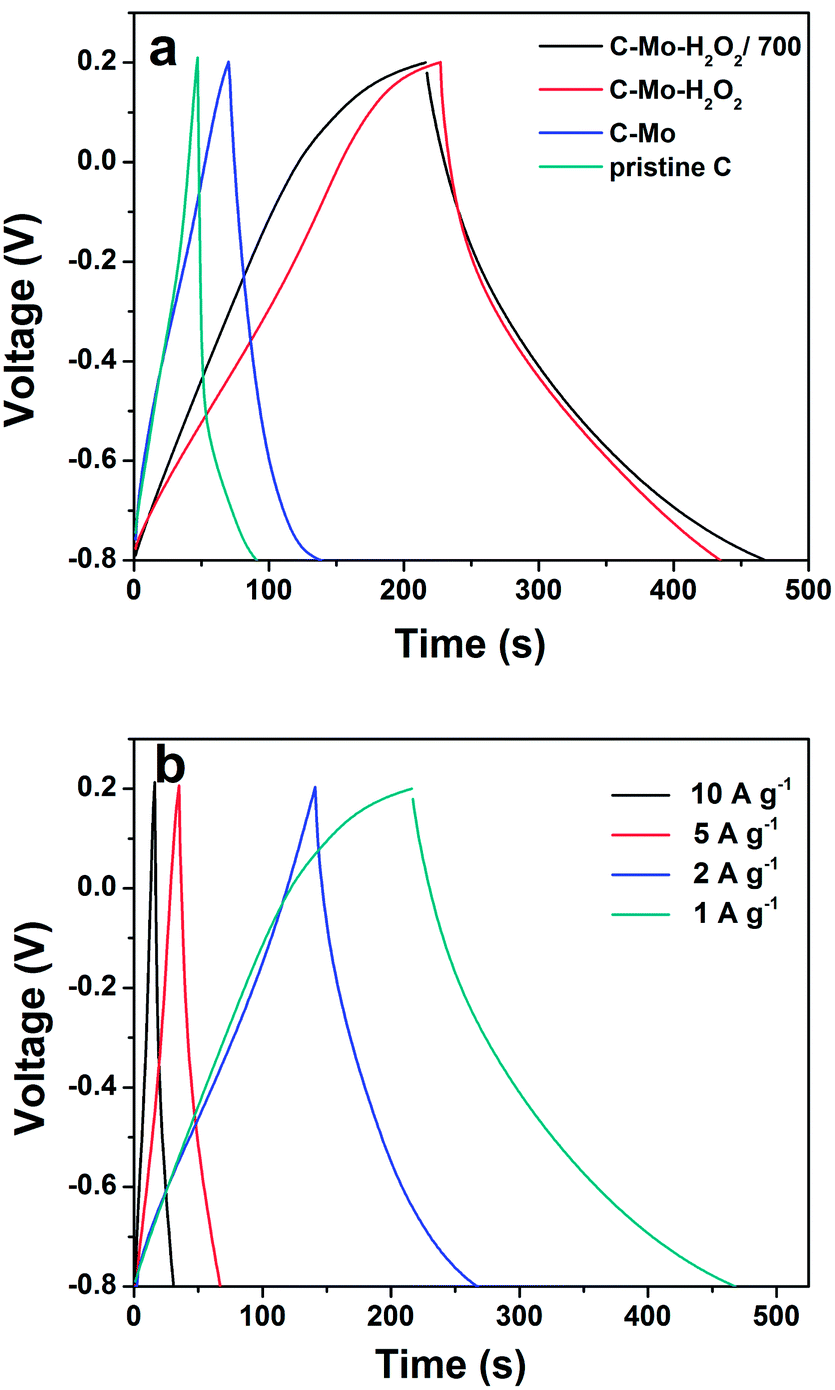 | ||
| Fig. 7 (a) Galvanostatic charge–discharge curves at 1 A g−1 of the as-prepared various carbon samples and (b) galvanostatic charge–discharge curves of the C-Mo-H2O2/700 sample at different current densities. | ||
Fig. 7b shows the rate capability of the C-Mo-H2O2/700 sample. The specific capacitances of the C-Mo-H2O2/700 sample are 265, 256, 165 and 150 F g−1 at the current densities of 1, 2, 5 and 10 A g−1, respectively. Though the specific capacitance gradually decreases as the current increase owing to the incremental (IR) voltage drop and the diffusion limit of the electrolyte ions at high discharge current, the C-Mo-H2O2/700 electrode still possesses a high capacitance of 150 F g−1 at a very high current density of 10 A g−1, nearly 57% of that at 1 A g−1.
4.3 Cycling
The specific capacitance and coulombic efficiency as a function of cycle number were recorded at a current density of 1 A g−1 in Fig. 8. The specific capacitance increases slightly in the first 300 cycles due to the active materials being fully activated, and then almost keeps constant. The capacitance retention ratio still reaches 94% even after 8000 cycles, indicating its excellent cycling stability. Meanwhile, the coulombic efficiency keeps at 95% as the cycle number increases, implying the outstanding reversibility of energy storage in the supercapacitor.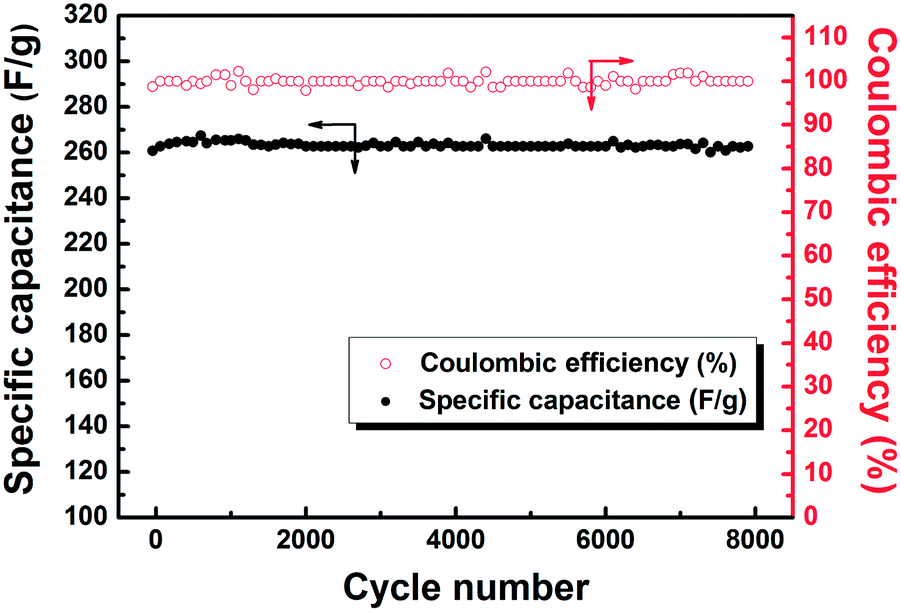 | ||
| Fig. 8 Variation of specific capacitance and coulombic efficiency with cycle number for C-Mo-H2O2/700. | ||
As a result, the prepared C-Mo-H2O2/700 sample demonstrates very promising electrochemical performance with a good combination of high capacitance, stable cycling, and excellent rate capability.
4.4 EIS
The electrochemical impedance spectra of the as-prepared carbons are shown in Fig. 9. It can be seen that all the impedance spectra are composed of a semicircle component in the high-frequency region followed by a straight line in the low-frequency region. In principle, the low internal resistances (Rb) and charge transfer resistance (Rct) demonstrate the high electrical conductivity of the material.43 The Rb value of the pristine C, C-Mo, C-Mo-H2O2, and C-Mo-H2O2/700 samples obtained from the intercepts of the semicircles are 1.3, 0.6, 2.0 and 1.0 Ω, respectively. Thus, the C-Mo possesses the minimum Rb value, originating from the existence of Mo2C which has excellent electrical conductivity. It can also be confirmed by XRD. The pristine C reveals a large semicircle, indicating a high charge transfer resistance, resulting from its underdeveloped pore structure and amorphous carbon framework. The C-Mo-H2O2 possesses the largest Rct value among all the samples, arising from the presence of surface functional groups and defects after H2O2 treatment.44 Interestingly, the C-Mo-H2O2/700 has the smallest Rct value among all the samples which can be ascribed to the very abundant porous structures and the highly graphitized carbon framework.45 Therefore, the C-Mo-H2O2/700 sample has the highest specific capacitance, which is well consistent with the previous electrochemical results.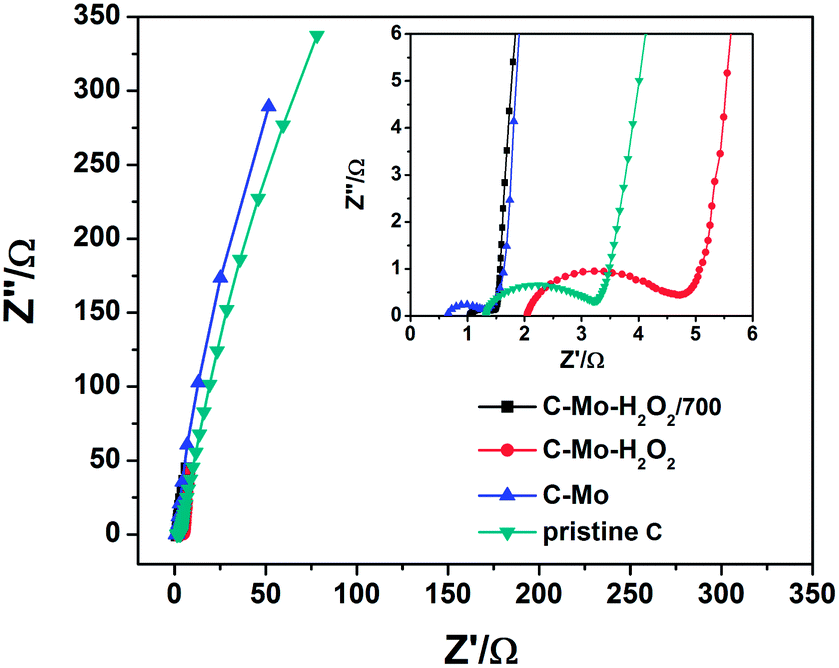 | ||
| Fig. 9 Nyquist plots of experimental impedance data of different samples (inset: enlarged high-frequency region of the Nyquist plots). | ||
5. Conclusions
In this study, a novel and facile strategy had been proposed to prepare porous graphite carbon by using a polystyrene-based ion exchange resin adsorbing Mo7O246− from wastewater as the carbon precursor. When used as the electrode materials for supercapacitors, the as-prepared C-Mo-H2O2/700 sample exhibited superior electrochemical performance with a good combination of high specific capacitance, outstanding cycling stability, and excellent rate capability, due to the high specific surface area resulting from the abundant porous structure and enhanced electronic conductivity derived from the highly graphitized carbon features. Furthermore, this approach can remove heavy metal ion pollutants from Mo containing wastewater before it is discarded into rivers. More importantly, this strategy can be generally applied to treat other kinds of heavy metal ions like Cr, W, Hg, Pb, etc. and this technique is suitable for large-scale application.Acknowledgements
This work was supported by the Natural Science Foundation of China (21001117 and 21206199) and the Starting-Up Funds of South University of Science and Technology of China (SUSTC).Notes and references
- J. Y. Kim, K. H. Kim and K. B. Kim, J. Power Sources, 2008, 176, 396–402 CrossRef CAS PubMed.
- B. Xu, F. Wu, R. Chen, G. Cao, S. Chen and Y. Yang, J. Power Sources, 2010, 195, 2118–2124 CrossRef CAS PubMed.
- J. Jin, S. Tanaka, Y. Egashira and N. Nishiyama, Carbon, 2010, 48, 1985–1989 CrossRef CAS PubMed.
- M. Liu, L. Gan, W. Xiong, F. Zhao, X. Fan, D. Zhu, Z. Xu, Z. Hao and L. Chen, Energy Fuels, 2013, 27, 1168–1173 CrossRef CAS.
- L. Jiang, J. Yan, L. Hao, R. Xue, G. Sun and B. Yi, Carbon, 2013, 56, 146–154 CrossRef CAS PubMed.
- L. L. Zhang and X. S. Zhao, Chem. Soc. Rev., 2009, 38, 2520–2531 RSC.
- G. Wang, L. Zhang and J. Zhang, Chem. Soc. Rev., 2012, 41, 797–828 RSC.
- A. Ghosh and Y. H. Lee, ChemSusChem, 2012, 5, 480–499 CrossRef CAS PubMed.
- Y. Wen, G. Cao and Y. Yang, J. Power Sources, 2005, 148, 121–128 CrossRef CAS PubMed.
- P. Simon and Y. Gogotsi, Nat. Mater., 2008, 7, 845–854 CrossRef CAS PubMed.
- S. J. Han, Y. H. Kim, K. S. Kim and S. J. Park, Curr. Appl. Phys., 2012, 12, 1039–1044 CrossRef PubMed.
- C. Peng, X. b. Yan, R. t. Wang, J. w. Lang, Y. j. Ou and Q. j. Xue, Electrochim. Acta, 2013, 87, 401–408 CrossRef CAS PubMed.
- J. Wang, M. Chen, C. Wang, J. Wang and J. Zheng, J. Power Sources, 2011, 196, 550–558 CrossRef CAS PubMed.
- C. Liang, Z. Li and S. Dai, Angew. Chem., Int. Ed., 2008, 47, 3696–3717 CrossRef CAS PubMed.
- K. Inomata and Y. Otake, J. Mater. Sci., 2009, 44, 4200–4204 CrossRef CAS PubMed.
- L. Wang, C. Tian, B. Wang, R. Wang, W. Zhou and H. Fu, Chem. Commun., 2008, 5411–5413 RSC.
- D. Zhai, H. Du, B. Li, Y. Zhu and F. Kang, Carbon, 2011, 49, 725–729 CrossRef CAS PubMed.
- B. Y. Xia, J. N. Wang, X. X. Wang, J. J. Niu, Z. M. Sheng, M. R. Hu and Q. C. Yu, Adv. Funct. Mater., 2008, 18, 1790–1798 CrossRef CAS.
- M. Sevilla and A. B. Fuertes, Carbon, 2006, 44, 468–474 CrossRef CAS PubMed.
- S. V. Kotov, S. Boneva and T. Kolev, J. Mol. Catal. A: Chem., 2000, 154, 121–129 CrossRef CAS.
- S. Tangestaninejad, V. Mirkhani, M. Moghadam and G. Grivani, Catal. Commun., 2007, 8, 839–844 CrossRef CAS PubMed.
- B. B. Kar, P. Datta and V. N. Misra, Hydrometallurgy, 2004, 72, 87–92 CrossRef CAS.
- H. Nakagawa, K. Watanabe, Y. Harada and K. Miura, Carbon, 1999, 37, 1455–1461 CrossRef CAS.
- P. Kůs, H. Parschová, M. Novotná, E. Mištová and L. Jelínek, Sep. Sci. Technol., 2012, 48, 581–586 CrossRef.
- V. M. Gun ko, R. Leboda, J. Skubiszewska-Zieba, B. Charmas and P. Oleszczuk, Carbon, 2005, 43, 1143–1150 CrossRef CAS PubMed.
- Z. Yan, M. Cai and P. K. Shen, Sci. Rep., 2013, 3, 1–7 Search PubMed.
- T. Kudo, G. Kawamura, and A. Ishikawa, US Pat., 1987, 350–357.
- Y. H. Xu, J. J. Zhou, T. Zhou, Y. H. Chao, S. Yan, X. C. Jiang, X. J. Chen, W. S. Zhu and H. M. Li, Key Eng. Mater., 2013, 575–576, 539–542 CrossRef.
- V. B. Fedorus, T. Y. Kosolapova, Y. B. Kuz'ma and L. N. Kugai, Refractory Carbides, 1995, 423–431 Search PubMed.
- T. Kudo, Nature, 1984, 312, 537–538 CrossRef CAS.
- A. Maslennikov, C. Cannes, B. Fourest, N. Boudanova, V. Vivier and P. Moisy, Radiochim. Acta, 2007, 95, 399–408 CrossRef CAS.
- D. W. Wang, F. Li, Z. G. Chen, G. Q. Lu and H. M. Cheng, Chem. Mater., 2008, 20, 7195–7200 CrossRef CAS.
- Y. Tan, C. Xu, G. Chen, Z. Liu, M. Ma, Q. Xie, N. Zheng and S. Yao, ACS Appl. Mater. Interfaces, 2013, 5, 2241–2248 CAS.
- A. C. Ferrari and J. Robertson, Philos. Trans. R. Soc., A, 2004, 362, 2477–2512 CrossRef CAS PubMed.
- A. C. Ferrari and J. Robertson, Phys. Rev. B: Condens. Matter, 2000, 61, 14095–14107 CrossRef CAS.
- J. Hu, P. Tao, S. Wang, Y. Liu, Y. Tang, H. Zhong and Z. Lu, J. Mater. Chem. A, 2013, 1, 6558–6562 CAS.
- S. Urbonaite, L. Hälldahl and G. Svensson, Carbon, 2008, 46, 1942–1947 CrossRef CAS PubMed.
- W. Huang, H. Zhang, Y. Huang, W. Wang and S. Wei, Carbon, 2011, 49, 838–843 CrossRef CAS PubMed.
- K. K. R. Datta, V. V. Balasubramanian, K. Ariga, T. Mori and A. Vinu, Chem. Eur. J., 2011, 17, 3390–3397 CrossRef CAS PubMed.
- M. Kruk, Z. Li, M. Jaroniec and W. R. Betz, Langmuir, 1999, 15, 1435–1441 CrossRef CAS.
- X. Lang, A. Hirata, T. Fujita and M. Chen, Nat. Nanotechnol., 2011, 6, 232–236 CrossRef CAS PubMed.
- M. Li, J. Ding and J. Xue, J. Mater. Chem. A, 2013, 1, 7469–7476 CAS.
- M. C. Liu, L. Kang, L. B. Kong, C. Lu, X. J. Ma, X. M. Li and Y. C. Luo, RSC Adv., 2013, 3, 6472–6478 RSC.
- L. Hao, X. Li and L. Zhi, Adv. Mater., 2013, 25, 3899–3904 CrossRef CAS PubMed.
- T. C. Chou, C. H. Huang, R. A. Doong and C. C. Hu, J. Mater. Chem. A, 2013, 1, 2886–2895 CAS.
| This journal is © The Royal Society of Chemistry 2014 |