Effect of volatile solvent infiltration on optical and electrical characteristics of porous photonic structures

Pawan K. Kanaujia, M. C. Bhatnagar and G. Vijaya Prakash*
Nanophotonics Lab, Department of Physics, Indian Institute of Technology Delhi, New Delhi, 110016, India. E-mail: prakash@physics.iitd.ac.in

Received 8th November 2013 , Accepted 12th March 2014

First published on 12th March 2014


Abstract

The infiltration of small chain alcohols into the deep nano sized pores of one dimensional porous silicon (PS) based photonic structures have been continuously monitored against time by simultaneous electrical and optical measurements. The in situ optical reflection studies during volatile solvent exposure reveal several dynamic processes; within a limited time duration of solvent exposure the microcavity resonant peak shifts towards higher wavelength, and after prolonged exposure and drying the cavity resonant peak shifts to a new semi-permanent lower wavelength. In situ optical and electrical responses from PS photonic structure-based low-cost multifunctional devices reveal their potential application for a wide range of chemical and biological species detection and monitor their sensor dynamic processes.

1. Introduction

Photonic structures are tailor-made materials, having a periodicity of the modulated refractive index in the order of the light wavelength, show great promise in optoelectronic device technology. All photonic devices have an essential requirement to have complete control over photons either to convert them into electrons (photovoltaic cells)1–3 or to detect other foreign species (bio/chemical sensors)4,5 or to efficiently produce another photon (light emitters).6,7 Therefore, novel photonic materials having designer properties with optimized performance are a prime requirement for energy and environmental devices. Several methods have been developed to create photonic composites, where photons efficiently interact with matter either externally or within the system.8–10 The emergence of photonic structures with multi-functional (optical, electrical and thermal) properties has been witnessed in the past decade, exclusively demonstrating functionalities in the area of photovoltaics, chemical and biological sensors etc.1–5

In recent years, porous materials have generated great interest as a multifunctional and low-cost materials, both for active (such as LED etc.) as well as passive (such as sensors etc.) photonic applications. One of the porous materials, porous silicon (PS), is a sponge-like structure, where the nano-sized pores grow into crystalline silicon from the surface to the bulk.11 The PS possesses a large surface area and therefore acts as a strong adsorbent or template for foreign constituents due to the connecting network of pores.12 Further, considering the ease of modulating the refractive index by changes in porosity, these materials can be easily integrated as wavelength-ordered alternative stacks of high and low refractive index layers such as Distributed Bragg Reflectors (DBR), Rugate filters and microcavities (MC). These photonic structures can be easily formed by a single-step electrochemical etching method.13 Having the advantage of accommodating foreign constituents, one can also achieve completely interacting optical fields with the impregnated material for a selected wavelength of interest.14–18

As a consequence of impregnation with high refractive index materials (such as organic/inorganic and biological materials), the effective refractive index of the overall PS structure can be modified and a significant red-shift in the photonic states and/or cavity modes has been witnessed. Pavesi’s group reported that during volatile solvent detection the resonant cavity mode wavelength of the PS microcavity showed a monotonic red-shift and the dynamic cavity mode reversed to it is original value upon drying.19 Since the cavity mode red-shift is sensitive to both volume (down to ppm level) and the refractive index of impregnated species, PS photonic structures are extensively used as a potential optical sensors to detect solvents and gasses.20,21

On the other hand, the study of surface probing dynamics of chemisorbed molecules on porous silicon has also been studied equally well.22 Since freshly etched PS is highly reactive, the mobilised molecules easily functionalize the surfaces, and as a consequence, the electronic states of the nano porous crystalline silicon are significantly modified.23 This has been visualised by several surface-based techniques, such as electrical measurements, IR/Raman and photoluminescence spectroscopies.24,25 Such functionalization of PS photonic structures produces a significant blue-shift in optical measurements.24–27 Similarly, the controlled oxidation of PS microcavities also results in a permanent blue-shift in the resonant cavity peak position.23,28–30

In general, the PS optical MC resonance peak positions are highly sensitive and selective to both guest molecule impregnation (effective refractive index change) as well as pore functionalization (surface modification). While the former shows a significant red-shift, the later shows a permanent blue-shift. However, during prolonged/repeated detection studies of volatile solvents and biomolecules, chemical reaction with the surfaces is inevitable.31 To the best of our knowledge, no direct report has clearly addressed the dynamic evolution of functionalization and impregnation of solvents for prolonged and repeated measurements. Such studies reveal many important facts about the photonic state modification due to impregnation of guest molecules and at the same time controlled modification of electronic states due to guest molecule interaction (functionalization) with the PS surfaces.

This paper reports some important findings on PS-based photonic structures, with the infiltration of volatile solvents. During the systematic study, the fabrication of several PS photonic structures (p-type single layer, Distributed Bragg Reflectors and microcavities) has been taken up and the studies are focused on understanding the selectivity and dynamic range of infiltration of different volatile solvents. Simultaneous electrical and optical measurements give an insight into the solvent detection sensor limits, which could be easily extended to many toxic chemicals and biological substances. The in situ optical studies revealed many new dynamic processes, especially an understanding of the red-/blue-shift anomaly of the resonant cavity peak upon organic impregnation. All the experimental results are convincingly supported by transfer-matrix method (TMM) simulations and effective medium approximation (EMA) theory.

2. Experimental details

Highly doped, 〈100〉 oriented p+ silicon wafers of a resistivity maximum of 100 Ohm cm (University Wafers, USA) are used for all photonic structures fabrication. PS samples are fabricated in the dark at room-temperature using the etchant solution (hydro fluoric acid–ethyl alcohol–deionized water) in 2[thin space (1/6-em)]:[thin space (1/6-em)]2[thin space (1/6-em)]:[thin space (1/6-em)]1 ratio, using a galvanostatic electrochemical etching.14 Before the etching, the native oxide on the surface of the silicon wafer has been removed using aqueous hydrofluoric acid (HF) solution for 20–30 s. The galvanostatic etching is carried out in a home-made Teflon cell using a two electrode configuration, where the silicon wafer (attached to a copper plate) and platinum mesh are used as the working and counter electrodes respectively. PS photonic structures such as Distributed Bragg Reflector (DBR), microcavity and single PS layers are prepared using optimised parameters14 to achieve the desired thickness, porosity and refractive index. All the fabricated PS structures are appropriately rinsed, dried and preserved under an inert atmosphere.

The effective refractive index of the individual PS layers depends on its porosity and can be calculated by the well-known EMA formula.13,14

 
image file: c3ra46515b-t1.tif(1)
where εsi is dielectric constant of host silicon (1st medium), εeff is the effective dielectric constant of guest–host composite and εmedium is dielectric constant of the guest materials (2nd medium, air or organic solvent). The effective refractive index value can be estimated as image file: c3ra46515b-t2.tif TMM simulations are performed using the available literature values of wavelength dependent optical constants (refractive index (n) and extinction coefficient (k)) of individual materials.14

A DBR is designed for a specific wavelength (λ), which contains alternative stacks of high and low porosity layers, each having an optical thickness of λ/4. A PS microcavity is realised as a sandwiched λ/2 spacer layer of high porosity between two similar DBRs. In the present case the design of each DBR contains 4 stacks of alternating low (porosity = 51%, n2 = 2.28) and high (porosity = 68%, n1 = 1.70) porosity with λ/4 optical thickness, and a cavity layer of λ/2 optical thickness (porosity = 68%, n1 = 1.70), where n1 and n2 are the refractive index of high and low porosity layers respectively. All these structures are fabricated in a single step anodic etching using combinations of appropriate current densities and etching time. Several PS microcavities having different cavity resonances are fabricated and used in the experiments. To obtain the desired cavity resonance, the aforementioned porosities are fixed and individual layer thicknesses are adjusted accordingly. For example, to obtain a 245 nm thick single PS (p-type) layer with porosity 64% (n = 1.8), a current density of 60 mA cm−2is used for 5 seconds. The transfer matrix method (TMM) has been utilised to simulate experimental reflection spectra as well as to estimate the physical parameters (refractive index and thickness). All the fabricated PS structures have the desired thickness and the pores are randomly distributed throughout the sample, with the average diameters of 10–20 nm, depending on the porosity. The pores are vertically oriented and the individual porosities and thicknesses of the designed microcavities are identified from scanning electron microscopic (SEM) images (ESI Fig. 1).

Both optical (normal incidence reflection spectra) and electrical (current–voltage characteristics) measurements are simultaneously performed using the experimental setup shown in Fig. 1. For reflection spectral measurements, a white light source has been collimated onto the separation between the metal electrodes of PS device using an appropriate light collimation arrangement system. The reflected light has been collected at normal incidence by a multimode fibre and fed to a spectrometer. For electrical measurements, aluminium metal contacts (1100 μm width and thickness ∼100 nm, with separation of 900 μm) are vacuum deposited on the top of the PS structures and a DC voltage power supply, digital multimeter is employed. During the dynamic evolution of current response during the solvent exposure experiments, the bias voltage is kept at 5 V. It is to be noted that no appreciable effect has been observed on optical data while the electrical field is applied and vice versa. For normal infiltration measurements, all PS devices are exposed to solvents with a controlled quantity (∼10 μl per 0.64 cm2) at room temperature in a closed chamber. All the solvents (methanol, ethanol and 2-propanol) are spectroscopic grade without any further purification and used at room-temperature under controlled experimental conditions. To mimic prolonged and repeated solvent exposure studies, the PS devices are completely immersed into the solvent and the solvent has been withdrawn after specific time duration and the sample is allowed to dry naturally. During all these events, the optical reflection measurements are continuously performed within a specific time interval. To ensure uniformity and allow a relative comparison, the freshly prepared microcavity sample has been cut into four pieces and they are individually exposed to organic solvents under similar conditions. Further to avoid any oxidation effects, all the samples used are freshly prepared. While the studies are performed on all type PS structures, but presented data is for microcavity and the rest of the data has been given in the ESI.


image file: c3ra46515b-f1.tif
Fig. 1 Schematic representation of simultaneous optical and electrical measurement setup. Inset shows the electrical contacts in (a) cross-sectional and (b) top views.

3. Results and discussion

3.1 Reflection spectral measurements

The freshly prepared PS microcavities are exposed to various solvents, namely, methanol, ethanol and 2-propanol for short intervals and in controlled quantities. The optical reflection spectra of the microcavities are continuously recorded during the infiltration. The reflection spectra of freshly prepared and solvent impregnated microcavities are shown in Fig. 2a. The reflection spectrum of as prepared microcavity shows a single cavity resonance peak at 613 nm with typical full width half maximum (FWHM) of about 10 nm. After solvent exposure, a significant and clear red-shift in the cavity mode has been observed corresponding to a particular solvent infiltration, from methanol to 2-propanol. It is also found that there is no significant change in the FWHM of the cavity before and after exposure to the solvent. Transfer matrix method (TMM) simulations are used to simulated the experimental reflection spectra, using the refractive index values of individual PS layers obtained from the effective medium approximation (EMA, eqn (1)). As seen from Fig. 2b, the simulated reflection spectra closely match with the experiments (Fig. 2a). The refractive index values of high (n1) and low (n2) layers used in the simulations are tabulated in Table 1. Since the overall porosity and the thickness of the individual layers are not going to be affected, the effective refractive index values are predicted assuming the pores are completely replaced by the solvent. As seen from the table, the change in the refractive index (Δn) before and after solvent exposure ranges from 0.10 to 0.17; this is monotonically increasing with the solvent refractive index.
image file: c3ra46515b-f2.tif
Fig. 2 (a) Normalized reflection spectra of the PS microcavities, (i) freshly prepared and after exposure to solvents (ii) methanol (iii) ethanol (iv) 2-propanol. (b) TMM simulated reflection spectra to compare the experimental results shown in (a); all the spectra are shifted along the Y-axis for clarity.
Table 1 Porous silicon microcavity parameters of as-prepared and after exposure to various solvents: resonant cavity peak (λmin), cavity peak shift (Δλ) and current variation (ΔI) with respect to unexposed cavity, n1, n2 are refractive index values of high and low porosity layers respectively of microcavity estimated from TMM simulations (see text). Δn and S are the change in the effective refractive index and spectral sensitivity after solvent exposure respectively
Micro cavity λmin, Δλ in nm Estimated values, n1, n2 (±0.01) Estimated Δn, (±0.01) S = Δλn Current variation (ΔI = 1 − I0/I)
As prepared 613, (00) 1.70, 2.28  
Exposed to
Methanol (n = 1.32) 649, (+36) 1.80, 2.38 0.10 360 44.0
Ethanol (n = 1.36) 666, (+53) 1.85, 2.43 0.15 353 23.1
2-propanol (n = 1.38) 671, (+58) 1.87, 2.45 0.17 341 55.6


In order to verify the effective refractive index variation with respect to solvent impregnation, the refractive index values for PS layers are estimated by varying the infiltered medium refractive index from 1.0 (air) to 2.0 (solvent) for different porosities (p = 40% to 80%) using eqn (1) and are plotted in Fig. 3a. Here the refractive index of the 1st medium (nSi = 3.6) and porosity/thickness will remain constant. The effective refractive index values (n1 and n2) estimated from the experimental data for high and low porosity layers (68% and 51%) are also included in the graph as solid circles in green and pink colors respectively. As seen from Fig. 3a, the experimental values are slightly lower than the expected values. Both theoretical and experimental results suggest that the pores are part space-filled by the solvents. Also due to volatile nature of the solvents even at room temperature, the presence of a mixture of vapor and liquid forms of the solvent is another possibility. The TMM simulated optical microcavity resonant cavity peak variation with respect to solvent refractive index is consistent with the experimentally observed peak shifts (Fig. 3b). It should be noted that the experiments are also performed for several short duration cycles for all solvents to ensure reproducibility and the results are presented in the following section. However, for accurate quantification for sensor applications, more precise experiments, such as exposing to controlled quantities of solvent vapors for several short cycles, are needed.19,23,32


image file: c3ra46515b-f3.tif
Fig. 3 (a) The estimated effective refractive index values of PS layers of various porosities (40% to 80%, dotted lines) when the pores are moved from air (nair = 1.0) to the solvent medium (nsolvent = 2.0). The experimental refractive index values for various solvents for the 1st and 2nd layers of porosities 68% and 51% are also shown as solid circles. (b) The experimental microcavity peak shift vs. solvent refractive index. The inset shows the simulated microcavity resonant peak position vs. effective refractive index.

Nevertheless, the red-shifted PS microcavity resonant cavity peak can be conveniently attributed to the change in the optical field variation within the solvent infiltered microcavity due to an effective refractive index enhancement.21

3.2 Simultaneous optical and electrical measurements

Apart from the optical response, PS devices have also been extensively investigated for gas, solvent and biomolecule detection, utilising the advantage of porous silicon’s large surface area and high chemical activity. While the electrical techniques are mostly surface-based, optical measurements probe complete lateral dimensions. Having both the measurement capabilities in a single device obviously gives an advantage over sensitivity and selectivity. Simultaneous time-dependent current and reflection spectral responses have been recorded for various solvent exposures on the PS microcavities using the experimental setup described in Fig. 1. Fig. 4 shows the PS microcavity resonant peak position variation, extracted from the reflection spectral measurements, and current variation upon methanol, ethanol and 2-propanol exposures. All solvent exposures elicited a fairly good response and the enhancement factors for both the measurements are given in Table 1. The time-spectral mapping graphs and current–voltage characteristics for all solvent measurements are given in the ESI (Fig. 4). Both the cavity peak variation and current response return to their initial features after drying the solvent, suggesting the reversibility of the measurements which is a key feature for sensor applications.
image file: c3ra46515b-f4.tif
Fig. 4 Transient ON–OFF characteristics of resonant cavity peak position (wavelength, WL) (blue) and current (red) values, during PS microcavity device exposure to solvents, (a) methanol (b) ethanol and (c) 2-propanol.

Since the freshly etched PS structures are sensitive to the infiltered organic solvent these are expected to produce a large variation in the effective dielectric constant and induced dipole moments.33–37 The conduction on the disordered PS surface has been widely studied previously and it has been speculated that the current flow arises due to the combination of the conductivity of nano crystalline silicon as well as the porosity dependent hopping conductivity.38–43 However, the effect of multilayers (such as DBR or microcavities) on the electrical properties may not be as expected since the planar electrode configuration only allows electric current in the first few layers, depending on the penetration depth of electric field. Whereas in the reflection measurements, the optical field completely penetrates (∼1.1 μm depth) deep down into the microcavity, creating standing resonances within the changed environment; a deviation in microcavity mode is expected.14 While electrical response is highly sensitive to the adsorbed species at the PS surfaces, the PS microcavity resonant peak position is sensitive as well as selective to the solvent refractive index.44,45 Overall, simultaneous measurements of both optical and electrical techniques are essential to evaluate both selectivity and sensitivity to the infiltered molecules.

3.3 PS microcavity spectral features during and after prolonged exposure to organic solvents

The aforementioned microcavity resonant peak reversibility to its dry conditions is restricted to a few cycles of short duration (<100 s) of exposure and to controlled quantities of solvents. These experiments are also verified for several PS microcavities having different cavity resonances and the obtained results are consistently similar (ESI). In fact, freshly etched porous silicon is highly reactive to its chemical environment depending on the specific hydrophobic/hydrophilic nature of c-Si nanopore surfaces, therefore over any prolonged or repeated exposure to high quantities of reactive molecules, the reproducible results are dubious.46,47 As per our knowledge, no such efforts are taken-up to understand the effect of longer exposure of chemical species and their infiltration dynamics in PS based devices. Here to mimic the prolonged exposure, the PS device has been immersed into the solvent and reflection spectra are continuously monitored for a longer time.

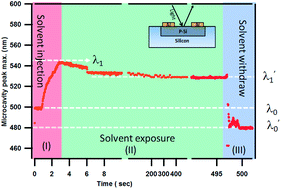
The PS microcavity resonant peak position variation with respect to time upon a volatile solvent (methanol) exposure cycle has been plotted in Fig. 5a for a microcavity having resonance at λ0 = 495 nm. It is interesting to observe that the time evolution of the microcavity peak shows several dynamic variations, with three regions of special interest, and the related discussion is as follows.


image file: c3ra46515b-f5.tif
Fig. 5 (a) PS microcavity resonant peak dynamic variation during solvent (methanol) exposure. Regions I, II and III indicate the initial (sensing) region, prolonged exposure region and solvent withdrawal regions respectively (see text). (b) Normalized reflection spectra of the PS microcavity during the solvent exposure at different time scales (as shown in (a)): (1) as prepared microcavity, (2) after 2 s solvent exposure, (3) at 450 s exposure, (4) after solvent withdrawal (at >500 s) and (5) fully recovered spectra, after ∼100 h of drying under vacuum conditions at room temperature. The spectra are shifted along the Y-axis for clarity.

Region I: during the initial exposure, the microcavity resonant mode has the expected sensor response (Fig. 2 and 4): the cavity peak position shifts to a longer wavelength side (red-shift). However, the cavity peak shift (λo to λ1) is slightly higher than the values reported in Fig. 2 and is close to the theoretical predictions (Fig. 3). This is due to the fact that the PS microcavity pores are now completely filled with solvent, in contrast to the previous controlled quantity exposure and short duration experiments (Fig. 2 and 4), wherein the pores are part-filled.

Region II: this region is still the solvent sensing region, where the cavity resonance peak position is still at a higher wavelength. However, after complete wetting of the pores, the cavity peak position started a slow blue-shift (of <10 nm) to another peak position, λ1. Though such a shift is a slow process (about 200 s), the overall peak shift is about +29 nm relative to the unexposed microcavity peak position (λ0).

Region III: this region shows the solvent recovery dynamics after prolonged exposure. After immersing the sample in organic solvent for a longer duration, the solvent was quickly withdrawn and the sample allowed to dry naturally under normal conditions at room-temperature. Within a short duration, the cavity resonance peak showed regular recovery, and quickly blue-shifted towards the original cavity resonance (λ0). However, it is interesting to note that the spectral recovery is not to the expected original peak position (λ0) but to a new semi-permanent lower wavelength (λ0). Under ordinary experimental conditions, it nearly takes about 100 h for a complete recovery of the blue-shifted cavity resonance (λ0) to its original value (λ0). At this stage, the presence of residual solvent may not be significant (otherwise the microcavity shows a red-shift (>λ0) in the cavity peak position), but the adsorption of solvent molecules to the PS walls could be quite possible.

Fig. 5b shows the extracted reflection spectra of the microcavity at the various aforementioned stages, and similar results are observed for the other solvents as well.

As discussed before, the reason for the red-shift (region I) of cavity peak with solvent exposure and regular recovery after drying in PS microcavity is a typical sensor phenomena, which has already been well studied by Pavesi and other groups.19–21,42 Such solvent sensitive detection (down to ppm levels) is mainly attributed to the increase in the effective refractive index of the PS photonic structure due to replacement of the second medium from air to organic solvents (or mixture of vapour and liquid). Similar results are also observed for biological, toxic gasses and other volatile solvent detections.21,48–51

Exclusively the blue-shift due to prolonged solvent exposure in the photonic PS microcavities has not been specifically reported so far and it is complex to understand as well. It has been reported previously that H-terminated silicon and porous silicon surfaces treated with methanol, results in the modification of surfaces with chemisorbed methoxy ([triple bond, length as m-dash]Si–O–CH3) species with negligible oxidation at room-temperature.52,53 Similarly, the effect of surface modification on various properties of PS are also reported for molecules such as ethanol, triethylsilanol and formic acid.37,54,55 Such results are usually reflected in surface based optical techniques such as photoluminescence, wherein the solvent sensitive quenching and blue-shift is attributed to the effect of adsorbed molecules on the hydrophilic PS nanopore surfaces, which eventually modify/stabilise the electronic states.56 Hence it is convenient to speculate that native Si[double bond, length as m-dash]Si or Si–H bonds are chemically modified by the adsorbed molecules during the prolonged exposures. As a result, the PS surfaces are chemically modified into easily decomposable low refractive index species such as SiHx (n ∼ 1.405), methoxysilane complex (n ∼ 1.398), silicone (n ∼ 1.405), Si(OH)x, etc. In order to verify this, we have also estimated the effective refractive index from the EMM model, assuming the change in the first medium (change of c-Si to some other low-refractive index forms of silicon) and simulation trends are consistent with our assumption (ESI Fig. 6). Since the refractive index of such a functionalized silicon surface is always less than the c-Si, the effective index of the porous layer is also expected to be lower than un-reacted PS layer.

The reflection spectra for a given PS microcavity recorded after prolonged exposure and recovery to all solvents (methanol, ethanol and 2-propanol) are reproduced in Fig. 6a. The TMM simulations are utilized to reproduce the experimental reflection spectra (Fig. 6b) and the derived effective refractive index values for individual PS layers (n1, n2) are given in Table 2. During the simulations it was assumed that the thickness, porosity and second medium (air, assuming no solvent traces) are unaltered. As seen from the Table 2, the effective refractive index values and the variation with respect to unexposed cavity result does not follow any systematic trend. Therefore, the semi-permanent blue-shift in PS microcavity resonance peak may be attributed to modification of nanopore surfaces by the chemisorbed alcohols. However, such functionalization of inner pores has to be independently verified by other experiments such as PL and FTIR studies.54,55 Further, permanent blue-shift in the photonic bands has been previously reported by several researchers for aged/annealed porous silicon photonic structures,56–60 wherein the shift is attributed to irreversible oxidation effects. During the oxidation of crystalline silicon (c-Si) the effective refractive index decreases and a change in the physical porosities and thickness is also expected. In the present case, the peak position recovery is slow but possible; therefore the oxidation process may not be significant. As a point of note, during the present experiments the prolonged exposure has been mimicked by immersing PS cavities into organic solvents. In a more realistic sensor operation, the PS devices are exposed to solvent vapours of controlled quantities (down to ppm levels) and in such cases the exposure timesscales to observe any variation in the recovered cavity peak will be widely different from the present experiments. Hence for a complete quantification of aforementioned blue-shift and related exposure times for a given PS microcavity, more controlled experiments such as exposing solvent vapours for repeated cycles are needed. Also the mechanism for non-volatile substance sensor dynamics is to be separately investigated. Furthermore, solvent/organic molecules absorption and desorption mechanisms, the reactive nature of the species, and evaporation rate are to be carefully considered.38,54–62


image file: c3ra46515b-f6.tif
Fig. 6 (a) Normalised reflection spectra of a PS microcavity: (i) freshly prepared and spectra (ii)–(iv) are collected after prolonged exposure and after being dried naturally. The solvents are (ii), methanol, (iii) ethanol and (iv) 2-propanol respectively. (b) TMM simulated reflection spectra for the experimental data shown in (a). All the spectra are shifted along Y-axis for clarity.
Table 2 Porous silicon microcavity parameters of the as-prepared microcavity and after prolonged exposure to and recovery from various solvents: resonant cavity peak (λmin), cavity peak shift with respect to unexposed cavity (λ0λ0 = Δλ), n1, n2 are the refractive index values of high, low porosity layers of microcavity estimated from TMM simulations (see text), Δn is the change in the effective refractive index after solvent exposure
Microcavity λmin, Δλ (nm) Estimated values, n1, n2 (±0.01) Estimated Δn, (±0.01)
As prepared 495, — 1.70, 2.29
Exposed to      
Methanol (n = 1.32) 480, (−15) 1.65, 2.23 0.06
Ethanol (n = 1.36) 483, (−12) 1.66, 2.24 0.05
2-propanol (n = 1.38) 479, (−16) 1.65, 2.23 0.06


In general, the present simultaneous and in situ studies reveal many interesting aspects and these studies can be potentially extended to understand several nanoscopic dynamic changes in many other organic species’ detection such as biological events, catalytic reactions and poisonous gas detection etc.

4. Conclusions

Here we have demonstrated the dynamic infiltration mechanism of volatile solvents into PS-based photonic structures from simultaneous optical and electrical measurements. Several PS structures, namely, single porous layers of various porosities, DBR and microcavities are successfully fabricated for the desired wavelengths and tested for various organic solvents. The electrical response is mainly due to the conductivity variation from the PS surfaces of adsorbed solvent molecules, whereas the optical studies are sensitive to the effective refractive index variation throughout the photonic structure. Simultaneous study elicits a fairly good response for all solvents. Both spectral and current responses show consistent reversibility of the measurements. The in situ time-dependent reflection spectral measurements of the PS microcavity during prolonged solvent exposure show marked and complex variation in the resonant cavity peak values, suggesting several dynamics are involved. A clear red-shift in the microcavity resonant peak position has been observed initially, whereas upon prolonged exposure and drying the peak shifts to a lower wavelength to that of the unexposed cavity resonance. The cavity peak red-shift is attributed to the regular solvent detection process, where the change in the effective refractive index due to part filling of organic solvent is mainly responsible. Whereas the unusual blue-shift of cavity resonance after prolonged exposure is attributed to the part-functionalization of porous silicon walls with the organic solvents. All these predictions are well supported by the detailed analysis of transfer matrix simulations and EMA theory. Thus the in situ time-dependent studies, along with consistent theoretical simulations, could be of help in realising potential applications in the static and dynamic detection of biomolecules, toxic gases and organic solvents.

Acknowledgements

This work is supported by the research grants of High-impact Research initiative of IIT Delhi, UK-India Education Research Initiative (UKIERI) projects, Nano Research Facility (MCIT, Govt. India funded) and Department of Science and Technology (DST) grant (SR/S2/CMP-21/2012). The authors appreciate the technical help from Mr. Vindesh Dwivedi, K. Nageswara Rao and Mr. Shahab Ahmad of IIT Delhi.

Notes and references

  1. M. Peters, J. C. Goldschmidt, P. Löper, B. Groß, J. Üpping, F. Dimroth, R. B. Wehrspohn and B. Bläsi, Energies, 2010, 3, 171 CrossRef CAS PubMed.
  2. J. H. Lee, C. Y. Koh, J. P. Singer, S. J. Jeon, M. Maldovan, O. Stein and E. L. Thomas, Adv. Mater., 2014, 26, 532 CrossRef CAS PubMed.
  3. A. Polman and H. A. Atwater, Nat. Mater., 2012, 11, 174 CrossRef CAS PubMed.
  4. H. M. Hiep, H. Yoshikawa, M. Saito and E. Tamiya, ACS Nano, 2009, 3, 446 CrossRef CAS PubMed.
  5. J. Choi and B. T. Cunningham, Lab Chip, 2006, 6, 1373 RSC.
  6. L. Qian, Y. Zheng, J. Xue and P. H. Holloway, Nat. Photonics, 2011, 5, 543 CrossRef CAS.
  7. S. Noda, A. Chutinan and M. Imada, Nature, 2000, 407, 608 CrossRef CAS PubMed.
  8. G. Vijaya Prakash, R. Singh, A. Kumar and R. K. Mishra, Mater. Lett., 2006, 60, 1744 CrossRef PubMed.
  9. N. Tretrault, A. C. Arsenault, A. Mihi, S. wong, V. Kitaev, I. Manners, H. Miguez and G. A. Ozin, Adv. Mater., 2005, 17, 1912 CrossRef.
  10. K. Pradeesh, J. J. Baumberg and G. Vijaya Prakash, Opt. Express, 2009, 17, 22171 CrossRef CAS PubMed.
  11. A. G. Cullis, L. T. Canham and P. D. J. Calcott, J. Appl. Phys., 1997, 82, 909 CrossRef CAS PubMed.
  12. O. Bisi, S. Ossicini and L. Pavesi, Surf. Sci. Rep., 2000, 38, 1 CrossRef CAS.
  13. P. Bettotti, M. Cazzanelli, L. D. Negro, B. Danese, Z. Gaburro, C. J. Oton, G. Vijaya Prakash and L. Pavesi, J. Phys.: Condens. Matter, 2002, 14, 8253 CrossRef CAS.
  14. V. K. Dwivedi, K. Pradeesh and G. Vijaya Prakash, Appl. Surf. Sci., 2011, 257, 3468 CrossRef CAS PubMed.
  15. P. Pirasteh, J. Charrier, Y. Dumeige, A. Chaillou, M. Guendouz and L. Haji, Appl. Surf. Sci., 2007, 253, 3440 CrossRef CAS PubMed.
  16. N. Gutman, D. Lubarski and A. Sa'ar, Phys. Status Solidi C, 2009, 6, 1634 CrossRef CAS.
  17. C. Chen, Y. Zhu, H. Bao, J. Shen, H. Jiang, L. Peng, X. Yang, C. Li and G. Chen, Chem. Commun., 2011, 47, 5530 RSC.
  18. H. Qiao, B. Guan, T. Böcking, M. Gal and J. J. Gooding, Appl. Phys. Lett., 2010, 96, 161106 CrossRef PubMed.
  19. C. Vinegoni, M. Cazzanelli and L. Pavesi, Silicon-Based Materials and Devices, Academic Press, 2001, vol. 2, ch. 4, p. 123 Search PubMed.
  20. P. N. Patel, V. Mishra and A. K. Panchal, Adv. Nat. Sci.: Nanosci. Nanotechnol., 2012, 3, 035016 CrossRef.
  21. H. J. Kim, Y. Y. Kim, K. W. Lee and S. H. Park, Sens. Actuators, B, 2011, 155, 673 CrossRef CAS PubMed.
  22. J. M. Lauerhaas, G. M. Credo, J. L. Heinrich and M. J. Sailor, J. Am. Chem. Soc., 1992, 114, 1911 CrossRef CAS.
  23. G. Palestino, R. Legros, V. Agarwal, E. Pérez and C. Gergely, Sens. Actuators, B, 2008, 135, 27 CrossRef CAS PubMed.
  24. E. Pinèík, M. Jergel, J. Bartoš, C. Falcony and M. Kuèera, Superficies Vacio, 1999, 9, 78 Search PubMed.
  25. S. Dhanekar, S. S. Islam, T. Islam, A. K. Shukla and Harsh, Physica E, 2010, 42, 1648 CrossRef CAS PubMed.
  26. S. K. Ghoshal, M. R. Sahar and M. S. Rohani, J. Korean Phys. Soc., 2011, 58, 256 CrossRef CAS.
  27. Z. Gaburro, N. Daldosso, L. Pavesi, G. Faglia, C. Baratto and G. Sberveglieri, Appl. Phys. Lett., 2001, 78, 3744 CrossRef CAS PubMed.
  28. N. Lorrain, M. Hiraouia, M. Guendouz and L. Haji, Mater. Sci. Eng., B, 2011, 176, 1047 CrossRef CAS PubMed.
  29. G. M. Youssef, Egypt. J. Sol., 2001, 24, 227 Search PubMed.
  30. D. Mangaiyarkarasi, M. B. H. Breese, Y. S. Ow and C. Vijila, Appl. Phys. Lett., 2006, 89, 021910 CrossRef PubMed.
  31. L. D. Stefano, L. Rotiroti, E. D. Tommasi, I. Rea, I. Rendina, M. Canciello, G. Maglio and R. Palumbo, J. Appl. Phys., 2009, 106, 023109 CrossRef PubMed.
  32. S. Dhanekar, S. S. Islam, T. Islam and Harsh, Int. J. Smart Sens. Intell. Syst., 2010, 3, 1 CAS.
  33. L. T. Canham, Appl. Phys. Lett., 1993, 63, 337 CrossRef CAS PubMed.
  34. J. A. Glass, E. A. Wovchko and J. T. Yates, Surf. Sci., 1995, 338, 125 CrossRef.
  35. I. Sochecchter, M. Ben-Chorin and A. Kux, Anal. Chem., 1995, 67, 3727 CrossRef.
  36. K. Watanabe, T. Okada, I. Choe and Y. Sato, Sens. Actuators, B, 1996, 33, 194 CrossRef CAS.
  37. E. Galeazzo, H. E. M. Peres, G. Santos, N. Peixoto and F. J. Ramirez-Fernandez, Sens. Actuators, B, 2003, 93, 384 CrossRef CAS.
  38. H. Saha, Int. J. Smart Sens. Intell. Syst., 2008, 1, 34 CAS.
  39. V. M. Aroutiounian and M. Z. Ghulinyan, Phys. Status Solidi A, 2003, 197, 462 CrossRef CAS.
  40. M. Ben-Chorin, F. Moiler and F. Kochal, Phys. Rev. B: Condens. Matter Mater. Phys., 1994, 49, 2981 CrossRef CAS.
  41. S. P. Zimin, Semiconductors, 2000, 34, 353 CrossRef CAS.
  42. L. Pavesi and V. Mulloni, J. Lumin., 1999, 80, 43 CrossRef.
  43. D. B. Dimitrov, Phys. Rev. B: Condens. Matter Mater. Phys., 1995, 51, 1562 CrossRef CAS.
  44. V. S. Y. Lin, K. Motesharei, K. P. S. Dancil, M. J. Sailor and M. R. Ghadiri, Science, 1997, 278, 840 CrossRef CAS.
  45. M. Archera, M. Christophersen and P. M. Faucheta, Sens. Actuators, B, 2005, 106, 347 CrossRef PubMed.
  46. H. F. Okorn-Schmidt, IBM J. Res. Dev., 1999, 43, 351 CrossRef CAS.
  47. S. J. Kim, S. H. Lee and C. J. Lee, J. Phys. D: Appl. Phys., 2001, 34, 3505 CrossRef CAS.
  48. H. Ouyang and P. M. Fauchet, SPIE Optics East, 2005 Search PubMed.
  49. L. Rotiroti, L. D. Stefano, I. Rendina, L. Moretti, A. M. Rossi and A. Piccolo, Biosens. Bioelectron., 2005, 20, 2136 CrossRef CAS PubMed.
  50. R. Pernice, G. Adamo, S. Stivala, A. Parisi, A. C. Busacca, D. Spigolon, M. A. Sabatino, L. D. Acquisto and C. Dispenza, Opt. Mater. Express, 2013, 3, 1820 CrossRef CAS.
  51. B. H. King, T. Wong and M. J. Sailor, Langmuir, 2011, 27, 8576 CrossRef CAS PubMed.
  52. X. Y. Hou, G. Shi, W. Wang, F. L. Zhang, P. H. Hao, D. M. Huang and X. Wang, Appl. Phys. Lett., 1993, 62, 1097 CrossRef CAS PubMed.
  53. E. Bateman, B. R. Horrocks and A. Houlton, J. Chem. Soc., Faraday Trans., 1997, 93, 2427 RSC.
  54. T. Gao, J. Gao and M. J. Sailor, Langmuir, 2002, 18, 9953 CrossRef CAS.
  55. E. J. Lee, J. S. Ha and M. J. Sailor, Mater. Res. Soc. Symp. Proc., 1994, 358, 387 CrossRef.
  56. J. M. Lauerhaas and M. J. Sailor, Science, 1993, 261, 1567 CAS.
  57. L. Debargea, J. P. Stoquert, A. Slaoui, L. Stalmans and J. Poortmans, Mater. Sci. Semicond. Process., 1998, 1, 281 CrossRef.
  58. V. Mulloni and L. Pavesi, Mater. Sci. Eng., B, 2000, 69–70, 59 CrossRef.
  59. L. F. Rao and J. T. Yates, Surface Chemistry of Hydrogen-Passivated Porou Silicon Oxidation of Surface SI-i-H groups by Acetone, NR413EOO1, Office of Naval Research, Pittsburgh, PA, 1993 Search PubMed.
  60. X. Y. Hou, G. Shi, W. Wang, F. L. Zhang, P. H. Hao, D. M. Huang and X. Wang, Appl. Phys. Lett., 1993, 62, 1097 CrossRef CAS PubMed.
  61. G. Amato, C. Delerue and H. J. Von Bardeleben, Structural and Optical properties of Porous Silicon Nanostructures, Gordon and Breach Science, 1997 Search PubMed.
  62. L. D. Stefano, K. Malecki, F. G. Della Corte, L. Moretti, I. Rea, L. Rotiroti and I. Rendina, Sensor, 2006, 6, 680 CrossRef PubMed.

Footnote

Electronic supplementary information (ESI) available: Scanning electron microscopy (SEM) images and other optical and electrical data. See DOI: 10.1039/c3ra46515b

This journal is © The Royal Society of Chemistry 2014
Click here to see how this site uses Cookies. View our privacy policy here.