Ni/H-ZSM-5 as a promising catalyst for vapour phase hydrogenation of levulinic acid at atmospheric pressure†
Varkolu Mohan,
Chakali Raghavendra,
Chodimella Venkata Pramod,
Burri David Raju and
Kamaraju Seetha Rama Rao*
Indian Institute of Chemical Technology, Hyderabad, India. E-mail: ksramarao@iict.res.in
First published on 17th December 2013
Abstract
Among Ni supported on H-ZSM-5 catalysts with various loadings of Ni, a catalyst with 30 weight% Ni has been identified as an effective catalyst for the hydrogenation of levulinic acid to γ-valerolactone in vapour phase at atmospheric pressure. The catalysts have been characterized by different techniques such as XRD, BET surface area, pore size distribution, TPR, AAS, pulse chemisorption, FE-SEM-EDS, TEM, XPS and pyridine-adsorbed IR. XRD patterns suggest that the structure of H-ZSM-5 is intact even after incorporation of Ni. Pyridine-adsorbed IR patterns reveal the presence of both Lewis and Brønsted acid sites, which are responsible for the dehydration and cleavage of γ-valerolactone. The superior activity exhibited by the 30 wt% Ni/H-ZSM-5 catalyst (demonstrating the highest productivity of 0.9090 kgGVL kgcatalyst−1 h−1 at 250 °C) is due to the presence of a greater number of surface Ni species. Non-noble metal Ni-based catalysts offer advantages over the present processes involving Ru-based catalysts, which have certain constraints, some of which are unavoidable such as cost ineffectiveness, the use of volatile organic solvents and high pressure operation. The 30 wt% Ni/H-ZSM-5 catalyst can be seen as an alternative and promising catalyst which could be of great importance to the chemical industry.
1. Introduction
Due to a decline in the reserves of non-renewable fuels, biomass is regarded as one of the renewable sources for the production of fuels. In this regard, researchers have focused their attention towards the production of fuels from biomass and/or biomass derivatives. In this regard, the U.S. and European Union governments are planning to produce 20% of fuels and 25% of chemicals from renewable sources by 2030.1–3 Biomass is the fourth largest source of energy in the world after coal, petroleum oil and natural gas and provides about 14% of the world's energy requirements.4 It is also considered an alternative feedstock source for the production of commodity chemicals. According to the U.S. Department of Energy, levulinic acid (one of the top 12 biomass-derived compounds) is one of the most promising candidates for the production of chemicals.5,6Cellulosic biomass (a non-food renewable source) normally consists of biopolymeric species such as cellulose (35–50%), hemicellulose (15–25%) and lignin (15–30%). Acidic hydrolysis of cellulosic biomass gives levulinic acid, formic acid, furfural and char.7–11 Therefore, biomass-derived levulinic acid (LA) is an effective feedstock for the production of γ-valerolactone (GVL). GVL has several uses in solvents, insecticides, adhesives etc.12–14 Furthermore, GVL is a potential candidate for the production of fine chemicals, fuels and fuel additives.12,15–21 A key step in the production of levulinic acid is the acid hydrolysis of furfuryl alcohol, which is obtained from an abundant source of biomass and also from the extraction of black liquor in the paper-making process.22 Few researchers have studied the direct conversion of biomass and biomass-derived platform molecules to GVL.23,24 GVL serves as an intermediate for the production of diesel fuel and the production of branched alkanes with molecular weights appropriate for jet fuel. Approximately 50 kg of diesel/fuel can be formed per 100 kg of GVL. Alternatively, GVL can undergo catalytic conversion to produce butane and CO2, combining with butene oligomerization to form C8–C20 alkenes. It can also undergo ring-opening and reduction steps to form pentanoic acid, followed by ketonization to form 5-nonanone, and finally completed by hydrodeoxygenation to form nonane.
Christian et al. studied the liquid phase hydrogenation of LA under batch conditions using a Raney® Ni catalyst at 220 °C and 48 bar hydrogen pressure and over copper chromite at 250 °C and 220 bar hydrogen pressure.25 Schutte et al. reported LA hydrogenation over a platinum oxide catalyst in various organic solvents at 3 bar hydrogen pressure at room temperature.26 A patent filed by Manzer discloses the hydrogenation of LA in supercritical CO2 over Pt, Pd, Ru and Re catalysts supported over various oxides at 200 °C and 200 bar hydrogen pressure in 1,4-dioxane solvent.27 Similarly, Bourne et al. utilised supercritical CO2 for LA hydrogenation over Ru/SiO2 at 200 °C in 100 bar hydrogen pressure.28 Yan et al. used Ru/C in a batch reactor at 130 °C and 12 bar hydrogen pressure to yield GVL.29 Pt/TiO2 or Pt/ZrO2 catalysts have also been reported for the hydrogenation of levulinic acid at 200 °C, 40 bar H2 with a H2/LA molar ratio of 5:1, to obtain a greater amount of GVL.8 Dumesic et al. investigated LA hydrogenation over Ru/C and Ru–Sn/C at 180 °C and 35 bar hydrogen pressure.30,31 Recently, Galletti et al. reported a higher yield of GVL at 70 °C and 30 bar hydrogen pressure over a Ru/C catalyst using an ion exchange resin (Amberlyst A70) as a co-catalyst.32 Hengue et al. reported using Cu on various supports to obtain GVL at 200 °C and 35 bar pressure.33
It is interesting to note that most of them reported the use of batch conditions at very high H2 pressures. Only a few reports have been published describing experiments in the vapour phase at atmospheric pressure.34,35 However, 1,4-dioxane is used as a feed additive in all of these works.
The present investigation highlights the application of zeolite (H-ZSM-5) supported Ni catalysts to obtain GVL with high productivity via LA hydrogenation in the vapour phase without any feed additive at atmospheric pressure.
2. Experimental
2.1. Catalyst preparation
H-ZSM-5 (Si/Al = 40) was purchased from Süd Chemie India Pvt. Limited. Ni/H-ZSM-5 catalysts with various Ni loadings were prepared by a wet impregnation method. An aqueous solution containing the requisite amount of Ni(NO3)2·6H2O salt (AR grade obtained from Loba Chemie, India) was added to the support particles in a beaker, which was then placed on a hot plate with stirring at 80 °C to remove the excess water. The prepared solid mass was dried for 12 h at 100 °C and then calcined at 450 °C for 5 h in air. The catalysts so prepared were designated as xNHZ where x represents the loading of Ni in wt%.2.2. Catalyst characterisation
XRD patterns of the catalysts were recorded with an Ultima-IV X-ray diffractometer (Rigaku Corporation, Japan) using Ni filtered Cu Kα radiation (λ= 1.5406 Å) with a scan speed of 4° min−1 and a scan range of 2–80° at 40 kV and 20 mA. Surface area, pore volume and pore size of all the catalysts were obtained from N2 adsorption–desorption isotherms measured at −196 °C (ASAP 2020, Micromeritics, USA). The surface area of the catalysts was determined by the Brunauer, Emmett, and Teller (BET) equation whereas the pore size was measured by the Barret–Joyner–Halenda (BJH) method. Prior to the adsorption–desorption isotherms, the catalysts were degassed under vacuum (10−6 torr) at 150 °C for 3 h to remove the physisorbed moisture. The total pore volume (Vp) was determined from the isotherms at a relative pressure (P/P0) of 0.98.Field Emission Scanning Electron Microscopy (FE-SEM) (S-4800, Hitachi Company, Japan) along with Energy Dispersive X-ray analysis (EDS) (LINK ISIS-300, Oxford Instruments) was used to study the morphology as well as the composition of H-ZSM-5 supported Ni catalysts, respectively. The Ni content of the catalysts was also estimated by dissolving a known amount of catalyst in aqua regia followed by dilution with water and by using atomic absorption spectroscopy (AAS) (A-300, PerkinElmer, Germany). For the quantification of Ni, a 10 ppm Ni solution was used. FTIR spectra were recorded on a GX spectrometer (PerkinElmer, Germany) with a scan range of 4000–400 cm−1. The samples were finely ground in the ratio 1![[thin space (1/6-em)]](https://www.rsc.org/images/entities/char_2009.gif) :
:![[thin space (1/6-em)]](https://www.rsc.org/images/entities/char_2009.gif) 10 (sample
10 (sample![[thin space (1/6-em)]](https://www.rsc.org/images/entities/char_2009.gif) :
:![[thin space (1/6-em)]](https://www.rsc.org/images/entities/char_2009.gif) KBr) and pelletized then measured in the spectral range of 400–4000 cm−1 with a resolution of 4 cm−1, and 10 scans were recorded for each spectrum. For pyridine-adsorbed FTIR analysis, the sample was oven dried at 100 °C for 1 h. To the oven dried sample (50 mg), 0.1 ml of pyridine was admixed directly. To remove the physisorbed pyridine present in the sample, the admixed sample tube was then kept in a vacuum oven at 120 °C for 1 h. After ice cooling to room temperature, the spectrum was recorded with a nominal resolution of 4 cm−1 in the spectral range of 1400–1700 cm−1 using a KBr background and 10 scans were recorded for each spectrum.36
KBr) and pelletized then measured in the spectral range of 400–4000 cm−1 with a resolution of 4 cm−1, and 10 scans were recorded for each spectrum. For pyridine-adsorbed FTIR analysis, the sample was oven dried at 100 °C for 1 h. To the oven dried sample (50 mg), 0.1 ml of pyridine was admixed directly. To remove the physisorbed pyridine present in the sample, the admixed sample tube was then kept in a vacuum oven at 120 °C for 1 h. After ice cooling to room temperature, the spectrum was recorded with a nominal resolution of 4 cm−1 in the spectral range of 1400–1700 cm−1 using a KBr background and 10 scans were recorded for each spectrum.36
The textural characteristics of the catalysts were obtained using a JEOL JEM 2000EXII transmission electron microscope, operating between 160 and 180 kV. The specimens were prepared by dispersing the samples in methanol using an ultrasonic bath and evaporating a drop of the resultant suspension onto a lacey carbon support grid.
Temperature programmed reduction (TPR) of the catalysts was performed on an AUTOSORB-iQ automated gas sorption analyser (Quantacrome instruments, USA). About 50 mg of the catalyst was placed in a quartz reactor and pre-treated in a He flow at 393 K for 1 h. Later, the catalyst was treated with 5% H2–Ar mixture gas (3600 cm3 h−1) with a temperature ramp of 20 °C min−1. The hydrogen consumption was monitored using a thermal conductivity detector (TCD).
H2-chemisorption using a pulse (100 μL) titration procedure was carried out at 40 °C on an Autosorb-iQ automated gas sorption analyser (Quantachrome Instruments, USA) to determine the dispersion and metal particle size, and metal surface area of the catalyst. Prior to the experiment, the catalyst was reduced at 500 °C for 2 h followed by evacuation for 2 h. The monolayer uptake, active metal surface area, metal dispersion, and active crystallite size were calculated.37–39
Monolayer uptake of hydrogen in micromoles per gram was calculated by
| Nm = 44.61Vm |
| AMSA = NmSAm/166 |
Metal dispersion (D) was calculated by:
| D = NmSM/100L |
Active crystallite size was obtained by:
| t (nm) = 100Lf/(AMSA × Z) |
The XPS analysis was performed using a KRATOS AXIS 165 apparatus equipped with a dual anode (Mg and Al) using a Mg Kα source. The non-monochromatized Al Kα X-ray source (hν = 1486.6 eV) was operated at 12.5 kV and 16 mA. Analysis was done at room temperature and prior to analysis the samples were maintained under a rigorous vacuum, typically in the order of 10−8 Pa to avoid the presence of contaminates. All binding energies measured were within an accuracy of ± 0.2 eV. For energy calibration, the carbon 1s binding energy was taken as a reference value of 284.6 eV .
2.3. Catalytic activity
1 g of the catalyst particles was sandwiched between the two quartz wool plugs placed at the middle of a fixed bed tubular reactor made of glass (250 mm long and 12 mm i.d.). Prior to the reaction, the catalyst was reduced for 4 h at 773 K. The reaction was carried out in the temperature range of 523–568 K with a liquid feed flow rate of 1 cm3 h−1 using H2 as a carrier (H2/LA = 5.5). The reaction products were collected at regular intervals of temperature in an ice cooled trap and analyzed by a Flame Ionization Detector (FID) equipped gas chromatograph, GC-17A (Shimadzu Instruments, Japan) with an OV-1 capillary column (30 m length, 0.53 mm i.d.) and confirmed by GC-MS, QP 5050A (Shimadzu Instruments, Japan).3. Results and discussion
XRD patterns of the H-ZSM-5 (HZ) and reduced NHZ catalysts are shown in Fig. 1. The reflections (2θ = 7.9, 8.8, 23.0, 23.2, 23.6, 23.9 and 24.4°) correspond to HZ in the NHZ catalysts indicating the intactness of the zeolite structure even after the loading of metal. All the reduced catalysts showed XRD reflections at 44.49° (111), 51.85° (200) and 76.38° (220) corresponding to metallic Ni with a face-centred cubic geometry of the space group Fm3m (225) with a cell parameter of 3.523 Å (ICDD. No. 87–0712). The intensity of these peaks increased as the Ni loading in the catalyst increased. The crystallite sizes (d) of a series of catalysts were calculated using the Debye–Scherrer formula from their full width at half maximum (FWHM) values. The crystallite sizes of all the Ni catalysts are presented in Table 1.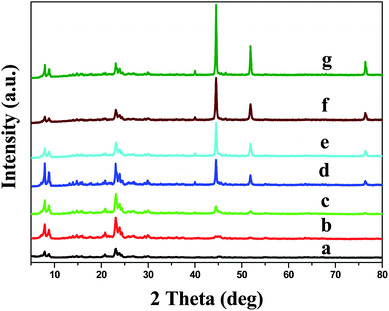 | ||
| Fig. 1 XRD profiles of reduced Ni/H-ZSM-5 catalysts (a) HZ, (b) 5NHZ, (c) 10NHZ, (d) 20NHZ, (e) 30NHZ, (f) 40NHZ and (g) 50NHZ. | ||
| Catalyst | SBET (m2 g−1) | Vp (cm3 g−1) | Dp (Å) | d (nm) | EDS composition (wt%) | AAS composition (wt%) |
|---|---|---|---|---|---|---|
| HZ | 305.6 | 0.21 | 27.3 | — | — | — |
| 5NHZ | 292.8 | 0.20 | 26.8 | 9.82 | 4.8 | 4.1 |
| 10NHZ | 274.2 | 0.16 | 23.1 | 10.09 | 8.3 | 8.7 |
| 20NHZ | 215.9 | 0.16 | 28.7 | 10.39 | 15.5 | 16.7 |
| 30NHZ | 209.1 | 0.15 | 28.2 | 11.03 | 28.9 | 29.6 |
| 40NHZ | 173.5 | 0.11 | 25.8 | 11.39 | 33.0 | 32.4 |
| 50NHZ | 161.5 | 0.12 | 30.7 | 12.17 | 36.1 | 38.5 |
Fig. 2 depicts the N2 adsorption–desorption isotherms of H-ZSM-5 with various loadings of Ni supported on the H-ZSM-5. The nitrogen adsorption isotherms of the catalysts show the presence of a hysteresis loop, associated with capillary condensation, which indicates the formation of a mesoporous structure (secondary pores).40 The surface area (SBET), pore volume (Vp) and average pore size (Dp) of the samples are given in Table 1. The surface area of H-ZSM-5 is 305.6 m2 g−1 and the pore volume is 0.21 cm3 g−1. However, there is a marginal decrease in surface area from 292.8 to 161.5 m2 g−1 and in the pore volume from 0.20 to 0.11 cm3 g−1 as the Ni loading increases from 5 to 50 wt% due to pore blockage by Ni particles. The blockage of pores by Ni creates a strain on the structure of the zeolite that results in changes to the isotherms.41 In addition to the blockage of H-ZSM-5 pores by NiO particles, extra porosity due to NiO particles might have resulted. Because of this, the average pore diameter remains the same with loading. As can be seen from the XRD results, there is no significant change in the structural properties of the zeolite.
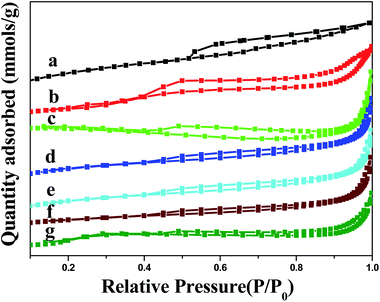 | ||
| Fig. 2 N2 adsorption–desorption profiles of Ni/H-ZSM-5 catalysts (a) HZ, (b) 5NHZ, (c) 10NHZ, (d) 20NHZ, (e) 30NHZ, (f) 40NHZ and (g) 50NHZ. | ||
The TPR profiles of the catalysts are shown in Fig. 3. The peak observed at higher temperature for the 5NHZ sample indicates the presence of strong metal–support interactions, and the intensity of this phenomenon decreases as the metal loading increases for subsequent catalysts of the series. The peak at 500 °C can be ascribed to the reduction of smaller NiO particles and the other (low temperature signal at a Tmax of 400 °C) due to bulk NiO.42 Maia et al. compared the reduction patterns of Ni/H-ZSM-5 prepared by different methods such as impregnation and ion exchange method and concluded that if any H+ is exchanged by the incorporated Ni2+ in the zeolite, this could be reduced at a higher temperature than that located outside the zeolite.43 In addition, Pawelec et al. anticipated that nickel distributed in the zeolite was reduced above 630 °C, at the same time as the reduction of nickel oxide started around 500 °C.44,45 These results suggest that in all our prepared catalysts, NiO is located predominantly outside the zeolite, which was clearly indicated by the XRD patterns (preservation of zeolite structure in all the catalysts). To the best of our knowledge, in previous studies, various domains were suggested such as <500 °C, 500–630 °C and >630 °C. Among which, <500 °C could be assigned to the reduction of NiO, the 500–630 °C zone corresponds not only to smaller Ni particles but also to Ni oligomeric species and >630 °C might be due to Ni2+ in the zeolite.46 In the present case, no such peak was observed at higher temperature, which clearly demonstrates that Ni resides predominantly outside the zeolite.
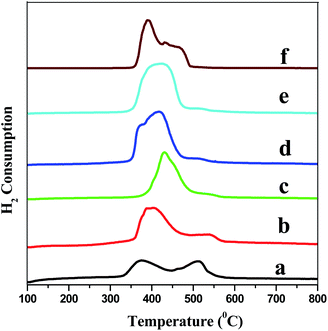 | ||
| Fig. 3 TPR profiles of Ni/H-ZSM-5 catalysts (a) 5NHZ, (b) 10NHZ, (c) 20NHZ, (d) 30NHZ, (e) 40NHZ and (f) 50NHZ. | ||
FE-SEM pictures (depicted in Fig. S1†) show a cubic shaped morphology. The composition of Ni obtained from EDS patterns (depicted in Fig. S2†) and AAS is very close to the theoretical value up to 30 wt% Ni (shown in Table 1). In the impregnation method, the deposition of metal/metal oxide on a support is generally limited beyond a certain amount. In the present case, 30 wt% appears to be a limiting value. It depends on the nature of the metal and the porosity of the support.
Transmission electron microscopy (TEM) and selected area electron diffraction (SAED) images of the reduced and used catalysts of 30NHZ (depicted in Fig. S3†) indicate that the average particle size of the reduced and used catalysts calculated by Image-J software were 10.98 nm and 11.74 nm, respectively, which is close to the particle size obtained from pulse chemisorption (9.22 nm) and also from the XRD (11.03 nm). The SAED pattern of Ni indicates the presence of regular spots and also fringes attributed to the crystalline Ni with fcc structure as reported by Wu et al. (confirmed from the XRD).47
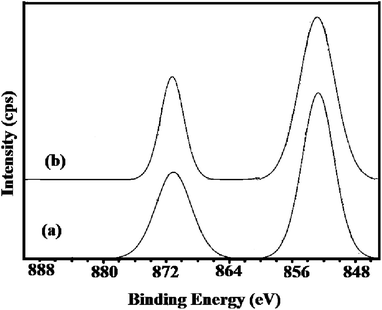
The XPS spectra of Ni species in the reduced and used catalysts are shown in Fig. 4. In the case of the reduced catalyst, two major peaks are observed with binding energies (BE) of 852.5 eV (69.4%) and 869.7 eV (30.6%), corresponding to the core level Ni 2p3/2 and Ni 2p1/2 transitions, while in the case of the used catalyst, two major peaks are observed with BEs of 852.3 eV (70.7%) and 870.3 eV (29.3%), respectively, indicating the presence of nickel in the metallic state.48 The BE values are consistent with the literature reported by Xiao et al.49 No satellite peak was observed with either of the catalysts. The difference between the two peaks (17.2 eV for the reduced and 18 eV for the used) is very close to that reported by Xiao et al.49
Fig. 5 illustrates the FTIR patterns when various loadings of Ni were impregnated on the HZ. The significant broad bands at 1230 cm−1, 1100 cm−1 and 796 cm−1 are attributed to the Si–O–Si asymmetric and symmetric stretching frequencies as well as internal stretching frequencies of the zeolite. The band at 1637 cm−1 is associated with H–O–H for all the catalysts. The absorption bands around 543 and 450 cm−1 are characteristic of the ZSM-5 crystalline structure.50
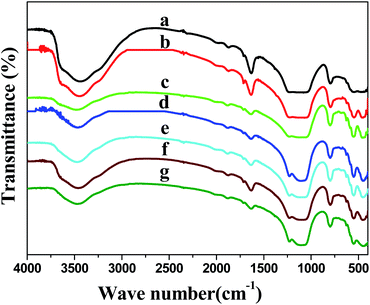 | ||
| Fig. 5 FT-IR profiles of Ni/H-ZSM-5 catalysts (a) HZ, (b) 5NHZ, (c) 10NHZ, (d) 20NHZ, (e) 30NHZ, (f) 40NHZ and (g) 50NHZ. | ||
Fig. 6 shows Py-IR spectra of the catalysts at room temperature, used to investigate the acidity of the catalysts. The bands at 1445, 1595 and 1612 cm−1 are attributed to the adsorption of pyridine coordinated on Lewis acid sites created by metallic Ni as well as the support.51–54 The band appearing at 1490 cm−1 is ascribed to the vibration frequency of the pyridine ring on Brønsted and Lewis acid sites51,52 created by both Ni and the support. In addition, IR bands near 1545 and 1637 cm−1 are due to pyridinium ions formed by the abstraction of a proton from the catalyst support.51,52 The above observations reveal that both Brønsted and Lewis acid sites are present on these catalysts in which one or both may be responsible for the formation of GVL.
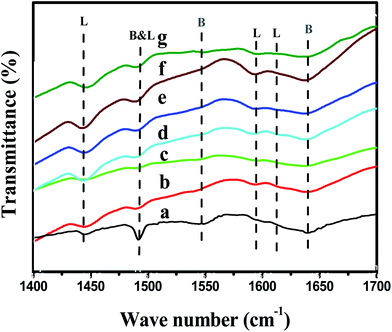 | ||
| Fig. 6 Py-IR profiles of Ni/H-ZSM-5 catalysts (a) HZ, (b) 5NHZ, (c) 10NHZ, (d) 20NHZ, (e) 30NHZ, (f) 40NHZ and (g) 50NHZ. | ||
It is also a well-known fact that Ni favours the hydrogenation reaction. In previous reports, Ni (111) was demonstrated to be active for the hydrogenation reaction.55 To further clarify the formation of GVL, we carried out the reaction of angelica lactone (obtained from the dehydration of LA over HZM-5) over Ni and observed the formation of GVL and minor quantities of valeric acid. Hence, one can assume that Ni is responsible for GVL formation by the hydrogenation of an intermediate, angelica lactone.
Pulse chemisorption studies were conducted for all the catalysts and the data compiled in Table 2. We observed that the hydrogen uptake increases correspondingly with the Ni loading up to 30NHZ. Thereafter, the uptake value decreased due to a decrease in the number of surface Ni species which form bulk Ni. The average particle size and dispersion are in good agreement with each other.
| Catalyst | Nm (μmol g−1) | AMSA (m2 gNi−1) | t (nm) | D (%) |
|---|---|---|---|---|
| 5NHZ | 74.79 | 117.01 | 5.76 | 17.56 |
| 10NHZ | 137.80 | 107.79 | 6.25 | 16.17 |
| 20NHZ | 218.00 | 85.27 | 7.90 | 12.79 |
| 30NHZ | 280.30 | 73.09 | 9.22 | 10.97 |
| 40NHZ | 231.76 | 45.32 | 14.87 | 6.80 |
| 50NHZ | 190.68 | 29.83 | 22.59 | 4.48 |
3.1. Catalytic activity
According to the literature,56–59 the formation of GVL follows either of the two mechanisms (path I and II) shown in the scheme in Fig. 7.. The selection of Ni (non-noble metal) supported on H-ZSM-5 (acid support) is because of the fact that the reaction proceeds through dehydration–cyclisation followed by hydrogenation on acidic and metallic sites, respectively.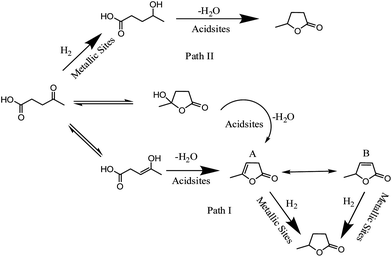 | ||
| Fig. 7 Reported LA hydrogenation reaction pathways.56–59 | ||
To gain insight into the reaction pathway, we have carried out the reaction over H-ZSM-5 (51% conversion of LA and selectivity to alpha angelica lactone (A) is 71% and to beta angelica lactone (B) is 29%) that contains Brønsted as well as Lewis acid sites confirmed by pyridine adsorption studies, obtained angelica lactone (A) which isomerised to angelica lactone (B), which on further hydrogenation over Ni gave the target molecule. It is reported that the formation of angelica lactone has been observed over acid catalysts.60,61 Hence, we believe that the reaction proceeds via path I as shown in the scheme. In a similar manner, Galletti et al. studied the role of the acid as a co-catalyst to understand the reaction pathway.32 In our case, we monitored the reaction with GC-MS to confirm the reaction intermediates by carrying out the reaction on the support only, as well as on a Ni-incorporated support.
The presence of angelica lactone (A & B) confirms the pathway of the reaction and GVL formation confirms the further hydrogenation of angelica lactone to yield the desired product. Very recently, W. Luo et al. reported the influence of the support by comparing the acidity of H-ZSM-5, H-β, TiO2 and ZrO2 for the levulinic acid hydrogenation.62
3.2. Effect of temperature
In order to determine the optimum loading of Ni and also the influence of the temperature on the H-ZSM-5 support, the hydrogenation of biomass-derived levulinic acid to γ-valerolactone was carried out with all the prepared catalysts (5NHZ, 10NHZ, 20NHZ, 30NHZ, 40NHZ and 50NHZ) with the molar ratio 5.5 (H2/LA) in the vapour phase in the range of 250–295 °C and the data is shown in Fig. 8. The results show an increase in conversion of LA from 70 to 90% with an increase in Ni loading from 5 to 30 wt% due to an increase in the surface Ni species (Table 2) which are responsible for the hydrogenation of the levulinic acid. However, the decrease in conversion with an increase in loading of Ni beyond 30 wt% is ascribed to the formation of larger Ni species (confirmed from the pulse chemisorption results). Similarly, the yield also follows the same trend as conversion which clearly indicates that surface Ni species are playing a pivotal role in catalytic performance. The 30NHZ catalyst provided the optimum performance.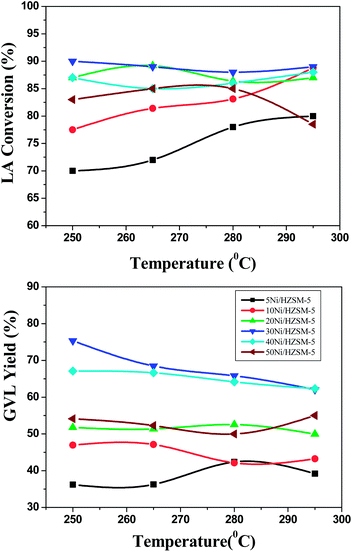 | ||
| Fig. 8 Effect of temperature and Ni loading on levulinic acid hydrogenation with various NHZ catalysts. | ||
3.3. Effect of H2/LA molar ratio
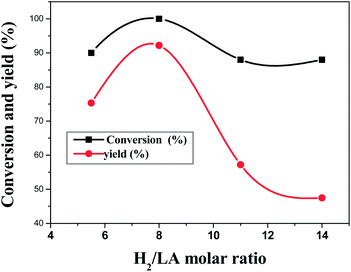
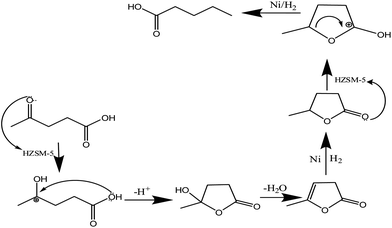
Having optimized the catalyst composition, the effect of the H2 to LA molar ratio in the feed was studied (Fig. 9). As the molar ratio increases from 5.5 to 8, the conversion increases from 90–100%. Furthermore, the yield of the γ-valerolactone increases from 75.3 to 92.2%. Further increases in the molar ratio to 11 and 14 result in a decline in the conversion and yield. This is not only due to a decrease in residence time but also due to cleavage of γ-valerolactone to give pentanoic acid (Fig. 10). These products were confirmed by GC-MS. Similar results were included in a patent application.63 Similarly, W. Luo et al. have reported the influence of the support by comparing H-ZSM-5, H-β, TiO2 and ZrO2 supported Ru catalysts for levulinic acid hydrogenation62 where they observed the maximum yield of pentanoic acid over H-ZSM-5 and H-β supported Ru catalysts.To gain further insight into the mechanism, the reaction was carried out by pumping a larger quantity of reactants (liquid feed (LA) = 5 cm3 h−1, H2/LA = 5.5) over 1 g of catalyst and 85% conversion of LA was observed along with a 54% yield of GVL, a 16.9% yield of angelica lactone (A), a 7.9% yield of angelica lactone (B) and minor quantities of valeric acid. Hence, we believe that the reaction is propagating in a sequence of steps. So, we proposed the mechanism in our own way as shown in Fig. 10.
Furthermore, we carried out the reaction over Ni/SiO2 and Ni/Al2O3 (prepared by a wet impregnation method) which resulted in lower yields than with the Ni/HZM-5 catalyst at a H2/LA molar ratio of 8. The yields over Ni/SiO2 and Ni/Al2O3 were 87 and 83% with complete conversion, respectively.
3.4. Effect of time-on-stream
Time-on-stream studies were conducted for 5 h over the 30NHZ catalyst at 250 °C and a ratio of H2/LA = 8. The results are shown in Fig. 11. From the 3rd hour, there is a slight decrease in the activity which may be due to catalyst deactivation by water produced during the reaction or by fouling agents like angelica lactone formed as an intermediate.64 There is also a chance that the coke (∼2%) formed during the reaction may also contribute to the deactivation. Further work is needed to overcome deactivation during the time on stream.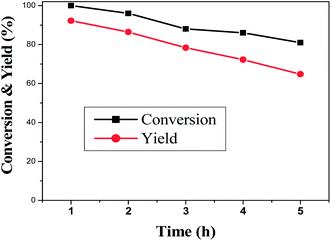 | ||
| Fig. 11 Effect of time-on-stream on levulinic acid hydrogenation over 30NHZ catalyst at 250 °C and a ratio of H2/LA = 8. | ||
3.5. Productivity
The productivity was calculated byThe productivity of other reported catalysts were also calculated and compared with our results and summarized in Table 3. Upare et al. reported a 98.6% yield of GVL over 5% Ru/C while the yield of GVL was 90 and 30% over 5%Pd/C and 5%Pt/C, respectively, at atmospheric pressure.34 Though the yields are good over Ru/C, the feed was diluted (10% LA in 1,4-dioxane) with a solvent (1,4-dioxane). As well as being a highly cost effective non-noble metal catalyst, the productivity of our catalyst is twice that of Ru/C catalyst, whereas the productivity of other catalysts follows the order 5% Cu/SiO2 > 5%Pd/C > 5%Pt/C. The same group observed a 99.9% yield of GVL over Cu/SiO2 at 10 bar pressure and also with the same feed ratio. Significantly, we are getting a 92.2% yield of GVL with a productivity of 0.9090 kgGVL kgcatalyst−1 h−1 without adding any solvent at atmospheric pressure.
| Catalyst | Catalyst source/preparation method | Reaction conditions | Reaction temperature (°C) | LA conversion | GVL yield | Productivity [kgGVL kgcatalyst−1 h−1] | Ref. |
|---|---|---|---|---|---|---|---|
| 30NHZ | Wet impregnation method | Vapour phase (1 bar) 100% LA | 250 | 100 | 92.2 | 0.9090 | Present study |
| 5%Ru/C | Sigma-Aldrich | Vapour phase (1 bar) 10% LA in 1,4-dioxane | 265 | 100 | 98.6 | 0.4545 | 34 |
| 5%Pd/C | Sigma-Aldrich | Vapour phase (1 bar) 10% LA in 1,4-dioxane | 265 | 100 | 90 | 0.4040 | 34 |
| 5%Pt/C | Sigma-Aldrich | Vapour phase (1 bar) 10% LA in 1,4-dioxane | 265 | 100 | 30 | 0.1515 | 34 |
| 5%Cu/SiO2 | Precipitation–deposition method | Vapour phase, H2 (10 bar), 10% LA in 1,4-dioxane | 265 | 100 | 99.9 | 0.4444 | 35 |
The turnover frequency (TOF) of LA on each catalyst is defined as the number moles of LA converted per one surface Ni atom per second. It is calculated by
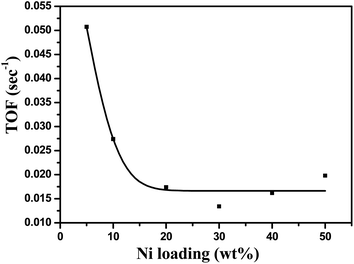
Effect of TOF on the loading of Ni is displayed in Fig. 12. The number of surface Ni sites are assumed to be equal to half the number of H2 moles adsorbed on the catalyst per gram. The TOF was found to decrease up to a 20 wt% Ni loading, beyond which the TOF was consistent. This clearly indicates that LA hydrogenation is structure-sensitive65,66 up to 20 wt%, above which it is structure-insensitive.
4. Conclusions
Ni/H-ZSM-5 is an efficient and eco-friendly catalyst for the production of GVL from the hydrogenation of levulinic acid at atmospheric pressure. The presented results reveal that Ni/H-ZSM-5 catalysts provide good yields because of the presence of both acid sites and metallic sites, which are responsible for the cyclisation followed by hydrogenation, respectively. These catalysts have a lot of scope to further improve their stability during time-on-stream.Acknowledgements
The authors V.M and C.V.P gratefully thank the Council of Scientific and Industrial Research and C.R acknowledges University Grant commission, New Delhi, for financial support.References
- President Bush State Union Address, White House, 2007 http://usgovinfo.about.com/b/2007/01/23/bush-delivers-his-seventh-state-of-the-union-address.htm.
- Directive 2003/30/EC Eur. Union Parliam., Off. J. Eur. Union, 2003 http://ec.europa.eu/energy/res/legislation/doc/biofuels/en_final.pdf.
- U.S. Dep. Energy, 2002, Roadmap for biomass technologies in the United States http://www.brdisolutions.com/pdfs/FinalBiomassRoadmap.pdf.
- R. Saxena, D. Adhikari and H. Goyal, Renewable Sustainable Energy Rev., 2009, 13, 167 CrossRef PubMed.
- J. J. Bozell, L. Moens, D. C. Elliott, Y. Wang, G. G. Neuenscwander, S. W. Fitzpatrick, R. J. Bilski and J. L. Jarnefeld, Resour., Conserv. Recycl., 2000, 28, 227 CrossRef.
- P. Gullon, A. Romani, C. Vila, G. Garrote and J. C. Parajo, Biofuels, Bioprod. Biorefin., 2012, 6, 219 CrossRef CAS.
- D. J. Hayes, S. Fitzpatrick, M. H. B. Hayes and J. R. H. Ross, in Biorefineries—Industrial Processes and Products, ed. B. Kamm, P. R. Gruber and M. Kamm, vol. 1, Wiley-VCH, Weinheim, 2006, p. 139 Search PubMed.
- D. J. Hayes, Catal. Today, 2009, 145, 138 CrossRef CAS PubMed.
- D. M. Alonso, J. Q. Bond and J. A. Dumesic, Green Chem., 2010, 12, 1493 RSC.
- J. P. Lange, R. Price, P. M. Ayoub, J. Louis, L. Petrus, L. Clarke and H. Gosselink, Angew. Chem., Int. Ed., 2010, 49, 4479 CrossRef CAS PubMed.
- J. J. Bozell, Science, 2010, 329, 522 CrossRef CAS PubMed.
- L. E. Manzer, Appl. Catal., A, 2004, 272, 249 CrossRef CAS PubMed.
- B. V. Timokhin, V. A. Baransky and G. D. Elisava, Russ. Chem. Rev., 1999, 68, 73 CrossRef CAS PubMed.
- A. P. Dunlop, J. W. Madden, US Pat., 2,786,852, 1957.
- D. Fegyverneki, L. Orha, G. Lang and I. T. Horvath, Tetrahedron, 2010, 66, 1078 CrossRef CAS PubMed.
- I. T. Horváth, Green Chem., 2008, 10, 1024 RSC.
- D. R. Dodds and R. A. Gross, Science, 2007, 318, 1250 CrossRef CAS PubMed.
- A. Corma, S. Iborra and A. Velty, Chem. Rev., 2007, 107, 2411 CrossRef CAS PubMed.
- P. G. Jessop, Green Chem., 2011, 13, 1391 RSC.
- I. T. Horváth, H. Mehdi, V. Fábos, L. Boda and L. T. Mika, Green Chem., 2008, 10, 238 RSC.
- J. Q. Bond, D. M. Alonso, D. Wang, R. M. West and J. A. Dumesic, Science, 2010, 327, 1110 CrossRef CAS PubMed.
- Z. S. He, Chem. Ind. Eng., 1999, 2, 163 Search PubMed.
- X.-L. Du, L. He, S. Zhao, Y.-M. Liu, Y. Cao, H.-Y. He and K.-N. Fan, Angew. Chem., 2011, 123, 7961 CrossRef.
- A. M. R. Galletti, C. Antonetti, E. Ribechini, M. P. Colombini, N. Nassi o Di Nasso and E. Bonari, Appl. Energy, 2013, 102, 157 CrossRef CAS PubMed.
- R. W. Christian, H. D. Brown and R. M. Hixon, J. Am. Chem. Soc., 1947, 69, 1961 CrossRef CAS.
- H. A. Schutte and R. W. Thomas, J. Am. Chem. Soc., 1930, 52, 3010 CrossRef.
- L. E. Manzer, US Pat. 6,617,464 B2, 2003.
- R. A. Bourne, J. G. Stevens, J. Ke and M. Poliakoff, Chem. Commun., 2007, 4632 RSC.
- Z. P. Yan, L. Lin and S. Liu, Energy Fuels, 2009, 23, 3853 CrossRef CAS.
- J. C. Serrano-Ruiz, D. J. Braden, R. M. West and J. A. Dumesic, Appl. Catal., B, 2010, 100, 184 CrossRef CAS PubMed.
- S. G. Wettstein, J. Q. Bond, D. M. Alonso, H. N. Pham, A. K. Datye and J. A. Dumesic, Appl. Catal., B, 2012, 117–118, 321 CrossRef CAS PubMed.
- A. M. R. Galletti, C. Antonetti, V. De Luise and M. Martinelli, Green Chem., 2012, 14, 688 RSC.
- A. M. Hengne and C. V. Rode, Green Chem., 2012, 14, 1064 RSC.
- P. P. Upare, J.-M. Lee, D. W. Hwang, S. B. Halligudi, Y. K. Hwang and J.-S. Chang, J. Ind. Eng. Chem., 2011, 17, 287 CrossRef CAS PubMed.
- P. P. Upare, J.-M. Lee, Y. K. Hwang, D. W. Hwang, J.-H. Lee, S. B. Halligudi, J.-S. Hwang and J.-S. Chang, ChemSusChem, 2011, 4, 1749 CrossRef CAS PubMed.
- C. R. Reddy, Y. S. Bhat, G. Nagendrappa and B. S. Jai Prakash, Catal. Today, 2009, 141, 157 CrossRef CAS PubMed.
- I. Langmuir, J. Am. Chem. Soc., 1916, 38, 2221 CrossRef CAS.
- I. Langmuir, J. Am. Chem. Soc., 1917, 39, 1848 CrossRef CAS.
- I. Langmuir, J. Am. Chem. Soc., 1918, 40, 1361 CrossRef CAS.
- J. Perez-Ramirez, J. C. Groen, A. Bruckner, M. S. Kumar, U. Bentrup, M. N. Debbagh and L. A. Villaescusa, J. Catal., 2005, 232, 318 CrossRef CAS PubMed.
- A. Dubey, Green Chem., 2007, 9, 424 RSC.
- S.-b. Qiu, L. Gong, L. Liu, C.-g. Hong, L.-x. Yuan and Q.-x. Li, Chin. J. Chem. Phys., 2011, 24, 211 CrossRef CAS.
- A. J. Maia, B. Louis, Y. L. Lam and M. M. Pereira, J. Catal., 2010, 269, 103 CrossRef CAS PubMed.
- B. Pawelec, R. Mariscal, R. M. Navarro, J. M. Campos-Martin and J. L. G. Fierro, Appl. Catal., A, 2004, 262, 155 CrossRef CAS PubMed.
- M. Iwamoto, Catal. Surv. Asia, 2008, 12, 28 CrossRef CAS.
- J. P. Tessonnier, B. Louis, S. Rigolet, M. J. Ledoux and C. Pham-Huu, Appl. Catal., A, 2008, 336, 79 CrossRef CAS PubMed.
- S.-H. Wu and D.-H. Chen, J. Colloid Interface Sci., 2003, 259, 282 CrossRef CAS.
- J. F. Moulder, W. F. Stickle, P. E. Sobol and K. D. Bomben, Handbook of X-ray Photoelectron Spectroscopy, Perkin-Elmer Corporation, 1992 Search PubMed.
- S. Xiao and Z. Meng, J. Chem. Soc., Faraday Trans., 1994, 90, 2591 RSC.
- J. Zu, Z. Zhao, C. Xu, A. Duan and P. Zhang, Catal. Lett., 2006, 109, 65 CrossRef PubMed.
- J. C. Vedrine, A. Aurox and V. Bolis, J. Catal., 1979, 59, 248 CrossRef CAS.
- N. Y. Topsøe, K. Pedersen and E. Derouane, J. Catal., 1981, 70, 41 CrossRef.
- M. J. Climent, A. Corma, S. Iborra, S. Miquel, J. Primo and F. Rey, J. Catal., 1999, 183, 76 CrossRef CAS.
- A. G. Gayubo, A. Alonso, B. Valle, A. T. Aguayo, M. Olazar and J. Bilbao, Fuel, 2010, 89, 3365 CrossRef CAS PubMed.
- G. Peng, S. J. Sibener, G. C. Schatz, S. T. Ceyer and M. Mavrikakis, J. Phys. Chem. C, 2012, 116, 3001 CAS.
- G. Braca, A. M. R. Galletti and G. Sbrana, J. Organomet. Chem., 1991, 417, 41 CrossRef CAS.
- Y. Gong, L. Lin and Z. Yan, Bioresources, 2011, 6, 686 CAS.
- S. Y. Chen and P. Chen, in Kinetics of Catalytic Reaction, Chemical Industry Press, Beijing, China, 2007 Search PubMed.
- A. P. G. Kieboom, F. Van Rantwijk, in Hydrogenation and Hydrogenolysis in Synthetic Organic Chemistry, Science Press, Bejing, China, 1981, p. 13 Search PubMed.
- B. V. Timokhin, V. A. Baransky and G. D. Eliseeva, Russ. Chem. Rev., 1999, 68, 73 CrossRef CAS PubMed.
- M. Kitano, F. Tanimoto and M. Okabanshi, CEER, Chem. Econ. Eng. Rev., 1975, 7, 25 CAS.
- W. Luo, U. Deka, A. M. Beale, E. R. H. van Eck, P. C. A. Bruijincx and B. M. Weckhusen, J. Catal., 2013, 301, 175 CrossRef CAS PubMed.
- P. M. Ayoub, J. P. Lange, US20100217038A, 2010.
- J. P. Lange, L. Petrus, D. B. P. J. Van, H. K. L. Von, WO2006067171A, 2006.
- R. A. van Santen, Acc. Chem. Res., 2009, 42, 57 CrossRef CAS PubMed.
- Q. Zhang, W. Deng and Y. Wang, Chem. Commun., 2011, 47, 9275 RSC.
Footnote |
| † Electronic supplementary information (ESI) available. See DOI: 10.1039/c3ra46485g |
| This journal is © The Royal Society of Chemistry 2014 |

