DOI:
10.1039/C3RA46381H
(Communication)
RSC Adv., 2014,
4, 7927-7932
A novel process for high efficiency recovery of rare earth metals from waste phosphors using a sodium peroxide system†
Received
4th November 2013
, Accepted 10th January 2014
First published on 14th January 2014
Abstract
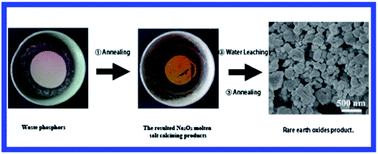
A novel process for recovering Rare-Earth Elements (REEs) from waste phosphors has been developed. The treatment of waste phosphors by a Na2O2 molten salt calcining process is investigated. The results demonstrate that the calcination temperature and Na2O2-to-waste mass ratio have significant influences on the REEs extraction. Meanwhile, Ce and Tb of waste phosphors are converted to Na2CeO3 and Na2TbO3 during the molten salt calcining process, respectively. The optimal conditions in terms of temperature, time and Na2O2-to-waste mass ratio are 650 °C, 50 min and 1.5
:
1, respectively, under which more than 99.9% REEs are recovered. The shrinking core model with mass diffusion in the product layer controlled process has been found most applicable for the decomposition of waste, with the apparent activation energy of 76.7 kJ mol−1. This novel process holds promising potentials for low-cost and high efficiency of recycling waste phosphors on a large industrial scale.
1 Introduction
Considering the advantages of lower energy consumption (about 75% less energy consumed to produce the same light output as an incandescent bulb) and longer life expectancy (about 10 times) of fluorescent lamps, as well as the challenges presented by energy shortages, some governments made decisions to phase out incandescent lighting.1 With the upcoming incandescent phase-out, fluorescent lamps, particularly compact fluorescent lamps (CFLs), are going to dominate the lighting market in the world. Consequently, a wave of spent fluorescent lamps is expected in the solid waste stream several years later. Spent fluorescent lamps contain hazardous metals such as mercury and lead, however, they also include valuable materials such as phosphors, aluminum end caps and so on.2–4 Phosphors are important components in fluorescent lamps, whose role is to convert invisible UV radiation into visible light, accounting for approximately 2% of its total mass.5 Rare earth oxides such as yttrium oxide, europium oxide, lanthanum oxide, cerium oxide and terbium oxide-represent up to 27.9% of the total weight of phosphors (yttrium oxide: ∼23.2%, europium oxide: ∼1.8%, lanthanum oxide: ∼0.3%, cerium oxide: ∼2.4%, terbium oxide: ∼0.2%). The high concentrations of rare earth oxides imply that waste phosphors are valuable resources for recycling rare metals.6
The recovery of Rare-Earth Elements (REEs) from waste phosphors has been studied intensively in recent years. The existing processes of recycling waste phosphors include supercritical fluid extraction7 and hydrometallurgy.8–12 Supercritical fluid extraction holds the advantages like fast diffusivities and selective extraction, but an excess amount of water form water droplets in the supercritical fluid and a possible distribution of the metals in these droplets lowers the effectiveness of the extraction (e.g. the extraction efficiencies of lanthanum, cerium and terbium were less than 7%).7 Hydrometallurgy, with the benefit of low energy requirements and low-cost, is an attractive alternative. Unfortunately, the blue phosphors (BaMgAl10O17:Eu2+) and the green phosphors ((Ce,Tb)MgAl11O19) are much more resistant toward attack by acids,13 leading to the low recovery efficiency of REEs. In order to increase the recovery efficiency of REEs from waste phosphors, a pyrometallurgical process has been developed by Porob et al. recently.14 However, the oxidation in metallurgical process is highly energy consuming, which involves reaction temperature of over 1000 °C. Therefore, it is highly desirable to develop a new process to recover waste phosphors with low-cost, energy savings and high recovery efficiency of REEs.
Here, we develop a novel process to recover REEs from waste phosphors by utilizing the molten sodium peroxide system to improve the recovery efficiency of REEs and reduce the energy consumption. The effect of temperature, time and concentration of sodium peroxide on the decomposition of the waste phosphors were explored systematically. The kinetics of decomposition of waste phosphors in sodium peroxide system was demonstrated and a possible reaction mechanism was also proposed.
2 Experimental section
Chemicals and materials
All chemicals were purchased from Chemical Reagent Company of Beijing in analytical grades. Deionized water was used through the experiments whenever needed. Waste phosphors used for the experiment were purchased from General Research institute for Nonferrous Metals (Beijing). The chemical compositions of a sample of waste phosphors analyzed by XRF is listed in Table 1. REEs such as Ce and Tb existed in concentration of approximately 22 wt% and other elements in the waste sample were found to be mainly Al (Al2O3, 72%), Mg (MgO, 5.5%) and minor components included Si (SiO2, 0.13%).
Table 1 Chemical composition of waste phosphors by XRF analysis
|
Constituents of rare earth |
Constituents of non-rare earth |
CeO2 |
Tb4O7 |
Al2O3 |
MgO |
SiO2 |
Mass (wt%) |
15 |
7.2 |
72 |
5.5 |
0.13 |
Experimental apparatus and procedure
The waste phosphor was dried overnight at 110 °C and ground. The mineralogical analysis of the sample was investigated by X-ray diffraction (XRD). The result in Fig. 1 indicates that the main crystalline phase of waste is (Ce0.67Tb0.33)MgAl11O19 (PDF card 36-0073). Experiments were performed in a muffle furnace using nickel crucibles. The concentrate Na2O2 and waste phosphors were mixed in the nickel crucibles and put into the muffle furnace when the temperature reached the preset value, with free access of air. The reaction of waste phosphors with Na2O2 system yields the mixtures of Na2CeO3, Na2TbO3, MgO2 and NaAlO2, which could be described as follows: |
(Ce0.67Tb0.33)MgAl11O19 + 6.5Na2O2 → MgO2 + 0.67Na2CeO3 + 0.33Na2TbO3 + 11NaAlO2 + 2.5O2
| (1) |
 |
| Fig. 1 XRD pattern of the waste phosphors. | |
To calculate the Ce and Tb extraction, approximate 1.0 g sample was taken out and dissolved in diluted HCl solution at appropriate time intervals during a run. The dissolution reaction took place as follows:
|
Na2REO3 + (x + 2)HCl → REClx + 2NaCl + 3H2O
| (2) |
After the complete dissolution of the sample, unreacted residues were separated from the solution by filtration. The concentration of Ce and Tb in the solution can be analyzed by ICP-OES, and the Ce and Tb extractions were calculated by the following formula:
|
 | (3) |
where [RE]
r and [RE]
0 are the concentrations of REEs in the solution and in the waste phosphors, respectively.
3 Results and discussion
Decomposition of waste phosphors
According to eqn (1) and the chemical analysis results of waste phosphors, 1.0 g of waste phosphors needs ca. 0.7 g of sodium peroxide (the Na2O2-to-waste mass ration is ∼0.7
:
1) for complete reaction. It is obvious that the increase of sodium peroxide quantity favours the waste phosphors oxidation reaction thermodynamically and accelerates the waste phosphors decomposition process. Further, sodium peroxide acts as a fluidizing and fluxing agent in the reaction mixture at temperatures over 500 °C, the increase of Na2O2 decreases the solution viscosity and facilitates the diffusion of reactants during the reaction, according to the report by Barker et al.15 On the other hand, Na2O2-to-waste mass ratio is economically critical considering the total cost for the recycling procedure. In this regard, the influence of Na2O2-to-waste mass ratio on the extraction efficiency of waste phosphors was investigated at a temperature of 600 °C and the results are summarized in Fig. 2. It is shown that for all the systems examined, the conversion rate at the initial stage (from beginning until 10 min) increases dramatically, suggesting instantaneous oxidation of waste phosphors in these systems. Obviously, higher Na2O2-to-waste mass ratio leads to the higher conversion rate of waste phosphors. Moreover, the mixture with the Na2O2-to-waste mass ratio of 1.5
:
1 shows the highest conversion efficiency of the waste phosphors, with 99.6% and 94.5% conversion of Ce and Tb in the decomposition process within 90 min, respectively, compared to those of 54.1% and 52.5% conversion of Ce and Tb with mass ratio of 0.7
:
1.
 |
| Fig. 2 Effect of Na2O2-to-waste mass ratio on the conversion of: (a) cerium and (b) terbium (temperature: 600 °C). | |
Temperature dependence of the Na2O2 decomposition process can be used to estimate the apparent free energy and elucidate the macro-kinetics of the process. The effect of temperature on the Ce and Tb extraction was carried out in the temperature range of 500–650 °C with Na2O2-to-waste mass ratio of 1.5
:
1. The results in Fig. 3 indicate that the temperature significantly influences the Ce and Tb extractions. The Ce and Tb extractions increase with the prolonging of reaction temperature, especially in the initial stage of reaction. For example, the terbium extraction reached 88% within 10 min at 650 °C. The reason is that the viscosity of molten Na2O2 system decreases with the increasing temperature, which in turn enhances the mass transfer in the liquid–solid interface.
 |
| Fig. 3 Effect of temperature on the conversion of: (a) cerium and (b) terbium (Na2O2-to-waste: 1.5 : 1). | |
Kinetics study of waste phosphors decomposition
The morphology of reacted waste phosphors particles was examined using SEM and the results are presented in Fig. S1.† Fig. S1a and S1b† are the typical SEM images of the mixture of waste and Na2O2. The overview image of the waste exhibits uniform and spherical structure. SEM images (Fig. S1c and S1d†) of the products synthesized by the Na2O2 molten salt process exhibit a compact core and a porous shroud. Fig. S2† shows the corresponding photographs for the mixture and the resulted reactive products, which presents a loose state and a compact and aggregated state, respectively, indicating the decomposition of waste phosphors in Na2O2 system in the temperature range of 500–650 °C is a typical liquid–solid reaction. Based on the above observations, the decomposition of waste phosphors can be theoretically described by shrinking core model.16 The following three kinetic equations can be applied for different rate-controlling steps:
I. Liquid boundary layer diffusion controlled process.
|
 | (4) |
II. Solid product layer diffusion controlled process.
|
 | (5) |
III. Chemical reaction controlled process.
|
 | (6) |
where
η is the extraction rate of REEs,
kM is the mass transfer coefficient of the cluster from reagents in liquid boundary layer,
R0 is the radius of the waste particle,
De is the mass transfer coefficient of the cluster in the product layer,
krea is the reaction rate constant,
t is the reaction time,
M is the molar rate of waste,
C0 is the concentration of the cluster at
t = 0,
ρ is the density of waste particle, and
σ is the coefficient of Na
2O
2, and
k1,
k2,
k3 are the apparent rate constants.
Based on the REEs fractional conversion η at time t given in Fig. 4, η, 1 + 2(1 − η) − 3(1 − η)2/3 and 1 − (1 − η)1/3 were calculated, respectively, which were subsequently plotted with reaction time t according to eqn (4)–(6). The results show that 1 + 2(1 − η) − 3(1 − η)2/3 = k2t fits the experimental data best.
 |
| Fig. 4 (a) Cerium and (b) terbium extraction rations versus time t at 500 °C fitted by three kinetics equations. | |
Conversion ratios of Tb with different temperatures are fitted and calculated with eqn (5) (Fig. 5). The data from Fig. 5 is shown in Table 2. Subsequently, the natural logarithm of reaction rate constant (ln k2) against the reciprocal of absolute temperature (1/T) is plotted (Fig. 8) and the apparent activation energy was derived based on Arrhenius equation (eqn (7)).
|
 | (7) |
where
Ea is the apparent activation energy,
k0 is the pre-exponential factor, and
R is the molar gas constant.
 |
| Fig. 5 Plots of kinetics under various temperatures. | |
Table 2 Reaction rate constant at different temperature
T/°C |
T/K |
1000/T/K |
k2 |
ln k2 |
500 |
773 |
1.293661 |
0.00235 |
−6.05334 |
550 |
823 |
1.215067 |
0.00387 |
−5.5545 |
600 |
873 |
1.145475 |
0.01579 |
−4.14838 |
According to eqn (7) and the plots of the fitted line in Fig. 6, the apparent activation energy Ea of the reaction (1) was calculated to be 76.7 kJ mol−1. The kinetics equation for REEs extraction in the Na2O2 molten salt calcining process can be described as:
|
 | (8) |
 |
| Fig. 6 Activation energy plot of decomposition process of waste phosphors. | |
From the eqn (8), it is clear that the extraction of REEs is controlled by mass diffusion in the product layer.
 |
| Fig. 7 XRD patterns of the sample obtained at 600 °C for different calcining time: (a) 10 min; (b) 30 min and (c) 60 min (Na2O2-to-waste: 1 : 1). | |
Phase transformation of the waste phosphors during the Na2O2 molten salt calcining process
To understand the mechanism for decomposition of waste phosphors during the Na2O2 molten salt calcining process, different experimental conditions such as the reaction time was investigated with the Na2O2-to-waste mass ratio of 1
:
1 at the temperature of 600 °C. XRD patterns of three typical samples obtained after a calcining reaction for 10 min, 30 min and 60 min are shown in Fig. 7, respectively. Initially (at 10 min), Na2CeO3 (PDF card 77-0189), Na2TbO3 (PDF card 77-0155), MgO2 (PDF card 19-0771) and NaAlO2 (PDF card 32-1203) peaks appeared, and (Ce0.67Tb0.33)MgAl11O19 peaks decreased in the XRD pattern of the sample due to the conversion of waste phosphors. However, the diffraction peaks of Na4SiO4 crystals were not observed in the as-obtained calcination product possibly due to low concentration (SiO2: only 0.13%).17 The crystal transformation from (Ce0.67Tb0.33)MgAl11O19 to Na2REO3 (RE = Ce4+ and Tb4+) is shown in Fig. 8. The crystalline structure of (Ce0.67Tb0.33)MgAl11O19, with unit cell parameters of a = b = 5.588 Å, c = 21.905 Å, α = β = 90° and γ = 120°, has distorted magnetoplumbite structure.18. The blocks are composed of Al3+ and O2− ions, and the Mg2+ ions are located at Al3+ sites, while the mirror planes contain O2− ions and rare earth cations such as Ce3+ and Tb3+.19 In the Na2O2 molten salt calcining process, RE–O bonds in (Ce0.67Tb0.33)MgAl11O19 were broken by the presence of Na2O2. Meanwhile, Na2CeO3 and Na2TbO3 are formed. The crystalline structures of both Na2TbO3 and Na2CeO3 show the NaCl type structure,20 with space group Fm-3m, unit cell parameters of a = b = c = 4.74 Å, α = β = γ = 90° for Na2TbO3, and a = b = c = 4.83 Å, α = β = γ = 90° for Na2CeO3. The oxides form a close-packed type array and surround Na+ or RE4+ ion with octahedral coordination. The RE4+ and Na+ ions occupy the same positions in the unit cell with different occupancy. Further improving the reaction time to 30 min and 60 min, the Na2CeO3, Na2TbO3, MgO2 and NaAlO2 peaks became stronger, whereas the (Ce0.67Tb0.33)MgAl11O19 peaks became weaker, and no other new peaks were found, indicating that the waste phosphors react with Na2O2 following the eqn (1) and the oxidation occurs during the formation of Na2CeO3, Na2TbO3, MgO2 and NaAlO2.
 |
| Fig. 8 The transformation from (Ce0.67Tb0.33)MgAl11O19 to Na2REO3 in the Na2O2 molten salt calcining process. | |
Characteristics of rare earth oxides products
As a further step, the water leaching was employed to recover REEs from the molten salt calcining sample. The leached sample was analyzed using XRD, as shown in Fig. 9. The result indicates that Na2REO3, MgO2 and NaAlO2 peaks disappeared, and the diffraction peaks agree with those of Ce(OH)4,21 Tb(OH)3 (PDF card 70-0530) and Mg(OH)2 (PDF card 44-1482), indicating the formation of Ce(OH)4, Tb(OH)3 and Mg(OH)2 in the leached sample.
 |
| Fig. 9 XRD pattern of the leached sample obtained by dissolving the molten salt samples in water (temperature: 600 °C; time: 60 min; Na2O2-to-waste: 1 : 1). | |
Based on above investigations, a new process for the recovery of REEs from waste phosphors by using Na2O2 system was illustrated in Fig. S3.† In this process, the waste phosphors are first decomposed in Na2O2 molten salt. Cerium, terbium, magnesium, aluminum and silicon are converted to Na2CeO3, Na2TbO3, MgO2, NaAlO2 and Na4SiO4, respectively. Then, the obtained molten salt sample is washed with water. The soluble NaAlO2 and Na4SiO4 are separated from the solid residue during the water leaching process. Finally, the washed solid is converted into rare earth oxides product via calcination.
The XRD pattern of the rare earth oxides product in Fig. 10a indicates that well crystallized Ce0.6Tb0.4O2−x was obtained (PDF card 52-1303). The SEM image in Fig. 10b shows that the rare earth oxides particles are uniformly distributed with average diameter of 0.4 μm. The chemical compositions of the rare earth oxides product were also analyzed by XRF, as given in Table 3. The total weight of the rare earth oxides is up to 91.58 wt% in the final product.
 |
| Fig. 10 (a) XRD pattern and (b) SEM image of the rare earth oxides product. | |
Table 3 Chemical composition of the rare earth oxides product by XRF analysis
|
Constituents of rare earth |
Constituents of non-rare earth |
CeO2 |
Tb4O7 |
MgO |
Al2O3 |
Mass (wt%) |
63.14 |
28.44 |
8.0 |
0.42 |
4 Conclusions
In summary, a novel process for recovery of REEs from waste phosphors is proposed and has been proven feasible in the work with a new reaction system of Na2O2. The experimental results on the decomposition of waste phosphors by Na2O2 reveal that the temperature and Na2O2-to-waste mass ratio significantly influences the REEs extraction. The optimal molten salt calcining conditions are as follows: temperature of 650 °C, time of 50 min, and Na2O2-to-waste mass ratio of 1.5
:
1. Under these conditions, the conversion of REEs is over 99.9%. It has been found that the waste was converted to Na2CeO3, Na2TbO3, MgO2 and NaAlO2 during the Na2O2 molten salt calcining process. Moreover, the shrinking core model strongly suggests that the decomposition process is controlled by mass diffusion in the product layer with the apparent activation energy of 76.7 kJ mol−1. The proposed process with high efficiency of the recovery of REEs is in accordance with cyclical economy concept. This work definitely provides a new approach for low-cost, large-scale and highly efficient recovery of REEs from waste phosphors which is not only environmentally benign but also economically profitable.
Acknowledgements
This work was financially supported by State Key Laboratory of Solid Waste Reuse for Building Materials, National Natural Scientific Foundation of China (no. 21306004) and 863 Program (no. 2012AA063207), Research-based science and technology innovation platform-the technical standards of recycling system of waste rare earth and Precious metals products (no. 033000546613001), and Teaching strong deepen plan for Beijing talents among colleges (no. PHR20110843).
Notes and references
- Y. A. Hu and H. F. Cheng, Environ. Int., 2012, 44, 141 CrossRef CAS PubMed.
- D. D. Shao, S. C. Wu, P. Liang, Y. Kang, W. J. Fu, K. L. Zhao, Z. H. Cao and M. H. Wong, J. Hazard. Mater., 2012, 221–222, 28 CrossRef CAS PubMed.
- M. F. Xing and F. S. Zhang, J. Hazard. Mater., 2011, 194, 407 CrossRef CAS PubMed.
- Y. D. Li and L. Jin, Environ. Eng. Sci., 2011, 28, 687 CrossRef CAS.
- C. Raposo, C. C. Windmöller and W. A. D. Júnior, Waste Manag., 2003, 23, 879 CrossRef CAS.
- A. S. Coolidge, J. Am. Chem. Soc., 1927, 49, 1949 CrossRef CAS.
- R. Shimizu, K. Sawada, Y. Enokida and I. Yamamoto, J. Supercrit. Fluids, 2005, 33, 235 CrossRef CAS PubMed.
- M. A. Rabah, Waste Manag., 2008, 28, 318 CrossRef CAS PubMed.
- T. Nakamura, S. Nishihama and K. Yoshizuka, Solvent Extr. Res. Dev., Jpn., 2007, 14, 105 CAS.
- I. D. Michelis, F. Ferella, E. F. Varelli and F. Vegliò, Waste Manag., 2011, 31, 2559 CrossRef PubMed.
- E. Bou-Maroun, H. Chebib, M. J. F. Leroy, A. Boos and G. J. Goetz-Grandmont, Sep. Purif. Technol., 2006, 50, 220 CrossRef CAS PubMed.
- L. V. Resende and C. A. Morais, Miner. Eng., 2010, 23, 277 CrossRef CAS PubMed.
- R. Otto and A. Wojtalewicz-Kasprzac, US Patent US 2012/0027651 A1, 2012.
- D. G. Porob, A. M. Srivastava, P. K. Nammalwar, G. C. Ramachandran and H. A. Comanzo, US Patent US 8,137,645 B2, 2012.
- M. G. Barker, S. A. Frankham and P. G. Gadd, J. Inorg. Nucl. Chem., 1981, 43, 2815 CrossRef CAS.
- Z. Sun, Y. Zhang, S. L. Zheng and Y. Zhang, AIChE J., 2009, 55, 2646 CrossRef CAS.
- G. Lambotte and P. Chartrand, J. Chem. Thermodyn., 2013, 57, 306 CrossRef CAS PubMed.
- D. Saber and A. M. Lejus, Mater. Res. Bull., 1981, 16, 1325 CrossRef CAS.
- J. Y. Zhang, Z. T. Zhang, Z. L. Tang and Y. H. Lin, Mater. Chem. Phys., 2001, 72, 81 CrossRef CAS.
- Y. Hinatsu and Y. Doi, J. Alloys Compd., 2006, 418, 155 CrossRef CAS PubMed.
- A. A. Ansari and A. Kaushik, J. Semicond., 2010, 31, 1 Search PubMed.
Footnote |
† Electronic supplementary information (ESI) available. See DOI: 10.1039/c3ra46381h |
|
This journal is © The Royal Society of Chemistry 2014 |
Click here to see how this site uses Cookies. View our privacy policy here.