General synthesis of LiLn(MO4)2:Eu3+ (Ln = La, Eu, Gd, Y; M = W, Mo) nanophosphors for near UV-type LEDs†
Ying Liuab,
Yu Wangc,
Liping Wangb,
Ying-Ying Gub,
Shu-Hui Yud,
Zhou-Guang Lu*ab and
Rong Sun*d
aDepartment of Materials Science and Engineering, South University of Science and Technology of China, Shenzhen, Guangdong 518055, P.R. China. E-mail: luzg@sustc.edu.cn
bCollege of Chemistry and Chemical Engineering, Central South University, Yuelu Campus, Changsha, Hunan 410083, P.R. China
cDepartment of Physics and Materials Science, City University of Hong Kong, Hong Kong SAR, China
dShenzhen Institutes of Advanced Technology, Chinese Academy of Sciences, Shenzhen, Guangdong 518055, P.R. China. E-mail: rong.sun@siat.ac.cn
First published on 3rd December 2013
Abstract
A series of Eu3+-doped double tungstate and molybdate red phosphors, LiLn(MO4)2:Eu3+ (Ln = La, Eu, Gd, Y; M = W, Mo), have been successfully synthesized by a simple Pechini method. The procedure involves formation of homogeneous, and transparent, metal–citrate gel precursors using citric acid as a chelating ligand to form metal complexes and ethylene glycol as a cross-linker for polyesterification with the complexes, followed by calcination to promote thermal decomposition of the gel precursors to yield the final LiLn(MO4)2 nanoparticles. The as-synthesized nanoparticles were characterized by thermogravimetric/differential scanning calorimetry (TG-DSC), X-ray diffraction (XRD), scanning electron microscopy (SEM), and photoluminescence (PL) as well as kinetic decay. The results indicate that the obtained LiLn(MO4)2:Eu3+ samples crystallize in the isostructure with tetragonal space group I41/a (no. 88). A room temperature PL spectrum shows that Eu3+-doped LiLn(MO4)2 powders exhibit an excellent luminescent properties under a near ultraviolet excitation wavelength of 395 nm, suitable for near UV type LEDs. By comparing with other counterparts, it is found that LiEu(WO4)2 and LiEu(MoO4)2 display the highest emission intensity. In addition, the phosphor of composition LiY0.95Eu0.05(WO4)2 shows promising application for white light emission with a decay time of 0.585 ms.
1. Introduction
Solid-state lighting with light emitting diodes (LEDs) has attracted a great deal of recent interest because of higher reliability, longer lifetime and lower energy consumption, comparing with the conventional incandescent and fluorescence lamps.1–6 To date, the most popular method to produce white light is combination of the InGaN chip with a yellow (Y1−xGdx)3(Al1−yGay)5O12:Ce3+ (YAG:Ce) phosphor.7 However, the combination of single chip and single phosphor can result in the low color-rendering (Ra < 80) and poor color stability for longer working time due to the lack of red emission and different degradation rates of chip. One of the most popular technologies for manufacturing white LEDs is to pump a mixture of tricolor phosphors with a near-ultraviolet LEDs chip as the excitation source (380–410 nm).8 In order to reduce color shift and obtain good colour rendering, the mixture includes 80% red phosphor (Y2O2S:Eu3+), 10% green (ZnS:(Cu+, Al3+)), and 10% blue phosphor (BaMgAl10O17:Eu2+). However, it is found that a high Y2O2S:Eu3+ content has some disadvantages likes high cost, inadequate lifetime, low reliability and potential decomposition. A variety of red phosphors excited efficiently by blue-light and near-UV light have reported to overcome these drawbacks, such as Sr2Si5N8:Eu2+,9–11 M1.95Eu0.05Si5−xAlxN8−xOx (M = Ca, Sr, Ba),12 Ca4(PO4)2O:Eu2+,13 and Y4O(OH)9NO3:Eu3+.14,15 Unfortunately, the synthesis of nitride phosphors needs more critical conditions with high temperature and high pressure of N2. Moreover, under excitation at a wavelength of 395 nm and 460 nm, the phosphates and nitrates phosphors often show low relative emission intensity and quantum efficiencies. Therefore, it is very important for the development of white LEDs to exploring a novel efficient red phosphors having strong and broad absorption at near-UV region as alternatives to Y2O2S:Eu3+.Double tungstate and molybdate compounds ALn(MO4)2 (A = alkali metal ions, Ln = rare earth ions, M = W, Mo) can form a variety of tetragonal and monoclinic inorganic luminescence compounds, which have numerous applications in various field, such as optoelectronic, catalysis, scintillators and so forth.16–20 Particular attention has focused on the tungstates and molybdates with a scheelite-type structure (W6+/Mo6+ is coordinated by four oxygen atoms in a tetrahedral site and Ln3+/A+ is eight coordinated). Moreover, double tungstate and molybdate compounds ALn(MO4)2 (A = alkali metal ions, Ln = rare earth ions, M = W, Mo) with high physical and chemical stability are considered to be ideal luminescent hosts and exhibit strong and broad absorption in the UV region, which can meet the urgent need for exploring high-quality phosphors for LEDs.3,16,17
Recently, a variety of preparation methods have been extensively used to produce these compounds, including solid-state reaction,18–20 hydrothermal process,21–23 and sol–gel.24–26 The conventional solid-state reaction for ALn(MO4)2 (A = alkali metal ions, Ln = rare earth ions, M = W, Mo) normally requires high temperature, long reaction time, and cumbersome grinding, resulting in broad grain size distribution and irregular morphology. Crystallite size and morphology have profound effect on the luminescent properties. Thus, it is desirable to search a simple and economical method for preparing ALn(MO4)2 nanocrystals with narrow grain size and uniform morphology. The Pechini method is one of the most accessible methods to obtain better quality ALn(MO4)2 phosphors, because the intimate mixing of components can ensure homogeneity of the final product.27 It also provides a stable, unique and low-cost sol precursor for the future fabrication of high quality luminescent thin film via dip-coating or spin-coating.
It is believed that Li-based double tungstate and molybdate materials exhibit more promising PL performance than those K- and Na-based double counterparts.28,29 Chiu et al. reported the preparation of double molybdate phosphors AEu(MoO4)2 (Li+, Na+, K+) via solid-state reactions and the strongest integrated emission intensity was found in the LiEu(MoO4)2 under 394 nm light excitation.20 Wang et al. reported that the PL brightness of LiEu(MoO4)2 synthesized by the conventional solid-state reaction was 1.31 times greater than that of NaEu(MoO4)2.29 In LiLn(MO4)2:Eu3+ compound, as compared with the Na or K counterparts, the Li–O distance is found to be shortened and Li–O bond shows more covalency, leading to faster energy transfer from the host to the Eu3+, then emitting bright red light.30 Moreover, the bond length of Ln–Ln in LiLn(MO4)2 is very long as compared with the general host materials like Ln2O3, LnPO4, LnVO4, and LnAl2O5, etc., which is favorable for reducing the concentration quenching effects leading to substantial increase of the Eu3+ doping concentration in the LiLn(MO4)2 host lattice. Hence, among the scheelite-related phosphors, Eu3+ doped LiLn(MO4)2 is considered as excellent candidate used for near UV-type LEDs.
Although bulk materials of various tungstates and molybdates such as LiEu(MoO4)2,18,20 LiEu(WO4)2,20 LiGd(MoO4)2:Eu3+ (ref. 31) have been synthesized via solid state reaction and Huang and co-workers have successfully prepared a series of rare-earth doped LiLa(WO4)2 single crystals by the Czochralski method,32–34 to the best of our knowledge, there are very few reports on the synthesis of LiLn(MO4)2:Eu3+ nanopowders by the soft chemical routes.35,36 In this paper, a general Pechini method has been developed to synthesize a series of LiLn(MO4)2:Eu3+ (Ln = La, Eu, Gd, Y; M = W, Mo) red nanophosphors with scheelite structure. Moreover, the effect of doping different rare earth on luminescent properties of Li-based tungstate host under near-UV light excitation is studied in detail. We also discuss the effect of these rare earth materials on emission intensity, lifetime and quantum efficiency after the substitution of W by Mo.
2. Experimental
2.1. Synthesis of LiLn(MO4)2 nanocrystals
All the chemical reagents in the experiment were analytically pure and used without further purification. In a typical procedure, 3 mmol of lithium nitrate (LiNO3) and 3 mmol of Ln(NO3)3 (Ln = La, Eu, Gd, Y) were dissolved in 40 mL deionized water at room temperature. 15 mmol of citric acid (CA) was added to the rare-earth nitrate solution as a chelating agent under vigorous stirring. 0.5 mmol ammonium paratungstate (H40N10O41W12·xH2O) or 0.86 mmol ammonium molybdate ((NH4)6Mo7O24·4H2O) was dissolved in 0.375 M 40 mL CA aqueous solution. After complete homogenization, both solutions were mixed together, and then stirred for 30 min. To form rigid polyester net, a certain amount of ethylene glycol (EG) was added as a cross-linking agent (the molar ratio of ethylene glycol to citric acid was 1![[thin space (1/6-em)]](https://www.rsc.org/images/entities/char_2009.gif) :
:![[thin space (1/6-em)]](https://www.rsc.org/images/entities/char_2009.gif) 1). Then, the mixed solution was heated at 90 °C for 2 h in a water bath with constant stirring until a transparent sol was obtained. The obtained sol was transferred into an oven and kept at 180 °C for 2 h to produce a brown dried gel. The grinded gel subsequently was firstly annealed in muffle furnace at 200 °C for 2 h to decompose the precursor resin. And then, the precursor powder was calcined at 800 °C for 2 h to fabricate the final white LiLn(MO4)2 (Ln = La, Eu, Gd, Y, M = W, Mo) powder.
1). Then, the mixed solution was heated at 90 °C for 2 h in a water bath with constant stirring until a transparent sol was obtained. The obtained sol was transferred into an oven and kept at 180 °C for 2 h to produce a brown dried gel. The grinded gel subsequently was firstly annealed in muffle furnace at 200 °C for 2 h to decompose the precursor resin. And then, the precursor powder was calcined at 800 °C for 2 h to fabricate the final white LiLn(MO4)2 (Ln = La, Eu, Gd, Y, M = W, Mo) powder.
2.2. Synthesis of Eu3+ doped LiLn(MO4)2 crystals
The synthetic procedure of Eu3+ doped LiLn(MO4)2 nanocrystals was similar to the method that was used to synthesize LiLn(WO4)2 and LiLn(MoO4)2 nanocrystals, except that Ln(NO3)3 and Eu(NO3)3 solutions (3 mmol total, molar ratio Ln3+![[thin space (1/6-em)]](https://www.rsc.org/images/entities/char_2009.gif) :
:![[thin space (1/6-em)]](https://www.rsc.org/images/entities/char_2009.gif) Eu3+ = 0.95
Eu3+ = 0.95![[thin space (1/6-em)]](https://www.rsc.org/images/entities/char_2009.gif) :
:![[thin space (1/6-em)]](https://www.rsc.org/images/entities/char_2009.gif) 0.05) were used as the precursor.
0.05) were used as the precursor.
2.3. Characterization
The thermal decomposition behavior of the citrate gel precursors was examined by a thermogravimetric analyzer (TGA, Perkin-Elmer, TG7/DX) using air as the working gas. For DSC measurements, the samples were heated from room temperature to 900 °C at a heating rate 15 K min−1. α-Al2O3 was used as the reference material, and the samples were run in open platinum pans. Phase purity of the as-prepared samples were identified by powder X-ray diffraction (XRD, D/ruax2550PC, JEOL, Japan) using Cu Kα radiation (λ = 1.54056 Å) at an operation voltage and current of 40 kV and 30 mA. The microstructural morphology of the product was characterized with FEINova NanoSEM450 scanning electron microscope (SEM). Steady-state and time-resolved photoluminescence (PL) spectra were measured on an Edinburgh Instrument FLS920P spectrometer, with a 450 W xenon lamp as the steady-state excitation source, and a microsecond flashlamp (μF920H) as the excitation light source for time-resolved photon counting measurements. For comparison, all excitation and emission spectra were measured at room temperature with the same instrumental parameters.3. Results and discussion
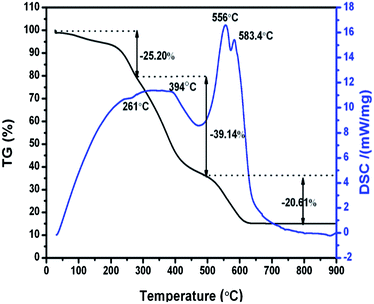
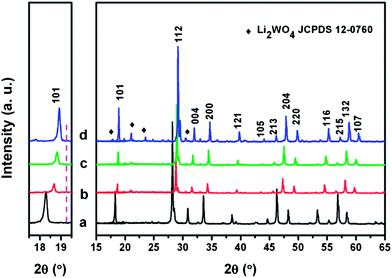
The thermal decomposition of the obtained Li–La–W–citrate gel precursors was studied by thermogravimetric/differential scanning calorimetry (TG-DSC) as shown in Fig. 1. From the TG curve, throughout the temperature range from ambient temperature to 900 °C, three weight loss regions occur at 27–300 °C (about 25.20%), 300–500 °C (about 39.14%), and 500–800 °C (about 20.61%). As the temperature increases above 800 °C, no significant weight loss can been observed. Correspondingly, three discrete regions of thermal decomposition can be found in the DSC curve. A weak exothermic peak centered at 261 °C corresponds to elimination of molecule water. The first broad endothermic peak centred at 394 °C can be attributed to the thermal decomposition of NO3− and organic phases (CA). Subsequently, due to the combustion of remaining organic materials (carbon and organic compounds), the following two endothermic peaks centered at 556 °C and 583 °C appear, and the crystallized LiLa(WO4)2 inorganic phase is simultaneously formed.Fig. 2 shows the XRD patterns of as-prepared Eu3+ doped LiLn(WO4)2 samples. It is clear that all the diffractions can be indexed to pure tetragonal phase NaLa(WO4)2 (JCPDS 79-1118), LiEu(MoO4)2 (JCPDS 54-0978), NaY(MoO4)2 (JCPDS 82-2369), and LiY(MoO4)2 (JCPDS 17-0773), respectively. However, diffraction peaks centered at around 19.66°, 20.86°, 23.49°, 30.24° appear when the Eu3+ ions are introduced into the LiY(WO4)2 lattice. According to JCPDS no. 12-0760, these four reflections can be ascribed to Li2WO4. It is concluded that for La, Eu, Gd, and Y, the rare-earth double tungstates crystallize in a pure scheelite structure with the space group I41/a. Noticeably, we can also see from the magnified XRD pattern in the range of 17.5–19.5° as shown in the left part of Fig. 2, that all the diffraction peaks of LiLn(WO4)2:Eu3+ samples shift to the right (high angle side), an indication of contract of the unit cell due to the contraction of the ionic radius of lanthanides of the scheelite type LiLn(WO4)2.37–41
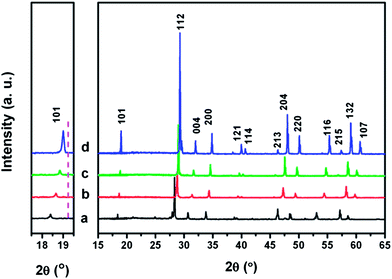
Fig. 3 shows the XRD patterns of as-prepared Eu3+ doped LiLn(MoO4)2 samples. It can be observed that for La, Eu, Gd, and Y, all the corresponding diffraction peaks can be matched with pure tetragonal phase LiLa(MoO4)2 (JCPDS 18-0734), LiEu(MoO4)2 (JCPDS 54-0978), LiGd(MoO4)2 (JCPDS 18-0728) and LiY(MoO4)2 (JCPDS 17-0773), respectively. The rare-earth doped double molybdates adopt tetragonal space group I41/a. No peaks of other impurity phases can be detected, demonstrating that a high phase purity of LiLn(MoO4)2 samples can be obtained by the Pechini method. The magnified XRD patterns in the region between 17.5° and 19.5° are shown in the left part of Fig. 3. Peaks shift to a high-angle side as rare earth ionic radius decreases, similar to the Eu3+ doped LiLn(WO4)2 samples, which indicates that the lattice constant becomes smaller according to Bragg's law.
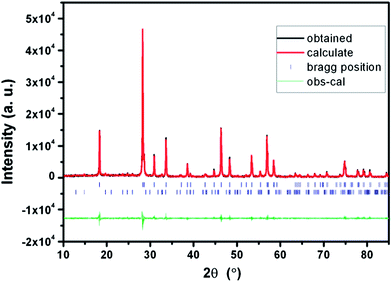
Fig. 4 shows the observed, calculated, and difference pattern of the Rietveld refinement pattern of the LiLa0.95Eu0.05(WO4)2 sample. The resultant reliability values are Rp = 18.3%, Rwp = 20.6% with a fit indicator of GOF = Rwp/Re = 4.45. The lattice parameters for the LiLa0.95Eu0.05(WO4)2 are refined by the Rietveld refinement to be a = b = 5.326 Å, c = 11.561 Å, α = β = γ = 90°, and V = 327.940. A secondary Li2WO4 phase is observed as an impurity in the refinement and refined by multi-pattern Rietveld analysis of FullProf software. The weight fraction of the impure phase is calculated to be 5.99% and the reliability factors are RBragg = 4.47%, Rf = 3.93%. The lattice parameters for the Li2WO4 are determined to be a = b = 11.950 Å, c = 8.413 Å, and α = β = γ = 90°.
Fig. 5 shows the SEM images of LiEu(WO4)2 prepared by the Pechini method. It is obviously seen that the as-obtained sample consists of pretty regular nanoparticles with size ranging from 20 to 200 nm. The LiEu(WO4)2 sample appears agglomeration to some extent due to absorbing water in the air easily.
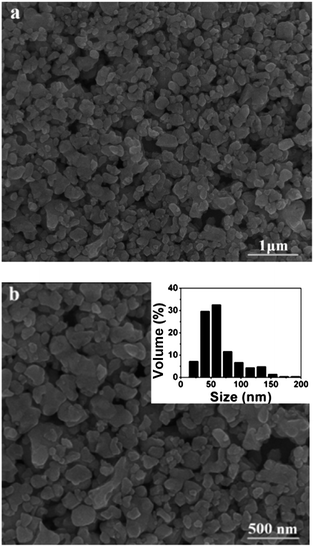 | ||
| Fig. 5 SEM images of the LiEu(WO4)2 sample with different magnifications. The inset of (b) shows particle size distribution histograms for the LiEu(WO4)2 sample. | ||
The Eu3+ ion mainly exhibits a red emission in LiLn(WO4)2 (Ln = La, Gd, Y) host lattices upon N-UV excitation. Fig. 6(a) shows room-temperature excitation spectra of the Eu3+ doped LiLn(WO4)2 samples synthesized by Pechini method in the wavelength range of 250–500 nm for emission at ∼615 nm. The broad band below 350 nm can be ascribed to the charge-transfer band (CTB) from the surrounding oxygen anions to tungstate groups. However, due to possible overlap of the CT band with that of tungstate group, the CT band of Eu3+–O2− is not clearly observed in the excitation spectra, which is in agreement with some references.20,42–44 The broad bands in the UV region may contain the charge transfer excitation of Eu3+ ions and the energy transfer transition from tungstate/molybdate groups to Eu3+ ions. A group of sharp lines in the longer wavelength region (360–500 nm) is also observed due to intra-configurational f–f transitions of the Eu3+ in the host lattices and two of the strongest absorptions centered at 395 nm and 465 nm correspond to the 7F0 → 5L6 and 7F0 → 5D2 transitions, respectively. Therefore, the Eu3+ doped LiLn(WO4)2 can be excited effectively by near-ultraviolet (395 nm) and blue (466 nm) light. Room-temperature emission spectra of the Eu3+ doped LiLn(WO4)2 samples synthesized by Pechini method with the excitation wavelength of ∼395 nm are shown in Fig. 6(b). Although no emission corresponding to tungstates is observed, the presence of CTB resulting from oxygen to tungstate in Fig. 6(a) has indicated that the energy absorbed by the WO42−/MoO42− group is transferred to Eu3+ levels nonradiatively, which is known as “host-sensitized”.20 However, the intensity of Eu3+ emission is weaker with the CTB excitation when as compared with that because of the Eu3+ excitation, clearly revealing that the energy transfer from the WO42−/MoO42− group to Eu3+ is not efficient. Eu3+characteristic f–f transitions give sharp emission lines in the spectra after the introduction of the Eu3+ in LiLn(WO4)2 host. The emission intensity is found to increase in order of LiLa0.95Eu0.05(WO4)2 < LiY0.95Eu0.05(WO4)2 < LiGd0.95Eu0.05(WO4)2 < LiEu(WO4)2. Theoretically, the emission intensity should be increased in the sequence of LiLa0.95Eu0.05(WO4)2 < LiGd0.95Eu0.05(WO4)2 < LiY0.95Eu0.05(WO4)2 < LiEu(WO4)2, following the principle of lanthanide contraction. As the distance of Eu–Eu is found to be shortened with the decrease of the ion radius of rare earth (La3+ (1.160 Å) < Eu3+ (1.066 Å) < Gd3+ (1.052 Å) < Y3+ (1.019 Å)), which gradually increases the energy transfer between two Eu3+ ions and improves PL intensity. However, due to the presence of impure phase in LiY0.95Eu0.05(WO4)2, it unavoidably increases the inactive center concentration, thereby leading to reduced PL intensity. Moreover, this difference in emission intensity should be mainly related to the defects originated from the change of lattice environment surrounding Eu3+ ions in different host since the defect is considered to be a critical pathway for radiative transitions in nanomaterials. It is well known that the relative of the 5D0 → 7F1 and 5D0 → 7F2 transitions can be determined by the symmetry of the lattice in which Eu3+ ion occupy. If Eu3+ is embedded at a site without inversion symmetry, the electric dipole transition of 5D0 → 7F2 should be dominant, while at a site with inversion symmetry, the magic dipole transition of 5D0 → 7F1 will be preponderant.45–48 Therefore, the luminescence integrated intensity ratio of 5D0 → 7F2 to 5D0 → 7F1, R = I(0–2)/I(0–1), known as the asymmetry ratio, has been used to measure the degree of distortion from inversion symmetry of the local chemical environment surrounding doping Eu3+ in the host. It is noted that the electric dipole transition 5D0 → 7F2 is about seven times stronger as compared to the magnetic dipole transition 5D0 → 7F1, indicating that the Eu3+ ions do not occupy the host lattice with inversion symmetry in the Eu3+ doped LiLn(WO4)2 samples. The values of their integrated intensity ratio (I0–2/I0–1) for Eu3+ doped LiLn(WO4)2 (Ln = La, Eu, Gd and Y) samples are 6.45, 8.80, 8.69 and 8.42. When the concentration of Eu3+ attains 100%, the sample has the maximum asymmetry ratio, suggesting that Eu3+ occupies more distorted local environment.
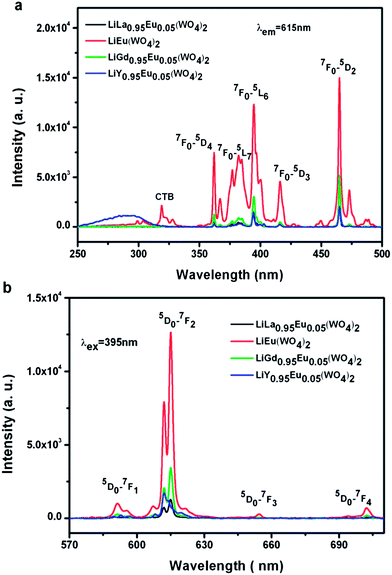 | ||
| Fig. 6 Room-temperature (a) excitation spectra (λem = 615 nm) and (b) emission spectra (λex = 395 nm) of Eu3+ doped LiLn(WO4)2 samples synthesized by Pechini method. | ||
In order to study the dependence of the emission intensity of Eu3+ on LiLn(MoO4)2 (Ln = La, Gd, Y), the same amount of samples are doped the same concentration of Eu3+ and measured under identical experimental conditions. Fig. 7 shows room-temperature (a) excitation spectra (λem = 615 nm) and (b) emission spectra (λex = 395 nm) of Eu3+ doped LiLn(MoO4)2 samples synthesized by Pechini method. It is found that all the excitation spectrum have a similar profile to Fig. 6(a) except for the intensity. The CTB of LiEu(MoO4)2 exhibits a larger stokes shift and broader as compared with the other three samples, which can be related to the lower crystal symmetry resulting from a deviation of the metal–ligand distance from that of the ground state. The stokes shift is reported in the alkali-metal europium double tungstate compounds AEu(WO4)2 (A = Li, Na, K) by Huang et al.49 The emission spectrum under excitation at 395 nm consists of a group of lines from 4f–4f transitions of Eu3+ and the emission intensity originating from magnetic dipole 5D0 → 7F1 (591 nm) transition are very weaker, while the electric dipole 5D0 → 7F2 (612, 615 nm) transition dominate the emission because of the non-centrosymmetric group. The emission intensity from 5D0 → 7F3 (655 nm) and 5D0 → 7F4 (702 nm) can be obviously observed only in the LiEu(MoO4)2 sample. The emission intensity of Eu3+ changes with the increase of the asymmetry ratio (R(LiLa0.95Eu0.05(MoO4)2) = 7.70 < R(LiY0.95Eu0.05(MoO4)2) = 8.11 < R(LiGd0.95Eu0.05(MoO4)2) = 8.85 < R(LiEu(MoO4)2) = 10.82) in the same sequence, that is I(LiLa0.95Eu0.05(MoO4)2) < I(LiY0.95Eu0.05(MoO4)2) < I(LiGd0.95Eu0.05(MoO4)2) < I(LiEu(MoO4)2). LiEu(MoO4)2 exhibits the strongest emission intensity among the four samples. It is very interesting that this result is consistent with the above Eu3+ doped LiLn(WO4)2 samples. It is very surprising that a high doping concentration of Eu3+ in LiLn(MO4)2 lattice does not lead to the presence of the concentration-quenching behavior because of their especial crystal structure.
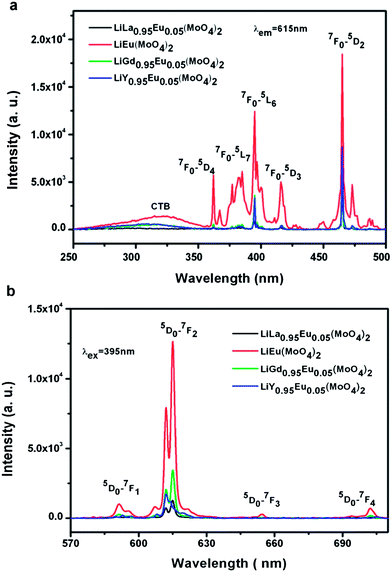 | ||
| Fig. 7 Room-temperature (a) excitation spectra (λem = 615 nm) and (b) emission spectra (λex = 395 nm) of Eu3+ doped LiLn(MoO4)2 samples synthesized by Pechini method. | ||
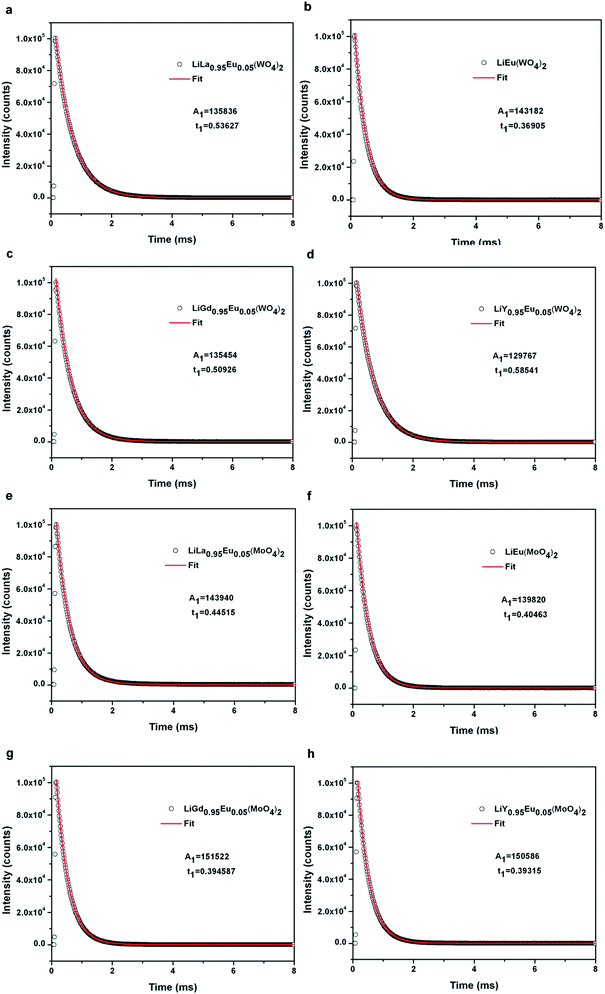
Decay curve of samples Eu3+ doped LiLn(WO4)2 and Eu3+ doped LiLn(MoO4)2 synthesized by Pechini method is shown in Fig. 8. The luminescence lifetime of the 5D0 Eu3+ excited level for Eu3+ doped LiLn(MO4)2 is monitored around the most intense emission line at 615 nm with an excitation wavelength of 395 nm and is calculated by a single exponential function:
I = I0 + A![[thin space (1/6-em)]](https://www.rsc.org/images/entities/char_2009.gif) exp[−(t − t0)/τ] exp[−(t − t0)/τ]
| (1) |
Further, the 5D0 quantum efficiency (η) in Eu3+ doped double tungstates and molybdates is measured in the light of emission spectrum and lifetime of the 5D0 state. Assuming that no other process appears in the depopulation of 5D0 state expect the nonradiative and radiative process, η can be expressed as the following equations
 | (2) |
 | (3) |
 | (4) |
The data of lifetime (τ), radiative (Arad), nonradiative (Anrad) and quantum efficacy (η) are presented in Table 1. From these results, it is clear that the quantum efficiencies of LiLa0.95Eu0.05(WO4)2, LiGd0.95Eu0.05(WO4)2 and LiY0.95Eu0.05(WO4)2 are 45.9%, 54.0% and 57.9%, which seems to be consistent with the result of the lifetime. When the rare earth ions in LiLn(WO4)2 are replaced by 100% Eu3+, the lifetime and quantum efficiency become smaller since the excited-state luminescence centers are trapped easily in the host, leading to the increase of the luminescence killers. The quantum efficiencies of Eu3+ doped in LiLn(MoO4)2 are 42.5% (LiLa0.95Eu0.05(MoO4)2), 52.7% (LiEu(MoO4)2), 42.7% (LiGd0.95Eu0.05(MoO4)2) and 39.5% (LiY0.95Eu0.05(MoO4)2). Due to the presence of surface defects resulting in a large number of nonradiative centers, the quantum efficiencies of Eu3+ doped in LiLn(MO4)2 are ranging from 40% to 60%. However, the emission intensities and lifetimes of these Eu3+ doped in LiLn(MO4)2 are stronger and longer than that of the LiLa(MoO4)2:Eu3+ reported under 395 nm excitation.37 The results indicate that the Eu3+ doped in LiLn(MO4)2 red phosphors have strong potential application in developing high efficiency and stable solid state light.
| Samples | τ (ms) | Arad (ms−1) | Anrad (ms−1) | η (%) |
|---|---|---|---|---|
| LiLa0.95Eu0.05(WO4)2 | 0.536 | 0.856 | 1.010 | 45.9 |
| LiEu(WO4)2 | 0.369 | 1.082 | 1.628 | 39.9 |
| LiGd0.95Eu0.05(WO4)2 | 0.509 | 1.060 | 0.905 | 54.0 |
| LiY0.95Eu0.05(WO4)2 | 0.585 | 0.988 | 0.718 | 57.9 |
| LiLa0.95Eu0.05(MoO4)2 | 0.445 | 0.956 | 1.291 | 42.5 |
| LiEu(MoO4)2 | 0.405 | 1.300 | 1.169 | 52.7 |
| LiGd0.95Eu0.05(MoO4)2 | 0.395 | 1.080 | 1.452 | 42.7 |
| LiY0.95Eu0.05(MoO4)2 | 0.393 | 1.004 | 1.541 | 39.5 |
4. Conclusions
In summary, a simple Pechini method was successfully established to synthesize a series of LiLn(MO4)2:Eu3+ (Ln = La, Eu, Gd, Y, M = W, Mo) red phosphors. The experimental results indicate that the introduction of different rare-earth ions has no effect on the crystal structure. The LiLn(MO4)2:Eu3+ nanoparticles calcined at 800 °C for 2 h have the scheelite structure. Eu3+-doped LiLn(MO4)2 powders exhibit an excellent luminescent properties under a near ultraviolet excitation wavelength of 395 nm, suitable for near UV type LEDs. LiEu(WO4)2 and LiEu(MoO4)2 display the strongest emission intensity among the samples under 395 nm excitation. LiY0.95Eu0.05(WO4)2 has a lifetime of up to 0.586 ms, as well as the quantum efficiency of 57.9%. In this regard, our target products, LiLn(MO4)2:Eu3+, are promising red phosphor to the general illumination with a much improved light quality. Moreover, the synthesis method is highly feasible and low cost, and also readily extended to other rare earth tungstates and molybdates.Acknowledgements
This work was supported by the Natural Science Foundation of Shenzhen and the Starting-Up Funds of South University of Science and Technology of China (SUSTC). S.Y. thanks the support from the Guangdong and Shenzhen Innovative Research Team Program (no. 2011D052, KYPT20121228160843692).Notes and references
- V. Cleave, G. Yahioglu, P. L. Barny, R. H. Friend and N. Tessler, Adv. Mater., 1999, 11, 285 CrossRef CAS.
- P. K. H. Ho, J. S. Kim, J. H. Burroughtes, H. Becker, S. F. Y. Li, T. M. Brown, F. C. Cacialli and R. H. Friend, Nature, 2000, 404, 481 CrossRef CAS PubMed.
- F. Steuber, J. Staudigel, M. Stossel, J. Simmerer, A. Winnacker, H. Spreitzer, F. Weissortel and J. Salbeck, Adv. Mater., 2000, 12, 130 CrossRef CAS.
- J. S. Kim, P. E. Jeon, J. C. Choi, H. L. Park, S. I. Mho and G. C. Kim, Appl. Phys. Lett., 2004, 85, 3696 CrossRef CAS PubMed.
- E. F. Schubert and J. K. Kim, Science, 2005, 308, 1274 CrossRef CAS PubMed.
- C. Feldmann, T. Jüstel, C. R. Ronda and P. J. Schmidt, Adv. Funct. Mater., 2003, 13, 511 CrossRef CAS.
- V. Bachmann, C. Ronda and A. Meijerink, Chem. Mater., 2009, 21, 2077 CrossRef CAS.
- A. Kumar and J. Kumar, J. Mater. Chem., 2011, 21, 3788 RSC.
- R. J. Xie, N. Hirosaki, T. Suehiro, F. F. Xu and M. Mitomo, Chem. Mater., 2006, 18, 5578 CrossRef CAS.
- S. E. Brinkley, N. Pfaff, K. A. Denault, Z. J. Zhang, H. T. Hintzen, R. Seshadri, S. J. Nakamura and S. P. Denbarrs, Appl. Phys. Lett., 2011, 99, 241106 CrossRef PubMed.
- H. L. Li, R. J. Xie, N. Hirosaki and Y. Yajima, J. Electrochem. Soc., 2008, 155, J378 CrossRef CAS PubMed.
- W. T. Chen, H. S. Sheu, R. S. Liu and J. P. Attfield, J. Am. Chem. Soc., 2012, 134, 8022 CrossRef CAS PubMed.
- D. G. Deng, H. Yu, Y. Q. Li, Y. J. Hua, G. H. Jia, S. L. Zhao, H. P. Wang, L. H. Huang, Y. Y. Li, C. X. Li and S. Q. Xu, J. Mater. Chem. C, 2013, 1, 3194 RSC.
- Y. Z. Zheng, H. P. You, G. Jia, K. Liu, Y. H. Song, M. Yang, Y. J. Huang and H. J. Zhang, CrystEngComm, 2010, 12, 585 RSC.
- Q. Zhao, H. P. You, W. LÜ, N. Guo, Y. C. Jia, W. Z. Lv, B. Q. Shao and M. M. Jiao, CrystEngComm, 2013, 15, 4844 RSC.
- M. Law, L. E. Greene, J. C. Johnson, R. Saykally and P. Yang, Nat. Mater., 2005, 4, 455 CrossRef CAS PubMed.
- L. Xu, X. Y. Yang, Z. Zhai, X. Chao, Z. H. Zhang and W. H. Hou, CrystEngComm, 2013, 13, 4921 RSC.
- Z. L. Wang, H. B. Liang, L. Y. Zhou, H. Wu, M. L. Gong and Q. Su, Chem. Phys. Lett., 2005, 412, 313 CrossRef CAS PubMed.
- S. Neeraj, N. Kijima and A. Cheetham, Chem. Phys. Lett., 2004, 387, 2 CrossRef CAS PubMed.
- C. H. Chiu, M. F. Wang, C. S. Lee and T. M. Chen, J. Solid State Chem., 2007, 180, 619 CrossRef CAS PubMed.
- S. Dutta, S. Som and S. K. Sharma, Dalton Trans., 2013, 42, 9654 RSC.
- N. Xue, X. Fan, Z. Wang and M. Wang, J. Phys. Chem. Solids, 2008, 69, 1891 CrossRef CAS PubMed.
- S. S. Liu, D. P. Yang, D. K. Ma, S. Wang, T. D. Tang and S. M. Huang, Chem. Commun., 2011, 47, 8013 RSC.
- J. Dhanaraj, R. Jagannathan, T. R. N. Kutty and C. H. Lu, J. Phys. Chem. B, 2001, 105, 11098 CrossRef CAS.
- M. Galceran, M. Pujol, C. Zaldo, F. Diaz and M. Aguilo, J. Phys. Chem. C, 2009, 113, 15497 CAS.
- Y. G. Su, L. P. Li and G. S. Li, Chem. Mater., 2008, 20, 6060 CrossRef CAS.
- M. Kakihana and M. Yoshimura, Bull. Chem. Soc. Jpn., 1999, 72, 1427 CrossRef CAS.
- Y. Zhang, D. L. Geng, M. M. Shang, X. Zhang, X. J. Li, Z. Y. Cheng, H. Z. Lian and J. Lin, Dalton Trans., 2013, 42, 4799 RSC.
- Z. L. Wang, H. B. Liang, M. L. Gong and Q. Su, J. Alloys Compd., 2007, 432, 308 CrossRef CAS PubMed.
- A. Sarapulova, D. Mikhailova, A. Senyshyn and H. Ehrenberg, J. Solid State Chem., 2009, 182, 3262 CrossRef CAS PubMed.
- L. H. Yi, X. P. He, L. Y. Zhou, F. Z. Gong, R. F. Wang and J. H. Sun, J. Lumin., 2010, 130, 1113 CrossRef CAS PubMed.
- X. Y. Huang, Z. B. Lin, Z. S. Hu, L. Z. Zhang, J. S. Huang and G. F. Wang, Mater. Res. Innovations, 2008, 12, 94 CrossRef CAS PubMed.
- X. Y. Huang, Z. B. Lin, Z. S. Hu, L. Z. Zhang, J. S. Huang and G. F. Wang, Opt. Mater., 2006, 29, 403 CrossRef CAS PubMed.
- X. Y. Huang, Z. B. Lin, Z. S. Hu, L. Z. Zhang, J. S. Huang and G. F. Wang, J. Cryst. Growth, 2004, 269, 401 CrossRef CAS PubMed.
- J. Lei, Y. Yu, L. Li, S. Cheng, G. Li and N. Li, J. Rare Earths, 2012, 30, 330 CrossRef CAS.
- X. Peng, M. C. Schlamp, A. V. Kadavanich and A. Alivisatos, J. Am. Chem. Soc., 1997, 119, 7019 CrossRef CAS.
- J. S. Liao, H. Y. You, D. Zhou, H. R. Wen and R. J. Hong, Opt. Mater., 2012, 34, 1468 CrossRef CAS PubMed.
- R. G. Xie, U. Kolb, J. X. Li, T. Basché and A. Mews, J. Am. Chem. Soc., 2005, 127, 7480 CrossRef CAS PubMed.
- D. V. Talapin, A. L. Rogach, A. Kornowski, M. Haase and H. Weller, Nano Lett., 2001, 1, 207 CrossRef CAS.
- A. Kar and A. Patra, Nanoscale, 2012, 4, 3608 RSC.
- A. Kar, A. Datta and A. Patra, J. Mater. Chem., 2010, 20, 916 RSC.
- Y. Tian, X. H. Qi, X. W. Wu, R. N. Hua and B. J. Chen, J. Phys. Chem. C, 2009, 113, 10767 CAS.
- M. Yu, J. Lin and J. Fang, Chem. Mater., 2005, 17, 1783 CrossRef CAS.
- S. X. Yan, J. H. Zhang, X. Zhang, S. Z. Lu, X. G. Ren, Z. G. Nie and X. J. Wang, J. Phys. Chem. C, 2007, 111, 13256 CAS.
- P. Ghosh and A. Patra, J. Phys. Chem. C, 2007, 111, 7004 CAS.
- A. Kar and A. Patra, J. Phys. Chem. C, 2009, 113, 4375 CAS.
- V. Sudarsan, F. C. Van Veggel, R. A. Herring and M. Raudsepp, J. Mater. Chem., 2005, 15, 1332 RSC.
- S. T. Selvan, T. Hayakawa and M. Nogami, J. Phys. Chem. B, 1999, 103, 7064 CrossRef CAS.
- J. P. Huang, J. Xu, H. S. Luo, X. B. Yu and Y. K. Li, Inorg. Chem., 2011, 50, 11487 CrossRef CAS PubMed.
- H. Y. Li, H. K. Yang, B. K. Moon, B. C. Choi, J. H. Jeong, K. Jang, H. S. Lee and S. S. Yi, J. Mater. Chem., 2011, 21, 4531 RSC.
- B. Yan and Q. M. Wang, Cryst. Growth Des., 2008, 8, 1484 CAS.
- C. X. Liu, J. Y. Liu and K. Dou, J. Phys. Chem. B, 2006, 110, 20277 CrossRef CAS PubMed.
- C. K. Lin, D. Y. Kong, X. M. Liu, H. Wang, M. Yu and J. Lin, Inorg. Chem., 2007, 46, 2674 CrossRef CAS PubMed.
Footnote |
| † Electronic supplementary information (ESI) available. See DOI: 10.1039/c3ra46224b |
| This journal is © The Royal Society of Chemistry 2014 |

