Modulated fluorescence properties in fluorophore-containing gold nanorods@mSiO2

Xuejiao Tian, Jia Guo, Ye Tian, Hongyan Tang and Wuli Yang*
State Key Laboratory of Molecular Engineering of Polymers and Department of Macromolecular Science, Fudan University, Shanghai 200433, People's Republic of China. E-mail: wlyang@fudan.edu.cn

Received 24th October 2013 , Accepted 10th December 2013

First published on 10th December 2013


Abstract

The influencing factors and mechanism of fluorescence enhancement or quenching in mesoporous nanocarriers consisting of gold nanorod cores and mesoporous silica shells (GNR@mSiO2) with controlled thicknesses were investigated. Mesoporous silica can act as a tool to change the distance between the fluorophores and GNRs as well as a vehicle to load the fluorescence molecules in this system. We found that the distance between the GNRs’ surface and the fluorophores, the distribution of fluorophores in mesoporous silica and the kind of fluorophore used were the three main reasons for the fluorescence change. The shell-thickness-dependent fluorescence enhancement of doxorubicin (DOX)-containing GNR@mSiO2 was observed. The maximum metal-enhanced fluorescence (MEF) was obtained when GNR@mSiO2–DOX had the thinnest mesoporous silica shell. Moreover, changing the concentration ratio between GNR@mSiO2 and DOX resulted in different fluorescence enhancement factors. Upon combination of GNR@mSiO2 with other fluorophores, such as hematoporphyrin dihydrochloride (HP) and rhodamine 6G (R6G), the fluorescence enhancement phenomenon was also observed. On the other hand, we found that the fluorescence enhancement factor was reduced when the emission wavelength of the fluorophores was generally close to the surface plasmon resonance wavelength of the gold nanorods. This mechanism was confirmed by fluorescence quenching on fluorescein isothiocyanate (FITC)-containing GNR@mSiO2.

1. Introduction

Gold nanorods (GNRs) have received mounting attention due to their distinct structure-related characteristics and versatile applicability in various biomedical fields, serving as imaging probes, sensors, optical devices and nanomedicines.1–6 To develop GNR-based nanomaterials with improved performances, tremendous effort has been made to investigate the unusual physical properties of GNRs, in particular with respect to photonic energy absorption and transduction by virtue of enhanced surface plasmon resonance in the visible and near-infrared spectra.7–9 Along these lines, one of their interesting phenomena has been deliberately studied, in which GNRs are able to noticeably change the fluorescence behaviour of fluorophores that are positioned within an effective distance of GNRs.4,10,11 This has already been elucidated by metal-enhanced fluorescence (MEF) and is frequently used in fluorescence labelling technology.12–17 As reported previously, the origin of MEF could be interpreted by two contributions occurring between the metal and adjacent fluorophores; (i) increased light absorption by nearby fluorophores on account of the local electric field enhancement, and (ii) increased radiative/nonradiative decay rates of fluorophores causing changes in both the quantum yield and fluorescence lifetime.4 It is therefore documented that single-molecule fluorescence near a single GNR could be greatly enhanced, by up to a thousand fold, and be modulated by adjusting the exact positions of the fluorophores with respect to the GNRs.18–20 However, when the MEF-based technique is extended to other GNR–fluorophore systems, various fluorophore species unambiguously show remarkable discrepancies in their own intrinsic optical properties. Particularly for commonly used organic fluorophores, there is still a lack of better understanding of whether GNRs affect their photoluminescent profiles.

Mesoporous silica-coated GNRs (GNR@mSiO2) have been shown to enhance the photoluminescence of quantum dots by utilizing the silica as a spacer of an appropriate length.21 Also, the phenomenon of fluorescence enhancement by nearby GNRs in mesostructured silica thin films has recently been observed in dark-field images.4 Nevertheless, detailed spectral information is not included in those prior reports.10,18,22,23 As a matter of fact, the introduction of mesoporous silica shells can finely regulate the MEF effect of GNRs for fluorophores in close proximity. It is therefore anticipated that the tunable fluorescence properties in the GNR@mSiO2–fluorophore system by means of a fluorescence spectroscopy technique will be pursued.

With all of these in mind, we prepared mesoporous-silica-encapsulated GNRs with different shell thicknesses to accommodate several commonly used fluorophores. First of all, doxorubicin hydrochloride (DOX), an anti-cancer drug, was chosen as a model fluorophore to combine with GNR@mSiO2. Mesoporous silica acts as the tool to change the distance between a fluorophore and GNR as well as the vehicle to load the fluorescence molecules in this system. The fluorescence enhancement in GNR@mSiO2–DOX was realized by changing the thickness of the mesoporous silica shells and the concentration of the encapsulated DOX, and was elaborately analysed by means of fluorescence spectroscopy. The maximum emission intensity of the GNR@mSiO2–DOX solution was almost three times as high as that of pure DOX at the same concentration. Subsequently, three fluorophores, hematoporphyrin dihydrochloride (HP), fluorescein isothiocyanate (FITC) and rhodamine 6G (R6G), were each encapsulated within the GNR@mSiO2 and showed distinct fluorescence properties. A mechanism was thereby proposed to clarify this phenomena, through comparison of the fluorescence change in the R6G-, DOX- and HP-containing GNR@mSiO2. This study is useful for not only the advancement of fluorescence labelling technology, but also for a combination of diagnosis and therapy. The ability to artificially control fluorescence could be beneficially used in developing contrast agents for highly specific and sensitive optical imaging and sensing.

2. Experimental

2.1. Synthesis of gold nanorods

Gold nanorods were synthesized by a seed-mediated growth method.24,25 The seed solution was prepared first, following a typical protocol: 9.75 mL of 0.1 M cetyltrimethyl ammonium bromide (CTAB) solution was mixed with 0.102 mL of 1% (wt%) chloroauric acid (HAuCl4·3H2O). After that, 0.6 mL of ice-cold 0.01 M NaBH4 was quickly added. Then the solution was kept at 25 °C in a water bath for 2 h before use.

The growth solution contained 40 mL of 0.2 M CTAB, 2 mL of 0.01 M HAuCl4, 0.75 mL of 0.01 M AgNO3, 0.8 mL of 1.0 M HCl solution and 0.32 mL of 0.1 M ascorbic acid. 0.096 mL of the seed solution was gently added to the growth solution in order to induce the growth of gold nanorods. The obtained solution was left undisturbed at 28 °C in a water bath for at least 6 h to allow the nanorods to grow completely. The concentration of the GNR dispersion was 1 mg mL−1. Different aspect ratios of GNRs were prepared by changing the concentration of AgNO3.

2.2. Synthesis of GNR@mSiO2 with different shell thicknesses

Mesoporous silica-coated GNRs were synthesized by a modified Stöber method.26 Moreover, mesoporous silica shells of different thicknesses were obtained by adding varying amounts of tetraethyl orthosilicate (TEOS). First, excess CTAB in the GNR dispersion was washed away with Milli-Q water (twice) and re-dispersed in 40 mL Milli-Q water. Subsequently, 50 μL aqueous ammonia solution (28 wt%) was added to adjust the pH value to about 10.0. Then, 4.5 mL, 7.5 mL or 10.5 mL of 10 mM TEOS–ethanol solution was added to the system over 60 minutes. The reaction mixture was then stirred continuously at 40 °C for 24 h. The synthesized product was centrifuged and washed with Milli-Q water and ethanol several times. Then, the above CTAB-containing mesoporous silica-coated GNRs were added directly into 40 mL of 10 mg mL−1 NH4NO3–ethanol solution. After being stirred at 80 °C for 6 h, the CTAB template was removed by ion exchange. Then the mixture was gathered by centrifugation and repeatedly washed with ethanol. The obtained mesoporous silica-coated GNRs (GNR@mSiO2) were redispersed in Milli-Q water and diluted to 0.5 mg mL−1 for further use.

2.3. Preparation of GNR@mSiO2–fluorophore

A fluorophore (doxorubicin hydrochloride (DOX)/hematoporphyrin dihydrochloride (HP)/rhodamine 6G (R6G)/fluorescein isothiocyanate (FITC)) was dissolved in Milli-Q water at a concentration of 0.01 mg mL−1 followed by the addition of various amounts of GNR@mSiO2 and the mixture was stirred in a weak alkali environment (pH = 8.3) at room temperature for 24 h, to obtain GNR@mSiO2–fluorophores with different weight concentration ratios.

2.4. Characterization

The size distribution of the gold nanorods was determined by analysis of the transmission electron microscopy (TEM) images obtained on a Hitachi H-600 transmission electron microscope, and the samples for TEM measurements were prepared by placing one drop of sample solution on a carbon covered copper grid. The size distribution was averaged for at least 100 particles measured using Image J software. Dynamic light scattering (DLS) data were obtained using a Malvern Autosizer 4700 at a wavelength of 532 nm at 25 °C and an angle of detection of 90°. Ultraviolet-visible (UV-vis) spectra were obtained using a Perkin-Elmer Lambda 35 spectrophotometer. The steady state fluorescence was recorded using an Edinburgh Instruments FLS-920 spectrofluorophotometer by exciting the samples at 480 nm (DOX), 369 nm (HP), 527 nm (R6G) and 494 nm (FITC).

3. Results and discussion

3.1. Fluorescence enhancement in GNR@mSiO2–DOX

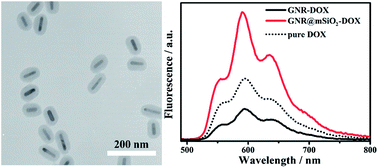
GNRs and GNR@mSiO2 were prepared by the seed-mediated growth method and modified Stöber method, respectively, as described previously.27 The rod-shaped products were monodisperse in size and uniform in morphology (Fig. 1a). The average dimensions of the GNRs were determined by statistical analysis over 100 nanorods in the TEM image due to their non-spherical shapes (DLS data shown in Table S1), giving length × width of 54.0 ± 5.0 nm × 13.0 ± 1.5 nm and an aspect ratio of 4.2 ± 0.5. Also, the mesoporous silica shells coating the GNRs were visualized in Fig. 1b, and the mesoporous silica thickness was estimated to be 20.2 ± 2.5 nm. The surface area, pore volume and pore diameter of GNR@mSiO2 were investigated, as compared with our previous work, all of which were reproducible and indicated mesoporous characteristics. GNRs displayed two plasmon resonance absorptions in the UV-vis spectrum (Fig. 1c). The short-wavelength band was located at around 510 nm due to transverse oscillations of the electrons (perpendicular to the long axis of the rod), and the other absorption was found at 843 nm owing to longitudinal oscillations of the electrons (parallel to the long axis of the rod).28 Upon introduction of the mesoporous silica shells, the longitudinal surface plasmon resonance wavelengths (LSPRWs) were red-shifted to 859 nm (red line), similar to the previous report.
image file: c3ra46082g-f1.tif
Fig. 1 Representative TEM images of (a) GNRs and (b) GNR@mSiO2-20. All scale bars are 200 nm. (c) The UV-vis spectra of GNRs and GNR@mSiO2-20. (d) Fluorescence emission comparison for GNR@mSiO2-20–DOX, including and excluding CTAB, and GNR–DOX and MSN–DOX, in which the amount of DOX was the same.

The encapsulation efficiency of GNR@mSiO2–DOX at a concentration ratio of 200[thin space (1/6-em)]:[thin space (1/6-em)]1 (wt%) was measured to be 98%, implying that DOX was almost totally loaded, without free molecules in solution to perturb the fluorescence measurement. With an excitation of 480 nm, the fluorescence emission peak was observed at 596 nm (Fig. 1d), whereas the intensity increased severely compared to that of free DOX in solution. Considering the identical quantity of DOX and testing conditions (3.0 mL, and 25 °C and pH 8.3 respectively) used in the measurement, the GNR-based fluorescence enhancement was definite and recognisable through normalization of the fluorescence emission peaks at 597 nm. GNR@mSiO2–DOX with shell thickness of 20.2 nm (GNR@mSiO2-20–DOX) exhibited a 2.5 times enhancement compared with that of pure DOX, and a 2.4 times enhancement of quantum yield was also observed (Table S2). In order to study the principles of fluorescence enhancement, we set GNR–DOX, MSN (mesoporous silica nanoparticle)–DOX and GNR@mSiO2–CTAB-20–DOX as controls. To be consistent with the GNR@mSiO2-20–DOX, the GNR–DOX and MSN–DOX solutions were prepared by simple mixing of the primary GNRs and MSNs with DOX solution. As shown in Fig. 1d, the fluorescence of DOX somewhat declined when exposed to both GNRs and MSNs, and the fluorescence intensity decreased to 0.5 and 0.4 compared with that of pure DOX, respectively. We reason that surface photonic energy transfer occurs between DOX and the GNR or MSN matrix.29 Therefore, the fluorescence enhancement could be attributed to a rational combination of GNR@mSiO2 with embedded DOX.

3.2. GNR-enhanced DOX fluorescence dependent on the thickness of mesoporous silica

A series of GNR@mSiO2 with different shell thicknesses were prepared by varying the amount of TEOS added. Fig. 2a and b display the thickness change of the mesoporous silica shell. One can see that the uniform silica shell thickness was tuned from 13.9 ± 2.0 nm to 29.1 ± 5.0 nm, and was applied to identify the corresponding particles, GNR@mSiO2-14 and GNR@mSiO2-29, respectively. Combined with the study on GNR@mSiO2-20, the LSPRWs were found with red-shifts from 843 nm, 851 nm and 859 nm to 869 nm, corresponding to the bare GNRs, GNR@mSiO2-14, GNR@mSiO2-20 and GNR@mSiO2-29, respectively (Fig. 2c and d). The increasing trend is unequivocally dependent on the thickness of the mesoporous silica shell, indicative of the refractive change of the surrounding medium.4,30
image file: c3ra46082g-f2.tif
Fig. 2 TEM images of mesoporous silica coated GNRs with tunable thicknesses: (a) GNR@mSiO2-14, (b) GNR@mSiO2-29. All scale bars represent 200 nm. (c) The UV-vis spectra of GNRs and GNR@mSiO2 with different thicknesses, (d) magnified image for longitudinal plasmon peaks of GNR@mSiO2 with different thicknesses in (c).

The fluorescence properties of a series of GNR@mSiO2-n–DOX (n = 14, 20, 29) in aqueous solution were studied under identical conditions. GNR@mSiO2-14–DOX allowed a maximum MEF enhancement factor of as high as 2.9 (Fig. 3a), and as the silica shell thickness was increased, the enhancement factors were reduced to ∼2.5 and ∼1.7 for GNR@mSiO2-20–DOX and GNR@mSiO2-29–DOX, respectively. As mentioned above, GNRs support a collective response from conduction electrons, which can concentrate the optical field near a nanorod. But the local field enhancement is not uniform around the nanorod. Once the DOX–GNR distance is strictly confined to a range of approximately 4–10 nm, the fluorescence of DOX can be improved dramatically as a result of the magnified absorption and the enhanced radiative decay rate by the local field of GNRs.10 A similar phenomenon has been observed in our previous work.31 Thus, accommodation of DOX in the mesoporous silica shells controls the DOX–GNR interaction to within a pre-determined space and the increase in shell thickness gives rise to a distribution of DOX which deviates from the MEF-available zone, leading to a reduction of fluorescence. Thus, GNR@mSiO2-14–DOX exhibit the largest fluorescence enhancement compared to other cases with thicker mesoporous silica surrounding the GNRs.


image file: c3ra46082g-f3.tif
Fig. 3 (a) Irradiated at 480 nm, the fluorescence spectra of pure DOX, GNR–DOX and GNR@mSiO2–DOX with different thicknesses at a concentration ratio of 200[thin space (1/6-em)]:[thin space (1/6-em)]1. (b) The fluorescence spectra of pure DOX and GNR@mSiO2-20–DOX with different concentration ratios of 50[thin space (1/6-em)]:[thin space (1/6-em)]1, 100[thin space (1/6-em)]:[thin space (1/6-em)]1, 200[thin space (1/6-em)]:[thin space (1/6-em)]1 and 300[thin space (1/6-em)]:[thin space (1/6-em)]1 and the relative fluorescence enhancement factors at different encapsulation efficiencies.

Besides the thickness-dependent fluorescence enhancement, we also investigated the effect of concentration ratios of GNR@mSiO2 and DOX. As shown in Fig. 3b, ∼2.5 times, ∼2.5 times, ∼2.1 times and ∼1.2 times fluorescence enhancements were observed for GNR@mSiO2-20–DOX at concentration ratios of 300[thin space (1/6-em)]:[thin space (1/6-em)]1, 200[thin space (1/6-em)]:[thin space (1/6-em)]1, 100[thin space (1/6-em)]:[thin space (1/6-em)]1 (Fig. S1) and 50[thin space (1/6-em)]:[thin space (1/6-em)]1, respectively. We found that as the concentration ratio increased, the fluorescence enhancement factor increased when the ratio was lower than 200[thin space (1/6-em)]:[thin space (1/6-em)]1. This phenomenon could be ascribed to the different encapsulation efficiencies of GNR@mSiO2–DOX, accordingly causing the distribution change of DOX in mesoporous silica. Since fluorescence enhancement is derived from captured DOX near the GNR surface rather than free DOX in solution, a lower encapsulation efficiency means fewer DOX molecules in the mesoporous silica, resulting in a decrease in the fluorescence enhancement factor.

We also changed the volume of AgNO3 to prepare GNRs with different aspect ratios (Fig. S2). The GNRs were thinner when more AgNO3 solution was used, resulting in an increase of the length-to-width aspect ratio. Aqueous solutions of DOX-containing GNR@mSO2-20 with different aspect ratios were also fabricated. Their fluorescence spectroscopy was then studied at a concentration ratio of 200[thin space (1/6-em)]:[thin space (1/6-em)]1 (wt%). The enhancement factors of GNR@mSiO2-20–DOX with aspect ratios of 2.5, 2.9, 3.8, 4.0, 4.2 and 4.6 were ∼2.5, ∼2.4, ∼2.1, ∼2.1, ∼2.5 and ∼2.2, respectively (Fig. S2 and Table S3). These results indicate that the size and shape (aspect ratio) of GNRs has little effect on fluorescence enhancement.

3.3. Fluorescence enhancement for other fluorophores

Two fluorophores, R6G and HP, were chosen to study the effect of the fluorophore species on the fluorescence enhancement effect of GNR@mSiO2. The fluorescence excitation wavelengths of R6G, DOX and HP were 527, 480 and 369 nm, and their emission wavelengths were 552, 596 and 616 nm, respectively. As shown in Fig. 4a and b, fluorescence enhancement factors of ∼3.8, ∼2.8 and ∼2.7 are observed for GNR@mSiO2-14–HP, GNR@mSiO2-20–HP and GNR@mSiO2-29–HP, respectively, at a concentration ratio of 200[thin space (1/6-em)]:[thin space (1/6-em)]1 (wt%). Also, fluorescence enhancement factors of 1.2, 1.2 and 1.1 were obtained for GNR@mSiO2–R6G with mesoporous silica shell thicknesses of ∼14 nm, ∼20 nm and ∼29 nm, respectively. Moreover, the fluorescence spectra of HP- and R6G-containing GNR@mSiO2 with different shell thicknesses at a concentration ratio of 100[thin space (1/6-em)]:[thin space (1/6-em)]1 (wt%) were also recorded (Fig. S3 & S4). It is proven again that a thinner mesoporous silica shell causes a larger fluorescence enhancement, consistent with the aforementioned finding from the GNR@mSiO2–DOX.
image file: c3ra46082g-f4.tif
Fig. 4 (a) Irradiated at 369 nm, the fluorescence spectra of pure HP and GNR@mSiO2–HP with different thicknesses at a concentration ratio of 200[thin space (1/6-em)]:[thin space (1/6-em)]1. (b) Irradiated at 527 nm, the fluorescence spectra of pure R6G and GNR@mSiO2–R6G with different thicknesses. (c) The UV-vis spectrum of GNR@mSiO2-20 and fluorescence emission spectra of pure FITC/R6G/DOX/HP. (d) Irradiated at 494 nm, the fluorescence spectra of pure FITC and GNR@mSiO2–FITC with different shell thicknesses.

To our knowledge, quenching of fluorescence always occurs on the spherical Au-nanoparticle-supporting fluorophores, whose surface plasmon resonance wavelengths (SPRW) are approximately 520 nm (ref. 32 and 33), overlapping the fluorescence emission wavelength. The main reason for the decrease in fluorescence intensity is that the energy of the excited fluorophore molecules is transferred to the Au nanoparticles by a non-radiation mode, but the energy transfer effect decreases with fluorescence emission wavelength far from the SPRW.24 The GNR@mSiO2 give a transverse surface plasmon resonance wavelength (TSPRW) of around 510 nm. With reference to the above analysis, we attempted to establish the relationship between the TSPRW of GNRs and the fluorescence emission of entrapped molecules. Fig. 4c shows that the emission wavelength of pure R6G is 552 nm, very close to the TSPRW of GNR@mSiO2 at 510 nm. Those of DOX and HP are located at 596 nm and 616 nm, far from the TSPRW. Thus the fluorescence emission of R6G may severely suffer from non-radiation energy transfer, and its corresponding fluorescence enhancement factor is lower than the others. Additionally, the LSPRW of GNR@mSiO2-14, with a GNR core aspect ratio of 4.2, is 851 nm; so it has little effect on the fluorescence enhancement of R6G. In order to further validate our hypothesis, FITC with an emission wavelength of 520 nm was used to study the effect of surface plasmon resonance on the emission process at a concentration ratio of 200[thin space (1/6-em)]:[thin space (1/6-em)]1 (wt%) (Fig. 4d) (ratio of 100[thin space (1/6-em)]:[thin space (1/6-em)]1 (wt%) see Fig. S5). Due to a complete overlap of GNR@mSiO2 with the TSPRW, the fluorescence intensity decreased to 0.5, 0.4 and 0.4 compared with that of pure FITC for GNR@mSiO2-14–FITC, GNR@mSiO2-20–FITC and GNR@mSiO2-29–FITC, respectively (Table 1).

Table 1 The fluorescence enhancement factors for different fluorophore-containing GNR@mSiO2 with mesoporous silica shells of different thicknesses.
Sample/fluorophore FITC R6G DOX HP
GNR@mSiO2-14 0.5 1.2 2.9 3.8
GNR@mSiO2-20 0.4 1.2 2.5 2.8
GNR@mSiO2-29 0.4 1.1 1.7 2.7


4. Conclusions

To summarize, we prepared a well-defined composite nanomaterial consisting of uniform GNRs as the core with mesoporous silica shells, and further implemented control of shell thickness from 13.9 nm to 29.1 nm to study the MEF effect of loaded fluorophores. Since the local field enhancement decayed exponentially away from the GNR surface, a thinner mesoporous silica shell facilitated the increase of the fluorescence enhancement factor for the captured fluorophores. As proven in our work, the maximum enhancement factor of 2.9 was obtained in GNR@mSiO2-14–DOX. Also, as the concentration ratio of GNR@mSiO2 and DOX was varied, the fluorescence enhancement factor changed correspondingly because the encapsulation efficiency influenced the distribution of DOX molecules in the mesoporous silica. Subsequently, more fluorophores with their own fluorescence properties were entrapped in the GNR@mSiO2, and these composites exhibited an equal fluorescence enhancement. The HP- and R6G-loaded GNR@mSiO2-14 had fluorescence enhancement factors of 3.8 and 1.2, respectively. On the other hand, when the fluorescence emission wavelength was generally close to the surface plasmon resonance wavelength of gold nanorods, the fluorescence showed a pronounced decrease or was quenched. This finding was proven by the fluorescence change of GNR@mSiO2–FITC. Overall, we found that fluorescence enhancement or quenching is dependent on three factors; the distance between the GNRs’ surface and the fluorophores, the distribution of fluorophores in mesoporous silica and the kind of fluorophore used.

Acknowledgements

We are grateful for the support of the National Science Foundation of China (Grant no. 51273047 and 81270326) and the “Shu Guang” project (12SG07) supported by Shanghai Municipal Education Commission and Shanghai Education Development Foundation.

Notes and references

  1. X. H. Huang, S. Neretina and M. A. El-Sayed, Adv. Mater., 2009, 21, 4880–4910 CrossRef CAS.
  2. A. Gole and C. J. Murphy, Chem. Mater., 2004, 16, 3633–3640 CrossRef CAS.
  3. G. H. Pontifex, P. Zhang, Z. Wang, T. L. Haslett, D. Almawlawi and M. Moskovits, J. Phys. Chem., 1991, 95, 9989–9993 CrossRef CAS.
  4. Z. Yang, W. H. Ni, X. S. Kou, S. Z. Zhang, Z. H. Sun, L. D. Sun, J. F. Wang and C. H. Yan, J. Phys. Chem. C, 2008, 112, 18895–18903 CAS.
  5. X. Li, J. Qian, L. Jiang and S. L. He, Appl. Phys. Lett., 2009, 94, 063111 CrossRef PubMed.
  6. J. W. Stone, N. J. Thornburg, D. L. Blum, S. J. Kuhn, D. W. Wright and J. E. Crowe, Nanotechnology, 2013, 24, 295102 CrossRef CAS PubMed.
  7. L. Vigderman, B. P. Khanal and E. R. Zubarev, Adv. Mater., 2012, 24, 4811–4841 CrossRef CAS PubMed.
  8. M. A. El-Sayed, Acc. Chem. Res., 2001, 34, 257–264 CrossRef CAS PubMed.
  9. W. Jo and M. J. Kim, Nanotechnology, 2013, 24, 195104 CrossRef PubMed.
  10. R. Bardhan, N. K. Grady, J. R. Cole, A. Joshi and N. J. Halas, ACS Nano, 2009, 3, 744–752 CrossRef CAS PubMed.
  11. J. Wang, J. Moore, S. Laulhe, M. Nantz, S. Achilefu and K. A. Kang, Nanotechnology, 2012, 23, 095501 CrossRef PubMed.
  12. J. R. Lakowicz, Subcell. Biochem., 1988, 13, 89–126 CAS.
  13. J. R. Lakowicz, J. Malicka, I. Gryczynski and Z. Gryczynski, Biochem. Biophys. Res. Commun., 2003, 307, 435–439 CrossRef CAS.
  14. C. D. Geddes, A. Parfenov, D. Roll, J. Y. Fang and J. R. Lakowicz, Langmuir, 2003, 19, 6236–6241 CrossRef CAS PubMed.
  15. J. R. Lakowicz, Anal. Biochem., 2005, 337, 171–194 CrossRef CAS PubMed.
  16. R. Marouga, S. David and E. Hawkins, Anal. Bioanal. Chem., 2005, 382, 669–678 CrossRef CAS PubMed.
  17. M. H. Chowdhury, K. Ray, M. L. Johnson, S. K. Gray, J. Pond and J. R. Lakowicz, J. Phys. Chem. C, 2010, 114, 7448–7461 CAS.
  18. H. F. Yuan, S. Khatua, P. Zijlstra, M. Yorulmaz and M. Orrit, Angew. Chem., Int. Ed., 2013, 52, 1217–1221 CrossRef CAS PubMed.
  19. K. A. Kang, J. T. Wang, J. B. Jasinski and S. Achilefu, J. Nanobiotechnol., 2011, 9, 16 CrossRef CAS PubMed.
  20. B. Hong and K. A. Kang, Biosens. Bioelectron., 2006, 21, 1333–1338 CrossRef CAS PubMed.
  21. X. Li, F. J. Kao, C. C. Chuang and S. L. He, Opt. Express, 2010, 18, 11335–11346 CrossRef CAS PubMed.
  22. H. F. Wang, T. B. Huff, D. A. Zweifel, W. He, P. S. Low, A. Wei and J. X. Cheng, Proc. Natl. Acad. Sci. U. S. A., 2005, 102, 15752–15756 CrossRef CAS PubMed.
  23. J. W. Liaw, H. Y. Tsai and C. H. Huang, Plasmonics, 2012, 7, 543–553 CrossRef CAS.
  24. S. Eustis and M. El-Sayed, J. Phys. Chem. B, 2005, 109, 16350–16356 CrossRef CAS PubMed.
  25. B. Nikoobakht and M. A. El-Sayed, Chem. Mater., 2003, 15, 1957–1962 CrossRef CAS.
  26. C. G. Wang, Z. F. Ma, T. T. Wang and Z. M. Su, Adv. Funct. Mater., 2006, 16, 1673–1678 CrossRef CAS.
  27. H. Y. Tang, S. Shen, J. Guo, B. S. Chang, X. G. Jiang and W. L. Yang, J. Mater. Chem., 2012, 22, 16095–16103 RSC.
  28. S. Link and M. A. El-Sayed, Int. Rev. Phys. Chem., 2000, 19, 409–453 CrossRef CAS.
  29. T. Sen, S. Jana, S. Koner and A. Patra, J. Phys. Chem. C, 2010, 114, 707–714 CAS.
  30. H. J. Chen, X. S. Kou, Z. Yang, W. H. Ni and J. F. Wang, Langmuir, 2008, 24, 5233–5237 CrossRef CAS PubMed.
  31. X. Huang, X. J. Tian, W. L. Yang, B. Ehrenberg and J. Y. Chen, Phys. Chem. Chem. Phys., 2013, 15, 15727–15733 RSC.
  32. E. Dulkeith, M. Ringler, T. A. Klar, J. Feldmann, A. M. Javier and W. J. Parak, Nano Lett., 2005, 5, 585–589 CrossRef CAS PubMed.
  33. G. Schneider, G. Decher, N. Nerambourg, R. Praho, M. H. V. Werts and M. Blanchard-Desce, Nano Lett., 2006, 6, 530–536 CrossRef CAS PubMed.

Footnote

Electronic supplementary information (ESI) available. See DOI: 10.1039/c3ra46082g

This journal is © The Royal Society of Chemistry 2014
Click here to see how this site uses Cookies. View our privacy policy here.