Electrochemical properties of poly(3,4-ethylenedioxythiophene) grown on Pt(111) in imidazolium ionic liquids

Andrea P. Sandovala, Juan M. Feliub, Roberto M. Torresic and Marco F. Suárez-Herrera*a
aDepartamento de Química, Facultad de Ciencias, Universidad Nacional de Colombia, Carrera 30 #45-03. Edificio 451, Bogotá, Colombia. E-mail: mfsuarezh@unal.edu.co; Fax: +57 1 3165220; Tel: +57 1 3165000, ext. 14459
bInstituto Universitario de Electroquímica, Universidad de Alicante, Apartado 99, E-03080, Alicante, Spain
cInstituto de Química, Universidade de São Paulo (USP), CP 26077, 05513-970, São Paulo-SP, Brazil

Received 22nd October 2013 , Accepted 26th November 2013

First published on 27th November 2013


Abstract

Poly(3,4-ethylenedioxythiophene) (PEDOT) was galvanostatically synthesized and studied on a Pt(111) electrode in the following ionic liquids: 1-ethyl-3-methylimidazolium bis(trifluoromethylsulfonyl)imide ([Emim][NTf2]), 1-ethyl-2,3-dimethylimidazolium bis(trifluoromethylsulfonyl)imide ([Emmim][NTf2]), 1-butyl-3-methylimidazolium trifluoromethanesulfonate ([Bmim][OTf]) and 1-butyl-2,3-methylimidazolium bis(trifluoromethylsulfonyl)imide ([Bmmim][NTf2]) by cyclic voltammetry, chronoamperometry and electrochemical impedance spectroscopy. The thin films prepared with this method and cycled in these ionic liquids show high n-doping currents and high rates of ion exchange during redox switching compared to those obtained in molecular solvents.

Introduction

Conducting polymers are one of the most important subjects of research due to their electrical, electrocatalytic and optical properties. They have been studied for multiple electrochemical devices1–3 including fuel cells4,5 and lithium ion batteries.6 Among them, poly(3,4-ethylenedioxythiophene) (PEDOT) has been extensively studied mainly due to its high conductivity, electrochemical and thermal stability.7 However, the influence of the electrode surface and the electrolyte used for the synthesis on the final properties of conducting polymers is not completely understood.

Recent results show that the structure of the electrode surface affects many properties of the polymer thin films as adhesion, coverage, morphology, and redox kinetics.8,9 Moreover, new reversible redox transitions have been observed in the case of polythiophene10 and polyaniline11 synthesized on Pt single crystals. These facts suggest that the growth and organization of the polymer on the surface during the first stages of growth are affected by the surface structure.

On the other hand, some interesting results have been obtained by using ionic liquids (ILs) as electrolytes for the electrochemical synthesis of conducting polymers.

Besides its environmental friendly properties, high thermal stability and wide potential window, ILs have a particular internal order that is intensified at the electrode/IL interface, where the ions form a network of polar and non-polar domains due to the electrostatic aggregation of molecular groups.12 The exact packing patterns of IL ions close to a charged surface are not well known, but it can be expected to form a layered structure near the surface, which is stabilized by the electric field.12 Under strong applied electrical fields at the electrode/IL interface, ILs are likely to organize as liquid crystals and this behaviour can affect the structure and morphology of the electropolymerized conducting polymers. Indeed, it has been shown that thin films of a variety of conducting polymers synthesized in ILs are more electroactive, stable and organized than those synthesized in conventional electrolytes.5,13–20 Therefore, the structure of the conducting polymer can be controlled by changing, both, the single crystal electrode surface and the IL used for the electropolymerization.

In this work we study the electrochemical synthesis and electrochemical properties of thin films of PEDOT grown on Pt(111) and using different imidazolium ionic liquids, which are moisture-stable,21,22 as electrolytes. Pt(111) electrode is used in this work due to its well-known structure and the reproducibility of the state of its surface (cleanness and surface energy).23

Experimental

The electrochemical experiments were performed in single compartment glass cells, where a platinum wire was used as counter electrode, and a silver wire was used as the pseudoreference electrode. A platinum single crystal electrode with a (111) surface orientation (approximately 2 mm diameter) was used as working electrode, which was prepared from small single-crystal beads following the method developed by Clavilier et al.23 All potentials are referred to the potential of the ferrocene/ferrocenium couple (Cp2Fe).

Prior to each experiment the cell was deaerated with N2 (99.999, Cryogas). The electrodes were heated in a gas–oxygen flame, cooled down in a reductive atmosphere (H2 + N2) and protected with a droplet of the ionic liquid at low enough temperatures to avoid decomposition. Then, the single-crystal electrode was positioned in contact with the ionic liquid using a meniscus configuration.

The ionic liquids 1-ethyl-3-methylimidazolium bis(trifluoromethylsulfonyl)imide ([Emim][NTf2]), 1-ethyl-2,3-dimethylimidazolium bis(trifluoromethylsulfonyl)imide ([Emmim][NTf2]), 1-butyl-3-methylimidazolium trifluoromethanesulfonate ([Bmim][OTf]), all of >99% purity, were purchased from Ionic Liquids Technologies GmbH (Io-li-tec). 1-butyl-2,3-methylimidazolium bis(trifluoromethylsulfonyl)imide ([Bmmim][NTf2]) was synthesized as it was reported by Bazito et al.24 All of them were vacuum-dried for 4 h at room temperature before each experiment.

Polymer films were grown under galvanostatic conditions by applying a current density of 0.124 mA cm−2 during 50 s to the working electrode in a solution of 0.1 M 3,4-ethylenedioxythiophene (EDOT, Sigma-Aldrich 97%). After the electropolymerization, the PEDOT films were rinsed with the ionic liquid free of the monomer and then positioned in contact with fresh ionic liquid using a meniscus configuration.

A commercially available potentiostat/galvanostat μ Autolab II (Ecochemie) was used for the electrochemical experiments. The electrochemical impedance spectra (EIS) was obtained with a Model 600E Series Electrochemical Analyzer/Workstation (CH Instruments) at different potentials depending on the IL, and using a stimulus of 5 mV AC voltage and frequencies between 825 kHz and 0.1 Hz. The impedance data were fitted to equivalent-electrical circuits using the software Eisanalyzer.25

Results and discussion

For electrochemistry applications ILs need to have high air and water stability and also high conductivity.22 Hence, the ILs used in this study are based in the imidazolium cation because they have high conductivities. The anions [NTf2] and [OTF] were chosen because they show high stability against water.21 However, as we are interested in how the polymer film is modified by the structure of the ionic liquid, a brief discussion about the structure of the cations is needed. The main change in the imidazolium cation is the length of the alkyl group in the position 1 of the aromatic ring. Therefore the [Bmim]+, with a butyl group has higher volume than [Emim]+ with an ethyl group. Also, it is known that the hydrogen in position 2 is acid and the substituent in position 2 was changed by a methyl group in order to observe if the polymer film was affected by this feature. Each structural change is reflected in the physical properties of the ILs, which are listed in Table 1. It is also important to notice that Pt(111) electrode was selected due to its stability and because it has been observed that conducting polymers grow on this surface layer by layer giving very flat films.26
Table 1 Physical properties of the ionic liquids. Data from ref. 22 and 24. The working temperatures were between 20 and 25 °C
IL Tm (°C) ρ (g cm−3) η (mPa s) σ (mS cm−1)
[Emim][NTf2]22 −3, −21 1.52 (22) 34 (25) 8.8 (22)
[Emmim][NTf2]22 20 1.495 (21) 88 (20) 3.2 (20)
[Bmim][OTf]22 16 1.29 (20) 90 (20) 3.7 (20)
[Bmmim][NTf2]24 −13 1.42 (25) 93 (25) 1.6 (25)


Voltammetry of PEDOT films on Pt(111)

PEDOT films were galvanostatically synthesized on Pt(111) electrode and then cycled in the IL free of EDOT. Fifty scans at 100 mV s−1 were run in the potential region where the p-doping process occurs until a stable response was obtained. The 50th scan of each film is shown in Fig. 1a. For comparison purposes, Fig. 2 shows the voltammogram of PEDOT on Pt(111) obtained in 0.1 M [Bmim][OTf] in acetonitrile.
image file: c3ra46028b-f1.tif
Fig. 1 (a) Cyclic voltammograms of PEDOT in [Emim][NTf2] (solid line), [Emmim][NTf2] (dashed line), [Bmim][OTf] (dotted line), [Bmmim][NTf2] (dashed dotted line). The scan rate was 100 mV s−1 and it is shown the 50th cycle. (b) Cyclic voltammograms of PEDOT synthesized in [Bmim][OTf] at different scan rates from 10 to 1000 mV s−1. It is shown the first cycle.

image file: c3ra46028b-f2.tif
Fig. 2 Cyclic voltammogram of PEDOTon a Pt(111) electrode in 0.1 M [Bmim][OTf] in acetonitrile. The film was galvanostatically synthesized using a current density of 0.124 mA cm−2 during 100 s and 0.1 M EDOT in [Bmim][OTf]. It is shown the 50th cycle.

Fig. 1a and 2 show that the electrochemical behaviour of PEDOT depends on the IL used for the synthesis and it differs also from the behaviour observed in electrolytes dissolved in molecular organic solvents,27 where only one broad oxidation peak is observed (Fig. 2). Fig. 1a clearly shows two anodic signals and two well-defined cathodic peaks in all ILs used. It can be seen that the potential difference between A1 and A2 peaks is higher in the ILs with an ethyl group in the imidazolium cation than those that contains a butyl group. This behaviour was observed by Randriamahazaka et al.28 when thin films of PEDOT synthesized on a platinum disk in acetonitrile were cycled for one hour in pure [Emim][NTf2]. Also, Damlin et al.20 observed two oxidation peaks during the first stages of polymerization of PEDOT in 1-butyl-3-methylimidazolium tetrafluoroborate.

In the case of PEDOT cycled in [Emim][NTf2] it was proposed that the two anodic and cathodic peaks are related with a compact structure coexisting with an open structure, as it was originally suggested by Hillman et al. for the case of other conducting polymers.28,29 However, the authors state that there are two redox reaction mechanisms that depends on the electrodeposition method. Here we have shown that using highly controlled conditions of synthesis, i.e. using a well-defined surface structure, Pt(111), and also using an ionic liquid, the two anodic peaks are only seen when the film is cycled in the ionic liquid but not in acetonitrile. It is possible that this behaviour corresponds to films with high organization and longer length chains. In this conditions, these two peaks can correspond to two redox processes associated to the conversion between the neutral and the polaronic states (A1/C1) and between the polaronic and the bipolaronic states (A2/C2), as it was proposed for polythiophene synthesized on platinum single crystals.10

Fig. 1b shows the effect of the potential scan rate on the voltammogram of PEDOT films in [Bmim][OTf]. This figure shows that the peak heights have a linear relationship with the scan rate, which is characteristic of a surface controlled process. This behaviour was observed for all ILs studied.

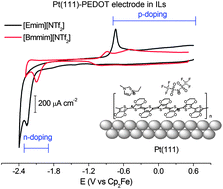
On the other hand, when the potential window is extended to very negative potentials as it can be seen in Fig. 3, there is a reduction peak, C3, related to a n-doping process that causes also the appearance of an anodic peak A3. It is important to notice that the relative height of the C3 and A3 peaks, in comparison to C1 peak, in [Emim][NTf2] are about three times higher than those observed for the other studied ILs and those reported for PEDOT in acetonitrile29 or in other imidazolium ionic liquids.20 The latter results suggest that in [Emim][NTf2] the PEDOT films can reach high n-doping concentration.


image file: c3ra46028b-f3.tif
Fig. 3 Cyclic voltammograms of PEDOT films in a potential range where both the n-doped and p-doped states are seen: [Emim][NTf2] (solid line), [Emmim][NTf2] (dashed line), [Bmim][OTf] (dotted line), [Bmmim][NTf2] (dashed dotted line). Scan rate: 100 mV s−1.

The wide separation or ‘inert zone’ of ΔEp ox-red ≈ 1.5 V between the peaks A3 and C3 is characteristic for a wide range of solid-state electrochemical processes. This behaviour has been attributed to structural changes associated with the process of cation insertion and expulsion into/from the solid, ion trapping or high reorganization energies.29 From the other points of view, systems with large peak separations have been interpreted in terms of nucleation and growth mechanisms.30 For example, with the closely related cases of solid films of 7,7,8,8-tetracyanoquinodimethane31–33 and C6034 this mechanism seems preferable to other schemes that have been reported.

Taken into account these facts, it seems that the A3/C3 process corresponds to a n-doping redox process where the oxidation of the n-doped state begins only when the polymer can be oxidized to the polaronic state. In other words, once the polymer is in the n-doped state it cannot be oxidized directly to the neutral state and instead of that, the polymer is oxidized from the n-doped state directly to the polaronic state. It suggests that there is a huge energetic barrier for the nucleation process associated to this redox transformation of PEDOT in ILs.

The high relative current densities observed for the peak C3 indicate that the use of ionic liquids allows to obtain high n-doped levels, probably due to a higher stabilization of the negative charge with the bulky imidazolium cations. The n-doped level decreases in the order [Emim][NTf2] > [Emmim][NTf2] > [Bmmim][NTf2] > [Bmim][OTf]. This result opens the possibility of using PEDOT as electron acceptor in devices like electrochemical solar cells or batteries that use ILs as electrolytes.

Ion exchange kinetics of PEDOT films

The electrochemical reduction and oxidation reactions of conducting polymers are possible due to ion transport from the electrolyte to the polymer and vice-versa. In ILs, where the concentration of ions is very high, it is expected that the charge compensation depends on the nature of both co-ions and counterions. If the ions are sufficiently large, as it is the case in most ILs, then they can be trapped in the polymer and charge neutrality is primarily maintained by the ingress of the counterions.35 In this sense we studied the ion exchange kinetics of thin films of PEDOT in the ILs by using the chronoamperometric technique. The step potentials in Fig. 4 were chosen to jump between similar oxidation states of PEDOT in all ILs used.
image file: c3ra46028b-f4.tif
Fig. 4 Potential steps of PEDOT in [Emim][NTf2] (solid line) between −1.4 and 0.60 V, [Emmim][NTf2] (dashed line) between −1.55 and 0.45 V, [Bmim][OTf] (dotted line) between −1.34 and 0.66 V, [Bmmim][NTf2] (dashed dotted line) between −1.49 and 0.51 V. (a) Oxidation potential step (b) reduction potential step. Insert (c) and (d) Zoom of oxidation and reduction potential step of [Bmim][OTf], respectively.

Fig. 4 shows that the kinetics of ion exchange upon the potential steps is very fast for all ILs studied. Besides, at the first milliseconds, Fig. 4c, it is possible to see a peak. Otero et al.36 have related this kind of behaviour with a nucleation process during the oxidation reaction because the oxidation of the film starts from a packed conformation that needs more energy to be swelled. In this model only one peak is predicted in the current transients. However, Fig. 4c and d show two shaded shoulders in the current traces. This fact suggests the presence of two consecutive nucleation processes during the ion exchange process of PEDOT films in the imidazolium type ILs studied, which can be related to the transition towards two different oxidation stages of PEDOT in agreement with the results of the cyclic voltammetry and the electron paramagnetic resonance (EPR) measurements.37,38 These features are not seen when the PEDOT films are synthesized in molecular solvents,26 but are similar to those observed with thin films of polythiophene synthesized on single crystal platinum electrodes in dry acetonitrile.10

Fig. 4 shows that the rate of ion exchange decreases in the following order [Emim][NTf2] ≫ [Bmim][OTf] > [Emmim][NTf2] > [Bmmim][NTf2]. The fact that the current transient during the oxidation and reduction steps changes with the chemical structure of the IL cation, when the anion is the same, indicates that cations are taking part in the ionic exchange process. That means that along with the anions, the cations enter in the structure of the polymer. Besides, a clear correlation appears between structure of the imidazolium cation and the ion exchange kinetics since the larger the substituent in position 1 and the presence of the methyl group in position 2 produces longer times of ion exchanges, in agreement with the change of the transport number for each cation.22

It is interesting to notice that in [Emim][NTf2] the ion exchange rate is similar of that reported for PEDOT films of similar thickness in tetrabutylammonium hexafluorophosphate (Bu4NPF6)/acetonitrile,26 which is the electrolyte where the ion exchange of PEDOT films occurs with the fastest rate, in spite of the fact that the IL ions have bigger sizes than those studied in molecular solvents. This similarity suggests that the compensation of the charge is afforded easier in the IL than in molecular solvent electrolytes. It is not clear how this process happens in IL, but it seems that a rearrangement of charge distribution due to the ion polarization is the main process involved in the charge compensation, instead of the movement of ions out from inside the polymer.

When the step is made from the p-doped to the non-doped states of PEDOT the decay of the absolute value of the current density has a sharp fall to cero at the end of the process, as it can be seen in Fig. 4d around 0.08 s. This behaviour can be explained if the polymer suddenly acquires a more tight structure and the reduction of the most internal PEDOT chains cannot proceed because they are electrically isolated by the most external no conducting layer.

AC voltammetry and electrochemical impedance spectroscopy of PEDOT films

The AC voltammetry and the Electrochemical Impedance Spectroscopy (EIS) can give a deeper understanding of the electrochemical properties of PEDOT films because these techniques can differentiate much better between capacitive and faradic currents. Fig. 5 shows the AC voltammograms of the PEDOT films in the four studied ILs at two different frequencies: 5 and 250 Hz. This figure shows several differences in the electrochemical behaviour of PEDOT films in contact with the different ILs.
image file: c3ra46028b-f5.tif
Fig. 5 AC voltammograms of PEDOT films in (a) [Emim][NTf2], (b)[Emmim][NTf2], (c) [Bmim][OTf] and (c) [Bmmim][NTf2] at 5 Hz and 250 Hz. The amplitude of the electric potential was 5 mVrms and the step potential was 5 mV. Solid lines show the negative potential scan direction traces and the dotted lines shows the positive potential scan direction traces.

First of all, the conducting polymer films exhibit a hysteresis of about 100 mV between positive-going and negative-going scan. This hysteresis response has also been observed in the conductivity,39,40 mass change by electrochemical quartz microbalance,29,41 and EPR spectroscopy measurements of PEDOT37,38 and other conducting polymers. This behaviour has been explained mainly due to the high reorganization energy involved in the transition between the compact structure, at the reduced state, to the more open structure, in the oxidized state.

At 5 Hz the general profile resembles the one observed by cyclic voltammetry. Particularly, it can be seen two current shoulders in the positive-going potential scan at the same positions where the peaks A1 and A2 were observed in the cyclic voltammograms, supporting once again that two consecutive redox transitions take place upon redox switching in this potential range. However, the resolution of these two signals is less pronounced in the negative-going potential scan.

The ionic and “electronic” (it means electrons and holes) impedances of the PEDOT film and the electrolyte impedance are expected to be the main contribution to the total impedances at 250 Hz, as it can be seen in Fig. 6a, because at this frequency the main component of the impedance is real. Fig. 5 shows that the currents within the p-doped region remain constant and have an abrupt jump to lower admittances, which can be related to lower conductivities when the polymer is completely reduced. Similar observation were reported by Łapkowski and Proń39 using resistance measurements of PEDOT films in a TEABF4 solution in acetonitrile.


image file: c3ra46028b-f6.tif
Fig. 6 Electrochemical impedance spectra of PEDOT (squares) and bare Pt(111) (circles) in [Emmim][NTf2]. Nyquist representation. (a) E = −0.359 V for PEDOT and E = −0.380 V for Pt(111). (b) E = −1.359 V for PEDOT and E = −1.280 V for Pt(111).

It is also evident that the height of the AC current jump decreases in the following order [Emim][NTf2] > [Emmim][NTf2] ≈ [Bmim][OTf] > [Bmmim][NTf2]. Those experimental data show that the PEDOT films in [Emim][NTf2] have higher conductivities than those observed in the other three ILs studied.

In order to gain a better understanding of the above observations, the EIS spectra of the PEDOT films in the different ILs were recorded. Fig. 6a shows the Nyquist representation of the EIS spectrum of p-doped PEDOT films in [Emmim][NTf2]. A similar behaviour was obtained with the other three ILs studied.

In Fig. 6a, it can be observed at very high frequencies a part of a semicircle followed by a rapid increase in the imaginary impedance at lower frequencies. This behaviour is expected in the finite diffusion conditions of a metal/film/solution configuration where the overall redox capacitance of the film is much greater than the interfacial capacitances.3,42

Since the behaviour at frequencies higher than 215 Hz appears to be similar at all potentials (Fig. 6a) these impedances can be related to the PEDOT–electrolyte interface, which is simulated by a parallel C1 and R2 elements. In this sense, the equivalent circuit shown in Scheme 1a was proposed to simulate the EIS spectra of the full-oxidized form of PEDOT. In this circuit R1 corresponds to the IL resistance, C1 and R2 corresponds to the capacitance and the resistance of the interface IL–PEDOT, and CPE is a constant phase element that corresponds mainly to the capacitance of the PEDOT film.


image file: c3ra46028b-s1.tif
Scheme 1 Equivalent circuits used to fit the EIS experimental data of PEDOT at potentials where the polymer is (a) p-doped or (b) non doped.

The values obtained by the fitting of the experimental data using the equivalent circuit of the Scheme 1a are shown in Table 2. A good agreement of the experimental points with the simulated data was obtained as shown by the values of χ2. The huge capacitance of the oxidized form of PEDOT films (related to the value of Y0 in Table 2) makes very difficult to measure the “electronic” and the ionic conductivities of the films. Table 2 shows that the capacitances of the oxidized PEDOT film increase with the size of the imidazolium cation, supporting once again the proposal that both cations and anions are trapped inside the polymer. It can be concluded that the ILs with the bulkiest cations are those in which the PEDOT films have the most open and disordered structure.

Table 2 EIS results of PEDOT in different ILs obtained by fitting experimental data to the equivalent circuits shown in Scheme 1
  [Emim] [NTf2] [Emmim] [NTf2] [Bmmim] [NTf2] [Bmim] [OTf]
 
Oxidized form
E (V vs. Cp2Fe) −0.385 −0.395 −0.286 −0.291
R2 (ohm cm2) 4.5 35.5 88.2 67.7
C1 (nF cm−2) 25.5 3.9 2.6 2.1
CPE Y0 (μS cm−2 sn−1) 459 501 544 539
n 0.96 0.95 0.96 0.97
χ2 × 10⁴ 7.2 8 7.2 7.2
 
Reduced Form
E (V vs. Cp2Fe) −1.302 −1.395 −1.286 −1.291
R2 (ohm cm2) 4.1 37.1 73.2 46.3
R3 (ohm cm2) 4025 8243 6324 8623
R4 (ohm cm2) 20[thin space (1/6-em)]621 26[thin space (1/6-em)]007 59[thin space (1/6-em)]861 47[thin space (1/6-em)]607
C1 (nF cm−2) 36.5 3.4 3.3 3.5
C2 (μF cm−2) 8.3 6.9 8.5 8.8
C3 (μF cm−2) 36.9 29.7 23.9 23.2
χ2 × 10³ 4.9 3.2 4.8 3.1


At potentials where the polymer is reduced, and it is not “doped”, the film impedance increases (Fig. 7). The shape of the EIS spectra (Fig. 6b and 7b) indicates that an isolating film with porosities is formed on the electrode. The data can be simulated by the circuit in Scheme 1b. This equivalent circuit is typical of an insulator coating with failure porosity.43 When the polymer is reduced the sum of R3 + R4 (Table 2) can be related to the total film resistance (ionic and “electronic”) in the direction perpendicular to the electrode. It is clear that [Emim][NTf2] has the lowest resistance, as it was suggested by the AC voltammograms (Fig. 5). On the other hand, the total film capacitance (C2 + C3) is almost the same for all non-doped PEDOT films in all ILs used.


image file: c3ra46028b-f7.tif
Fig. 7 Bode plot of the EIS spectrum of PEDOT in [Emmim][NTf2]. (a) at E = −0.380 V and (b) at E = −1.280 V. Points represent experimental data and solid lines represent the fitted data using the equivalent circuits shown in Scheme 1.

The R2 and C1 values depend only on the properties of ILs. Particularly the values of C1 are very similar to those reported for imidazolium type ILs,44 which suggests that the polymer film surface is very flat. This also implies that the surface area of the clean Pt(111) electrode is almost the same of the surface area of the polymer film/IL interface. A correlation between the viscosity and conductivity of ILs can be made with R2 and C1 values. It can be observed from Tables 1and 2 that the IL with the lowest viscosity and higher conductivity, i.e. [Emim][NTf2], is the one that has the highest value of capacitance C1 and the lowest value of resistance R2. The opposite analysis also applies: [Bmmim][NTf2] has the highest viscosity and the lowest conductivity and it has the lowest value of capacitance and the highest value of R2. This behaviour can be explained taking into account that ILs having high viscosity are more difficult to be polarized and when their conductivity is high the ion transfer within the electric double layer is fast.

On the other hand, the film capacitance has a significant increase with the applied potential in all IL used, as it can be seen in Fig. 8. This figure shows a maximum around −0.3 V, which is the same potential where the peak A2 in the cyclic voltammograms (Fig. 1) and the current maximum in the AC voltammogram at 5 Hz (Fig. 5) are observed.


image file: c3ra46028b-f8.tif
Fig. 8 Capacitance of PEDOT films at different applied potential in (solid squares)[Emim][NTf2], (red circles)[Emmim][NTf2], (solid green triangles)[Bmim][OTf], and (blue solid rombes)[Bmmim][NTf2]. Y0 has units of μS cm−2 sn−1 that turns to μF cm−2 when the value of n is close to 1.

If the data shown in Fig. 8 are compared with those reported for PEDOT films in 0.1 M sodium perchlorate or Bu4NPF6 solutions in acetonitrile26 it is observed that the ratio between the total charge used for the galvanostatic synthesis of PEDOT and the maximum capacitance of the PEDOT film is almost equal (12.5C F−1) for both media. If the current efficiency during the galvanostatic synthesis of the conducting polymer is the same in electrolytes dissolved in acetonitrile and in pure ILs, it can be concluded that the use of ILs does not change significantly the polymer capacitance in comparison with the use of electrolytes in molecular solvents.

In this sense, the high rate of ion exchange during redox switching (Fig. 4) and the high n-doped level (Fig. 3) are the actual advantages of ILs as electrolytes for the construction of electronic devices, electrolytic capacitors or batteries based on conducting polymers.

Conclusions

PEDOT films were synthesized galvanostatically in four different ILs and characterized in the same free-monomer ILs. Cyclic voltammetry and AC voltammetry show the presence of two redox signals, possibly related with two different redox states for PEDOT in ILs. Also, it was observed, by chronoamperometry, that the ion exchange rate upon redox switching of the PEDOT films increases in the order: [Bmmim][NTf2] < [Emmim][NTf2] < [Bmim][OTf] < [Emim][NTf2].

It was found that in [Emim][NTf2] the PEDOT films show the highest n-doping concentration (ratio between C3 and C1 peak) reported until now. It seems that bulky planar imidazolium cations can stabilize much better the negative charges of the n-doped PEDOT. AC voltammetry and EIS showed that the conductivity of PEDOT films in the imidazolium-type ILs studied increases in the following order [Bmmim][NTf2] < [Bmim][OTf] < [Emmim][NTf2] < [Emim][NTf2].

Finally this study shows the advantages of the simultaneous use of ILs and Pt single crystal electrodes to study the electrochemical properties of PEDOT, like experimental reproducibility, the use of a well-defined electrode surface structure, work in a dry medium and that the electrochemical properties of the PEDOT films can be tuned systematically by varying the chemical structure of the IL. These facts indicate a significant improvement of the synthesis procedure not only because of the use of the ionic liquid, which has been proven to produce more flat polymers45 especially when flat cations and anions are used, but also because the use of single crystal electrodes, which can also serve as a template for the organized growing of the polymer.

Acknowledgements

APS is grateful to the National University of Colombia for the scholarship “Estudiantes sobresalientes de posgrado”. MFS acknowledges support of National University of Colombia (Research Project 19030). JMF acknowledges support for Generalitat Valenciana (Feder) through project PROMETEO/2009/045. RMT acknowledges support of FAPESP (Research Project 09/53199-3).

References

  1. E. L. Leguenza, R. L. Patyk, R. M. Q. Mello, L. Micaroni, M. Koehler and I. A. Hümmelgen, J. Solid State Electrochem., 2007, 11, 577 CrossRef CAS PubMed.
  2. Q. D. Ling, D. J. Liaw, C. Zhu, D. S. H. Chan, E. T. Kang and K. G. Neo, Prog. Polym. Sci., 2008, 33, 917 CrossRef CAS PubMed.
  3. G. Inzelt, in Conducting Polymers. A New Era in Electrochemistry, Springer, Heidelberg, 2008 Search PubMed.
  4. V. G. Khomenko, V. Z. Barsukov and A. S. Katashinskii, Electrochim. Acta, 2005, 50, 1675 CrossRef CAS PubMed.
  5. B. Winther-Jensen, O. Winther-Jensen, M. Forsyth and D. R. Macfarlane, Science, 2008, 321, 671 CrossRef CAS PubMed.
  6. N. Oyama, Y. Kiya, O. Hatozaki, S. Morioka and H. D. Abruña, Electrochem. Solid-State Lett., 2003, 6, A286 CrossRef CAS PubMed.
  7. G. Inzelt, J. Solid State Electrochem., 2011, 15, 1711 CrossRef CAS.
  8. P. Lang and J. Clavilier, Synth. Met., 1991, 45, 297 CrossRef CAS.
  9. M. F. Suárez-Herrera and J. M. Feliu, Phys. Chem. Chem. Phys., 2008, 10, 7022 RSC.
  10. M. F. Suárez-Herrera and J. M. Feliu, J. Phys. Chem. B, 2009, 113, 1899 CrossRef PubMed.
  11. J. C. Hidalgo-Acosta, V. Climent, M. F. Suárez-Herrera and J. M. Feliu, Electrochem. Commun., 2011, 13, 1304 CrossRef CAS PubMed.
  12. R. Hayes, G. G. Warr and R. Atkin, Phys. Chem. Chem. Phys., 2010, 12, 1709 RSC.
  13. W. Lu, A. G. Fadeev, B. Qi, E. Smela, B. R. Mattes, J. Ding, G. M. Spinks, J. Mazurkiewicz, D. Zhou, G. G. Wallace, D. R. Macfarlane, S. A. Forsyth and M. Forsyth, Science, 2002, 297, 983 CrossRef CAS PubMed.
  14. D. R. Macfarlane, J. M. Pringle, P. C. Howlett and M. Forsyth, Phys. Chem. Chem. Phys., 2010, 12, 1659 RSC.
  15. J. M. Pringle, J. Efthimiadis, P. C. Howlett, J. Efthimiadis, D. R. Macfarlane, A. B. Chaplin, S. B. Hall, D. L. Officer, G. G. Wallace and M. Forsyth, Polymer, 2004, 45, 1447 CrossRef CAS PubMed.
  16. J. M. Pringle, D. R. Macfarlane and M. Forsyth, Synth. Met., 2005, 155, 684 CrossRef CAS PubMed.
  17. J. M. Pringle, M. Forsyth, D. R. Macfarlane, K. Wagner, S. B. Hall and D. L. Officer, Polymer, 2005, 46, 2047 CrossRef CAS PubMed.
  18. R. Vijayaraghavan, J. M. Pringle and D. R. Macfarlane, Eur. Polym. J., 2008, 44, 1758 CrossRef CAS PubMed.
  19. K. Wagner, J. M. Pringle, S. B. Hall, M. Forsyth, D. R. Macfarlane and D. L. Officer, Synth. Met., 2005, 153, 257 CrossRef CAS PubMed.
  20. P. Damlin, C. Kvarnström and A. Ivaska, J. Electroanal. Chem., 2004, 570, 113 CrossRef CAS PubMed.
  21. P. Bonhôte, A.-P. Dias, N. Papageorgiou, K. Kalyanasundaram and M. Grätzel, Inorg. Chem., 1996, 35, 1168 CrossRef PubMed.
  22. M. Galiński, A. Lewandowski and I. Stepniak, Electrochim. Acta, 2006, 51, 5567 CrossRef PubMed.
  23. C. Korzeniewski, V. Climent and J. M. Feliu, in Electroanalytical Chemistry: A Series of Advances, ed. A. J. Bard and C. G. Zoski, CRC Press, Boca Raton, 2012, vol. 24, pp. 75–166 Search PubMed.
  24. F. F. C. Bazito, Y. Kawano and R. M. Torresi, Electrochim.Acta, 2007, 52, 6427 CrossRef CAS PubMed.
  25. A. S. Bondarenko and G. A. Ragoisha, in Progress in Chemometrics Research, ed. A. L. Pomarentsev, Nova Science Publishers, New York, 2005, pp. 89–102 Search PubMed.
  26. M. F. Suárez-Herrera, M. Costa-Figueiredo and J. M. Feliu, Phys. Chem. Chem. Phys., 2012, 14, 14391 RSC.
  27. G. G. Rodríguez-Calero, M. A. Lowe, Y. Kiya and H. D. Abruña, J. Phys. Chem. C, 2010, 114, 6169 Search PubMed.
  28. H. Randriamahazaka, C. Plesse, D. Teyssié and C. Chevrot, Electrochem. Commun., 2003, 5, 613 CrossRef CAS.
  29. A. R. Hillman, S. J. Daisley and S. Bruckenstein, Electrochim. Acta, 2008, 53, 3763 CrossRef CAS PubMed.
  30. A. M. Bond, S. Fletcher, F. Marken, S. J. Shaw and P. G. Symons, J. Chem. Soc., Faraday Trans., 1996, 92, 3295 Search PubMed.
  31. A. M. Bond, S. Fletcher and P. G. Symons, Analyst, 1998, 123, 1891 RSC.
  32. K. M. Scaboo and J. Q. Chambers, Electrochim. Acta, 1998, 43, 3257 CrossRef CAS.
  33. J. Q. Chambers, K. M. Scaboo and C. D. Evans, J. Electrochem. Soc., 1996, 143, 3039 CrossRef CAS PubMed.
  34. M. F. Suárez, F. Marken, R. C. Compton, A. M. Bond, W. Miao and C. L. Raston, J. Phys. Chem. B, 1999, 103, 5637 CrossRef.
  35. H. Randriamahazaka, C. Plesse, D. Teyssié and C. Chevrot, Electrochem. Commun., 2004, 6, 299 CrossRef CAS PubMed.
  36. T. F. Otero and F. Santos, Electrochim. Acta, 2008, 53, 3166 CrossRef CAS PubMed.
  37. W. Domagala, B. Pilawa and M. Lapkowski, Electrochim. Acta, 2008, 53, 4580 CrossRef CAS PubMed.
  38. A. Zykwinska, W. Domagala and M. Lapkowski, Electrochem. Commun., 2003, 5, 603 CrossRef CAS.
  39. M. Łapkowski and A. Proń, Synth. Met., 2000, 110, 79 CrossRef.
  40. E. Sezer, M. Skompska and J. Heinze, Electrochim. Acta., 2008, 53, 4958 CrossRef CAS PubMed.
  41. A. Ispas, R. Peipmann, A. Bund and I. Efimov, Electrochim. Acta., 2009, 54, 4668 CrossRef CAS PubMed.
  42. M. A. Vorotyntsev, J. P. Badiali and G. Inzelt, J. Electroanal. Chem., 1999, 472, 7 CrossRef CAS.
  43. E. Barsoukov and J. R. Macdonald, in Impedance Spectroscopy Theory, Experiment and Applications, John Wiley and Sons, Inc., New Jersey, 2nd edn, 2005 Search PubMed.
  44. V. Lockett, R. Sedev, J. Ralston, M. Horne and T. Rodopoulos, J. Phys. Chem. C, 2008, 112, 7486 CAS.
  45. D. R. Macfarlane, M. Forsyth, P. C. Howlett, J. M. Pringle, J. Sun, G. Annat, W. Neil and E. I. Izgorodina, Acc. Chem. Res., 2007, 40, 1165 CrossRef CAS PubMed.

This journal is © The Royal Society of Chemistry 2014