Babak Karimi*a,
Saeed Emadi*b,
Ali Asghar Safaria and
Mehraneh Kermaniana
aDepartment of Chemistry, Institute for Advanced Studies in Basic Sciences (IASBS), P. O. Box 45137-6731, Gava Zang, Zanjan, Iran. E-mail: karimi@iasbs.ac.ir; Fax: +98-421-4153232; Tel: +98-421-4153225
bDepartment of Biological Sciences, Institute for Advanced Studies in Basic Sciences (IASBS), P. O. Box 45137-6731, Gava Zang, Zanjan, Iran. E-mail: emadi@iasbs.ac.ir; Fax: +98-241-4153004; Tel: +98-421-4153005
First published on 25th October 2013
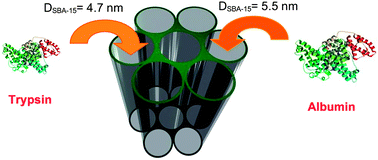
Albumin and trypsin were immobilized in the interior of SBA-15 mesochannels having suitable pore sizes through adsorptive binding. SBA-15's with different pore sizes (47 and 55 Å) were synthesized and the effects of factors such as temperature, pH and ionic strength were investigated on loading efficiency and bioactivity. Maximal loading for albumin (8.3 μmol g−1 SBA-15) and trypsin (23.5 μmol g−1 SBA-15) were achieved after 24 hours mixing at room temperature. Increasing the temperature during mixing increased the albumin loading to 9.9 μmol g−1 SBA-15 at 45 °C after 24 h incubation, while the loading of trypsin was decreased. The N2 adsorption–desorption isotherms of synthesized and immobilized proteins were obtained to ensure that the protein immobilization was occurred inside the channels of the supports. The activity of adsorbed trypsin was measured at different temperatures to investigate its thermal stability. The proteolytic stability of adsorbed trypsin against α-chymotrypsin was also studied. The kinetic constants (Km and Vmax) of the adsorbed trypsin were determined and compared with the soluble enzyme. The results indicated that the adsorbed trypsin retained 42% of its activity after 2 hours incubation at 45 °C and also retained 98 percent of its activity after chymotryptic treatment. This increased thermal and proteolytic stability could compensate the decrease in the affinity (higher Km) of the adsorbed enzyme toward the substrate and its lower maximum velocity.
Although proteins and particularly enzymes possess very high specificity, they are very sensitive to environmental conditions and show very low activity under harsh conditions such as the presence of organic solvents and at high temperatures. Because of these considerations there has been a relatively long tradition of immobilizing enzymes in order to increase their stability and also to increase their potential for recycling and in this way increasing the probability of making use of their specificity and high catalytic rate in industrially favourable products economically.
The immobilization of enzymes onto porous compounds was first undertaken by Diaz and Balkus in 1996,13 during which they tried to immobilize enzymes onto MCM-41. Since then several investigators have identified that immobilization of proteins and enzymes onto regular mesoporous structures depends on many factors such as pore diameter, pore size distribution, ionic strength of the solution during the enzyme immobilization process, surface characteristics of the enzyme and support, to name only a few.14 Therefore in order to find an optimum protein-immobilized system, the factors influencing the immobilization methodology must be examined systematically with respect to a specific mesoporous structure and also the specific enzyme that is going to be immobilized. In this way, the positive synergism between the protein surface and the mesoporous support should be resolved, whilst mostly retaining its original catalytic activity, and high loading with minimized leaching during repetitive applications are the prime issues. In recent years, we have been very interested in designing different kinds of heterogeneous catalysts based on the use of varied OMSs as supports.15 Inspired by our successful experiences in this area, in the present study two kinds of ordered mesoporous silica SBA-15 having different pore openings were chosen to be employed for the immobilization of albumin and trypsin, by emphasizing the possibility to obtain the highest plausible loading through different preparation conditions (i.e., mixing time, pH, ionic strength, and temperature). In particular, we have tried to find a correlation between pore size of SBA-15 and the amount of the immobilized protein.
Although previous studies on the immobilization of albumin16–20 and trypsin13,21–24 onto mesoporous silicates have provided a number of reaction conditions for achieving improved immobilization, they are still far from being considered as optimized, particularly with respect to their loadings. Here we report one of the highest loadings ever achieved for these two proteins into nanostructured mesoporous SBA-15.
Nitrogen gas adsorption–desorption isotherm analysis were made by the use of a BellSorb II system at 77 K. The Brunauer–Emmett–Teller (BET) method was used for the estimation of surface area and the pore size data were obtained through the Barret–Joyner–Halenda (BJH) method. Transmission electron micrographs were obtained through the use of a Phillips CM200 electron microscope.
824 M−1 cm−1 (ref. 25) and εmolar = 14
300 M−1 cm−1) for bovine serum albumin and bovine pancreatic trypsin, respectively.26 The initial stock solutions of proteins were prepared in 0.1 M phosphate buffer, pH 8.0. The concentrations of proteins in their initial stock solutions were 1.5 μmol mL−1 (100 mg mL−1) for albumin and 1.0 μmol mL−1 (23.4 mg mL−1) for trypsin. The mesoporous support was prepared in the same buffer as the enzymes stock solutions (0.1 M phosphate buffer, pH 8.0) and was mixed for 15 minutes on a magnetic stirrer. In order to adsorb the proteins onto mesoporous supports, equivalent volumes of the support solution and protein solutions were mixed together in such a way that the final concentrations of proteins and the support were the same (1 mg mL−1). The amount of loaded protein at any particular time was calculated by centrifugation of reaction mixtures inside the vessels at 6000 rpm for 30 minutes in a Heareus Microfuge, and then measuring the protein concentration of the supernatant and subtracting it from the initial concentrations. The samples were mixed through the use of an Eppendorph Thermomixer, at controlled temperatures and for a defined duration. To adjust the NaCl concentrations, the only difference in the preparation of the experimental mixtures was that different amounts of NaCl were added to the mixtures containing SBA-15 and protein. The volumes of the mixtures were then adjusted to 2 mL by the addition of buffer.
In order to investigate the proteolytic stability of the adsorbed trypsin, 50 μL of α-chymotrypsin solution (60 μM) was added to the adsorbed trypsin suspensions and after adjusting the volume to 2 mL by the addition of buffer and mixing, the mixtures were incubated for 10 minutes at room temperature and the absorptions of the supernatants were measured at 280 nm. The enzyme activity of the adsorbed trypsin after chymotrypsin digestion treatment was measured as mentioned above at 405 nm. In order to become sure that the α-chymotrypsin was active during chymotryptic treatments, its activity was measured with the use of a standard procedure before treatments.28
To determine the enzyme kinetic parameters, we determined the initial velocities of adsorbed and soluble enzyme samples at different substrate concentrations. The enzyme concentration was 1.0 μmol mL−1 (23.4 mg mL−1) in both adsorbed and immobilized enzyme samples. The Michaelis constant (Km) and maximum velocity (Vmax) was determined from the hyperbolic curve with the use of freely available software Igor Pro 4.01 (Wavemetrics Inc.).
It is well documented that there is a strong relationship between the pore size of the pristine mesoporous materials and the stability, activity, and the loading of the immobilized protein.
To evaluate the structure and textural properties of materials, transmission electron microscopy (TEM) and surface analysis were performed. TEM images of solvent-extracted materials along the channels clearly demonstrated the existence of two dimensional hexagonal symmetry throughout both samples (Fig. 1).
![]() | ||
| Fig. 1 TEM images of the longitudinal section of SBA-15 with pore diameters of 4.7 nm (upper) and 7.7 nm (lower), across the ordered mesoporous channels. | ||
N2 adsorption–desorption analysis provided additional insight into the textural properties of the materials (Fig. 2).
The pristine solvent-extracted samples showed typical type IV N2-sorption isotherms with steep H1 hysteresis loops at relative pressures somewhere between 0.6 and 0.8 for SBA-15-1 shifted to higher pressure 0.7–0.9 for SBA-15-2, which is indicative of the pore size enlargement in the latter. For SBA-15-1 and SBA-15-2, the BET surface areas were 698, 667 m2 g−1, BJH average pore diameters were 4.7, 5.5 nm, and volumes were 0.86, 0.88 cm3 g−1, respectively (Table 1).
| Sample | D (nm) | SBET (m2 g−1) | Total pore volume (cm3 g−1) |
|---|---|---|---|
| SBA-15-1 | 4.7 | 698 | 0.86 |
| SBA-15-2 | 5.5 | 667 | 0.88 |
| Trypsin@SBA-15-1 | — | 140 | 0.34 |
| Albumin@SBA-15-2 | — | 266 | 0.56 |
Considering the size of trypsin (4.9 × 3.9 × 3.3 nm3)29 and albumin (4.0 × 4.0 × 14.0 nm3),30 it was expected that SBA-15-1 would be better suited as the host for trypsin, whereas the pore size of SBA-15-2 would better match with the hydrodynamic diameter of albumin.
Because of this it is not usually possible to extrapolate the effects of one surface on a particular compound to another compound and this necessitates additional specific experiments.
As it was mentioned before the molecular size of albumin (4.0 × 4.0 × 14.0 nm3) made it essential to synthesize a support with larger pore size, i.e., 5.5 nm. Table 2 shows the effect of different mixing times at two different temperatures for immobilization of albumin. As can be clearly seen the amount of loaded albumin onto SBA-15-2 has a direct relationship with the duration of mixing at both temperatures.
| # | Mixing time (h) | Amount albumin adsorbed/g SBA-15 | |||
|---|---|---|---|---|---|
| Room temperature | 45 °C | ||||
| mg | μmol | mg | μmol | ||
| 1 | 2 | 465 ± 6.1 | 7.00 ± 0.10 | 520 ± 3.0 | 7.90 ± 0.05 |
| 2 | 4 | 495 ± 3.3 | 7.50 ± 0.05 | 547 ± 5.5 | 8.30 ± 0.08 |
| 3 | 8 | 499 ± 5.0 | 7.50 ± 0.07 | 556 ± 2.0 | 8.40 ± 0.03 |
| 4 | 12 | 484 ± 4.5 | 7.30 ± 0.07 | 596 ± 1.4 | 9.00 ± 0.02 |
| 5 | 24 | 545 ± 5.0 | 8.30 ± 0.08 | 651 ± 2.3 | 9.90 ± 0.03 |
The next factor that was examined was pH. The results of this study are summarized in Table 3. The isoelectric point (pI) of albumin is 4.7 and that of SBA-15 is about 3.7. At pH 4.0, which is above the pI of SBA-15, its surface charge is dominantly negative, and since the surface charge of albumin is dominantly positive (the pH is below its pI) the two surfaces are expected to interact electrostatically. At pH 4.5 the charge of the support is negative but the amount of positive charges on the surface of albumin decreases significantly. Therefore, as can be clearly seen, the amount of loaded albumin was decreased from 7.5 to 7.3 μmol g−1 at this pH, since the electrostatic interaction had been considerably sacrificed.
| # | pH | Amount albumin adsorbed/g SBA-15 | |
|---|---|---|---|
| mg | μmol | ||
| 1 | 4.0 | 495 ± 3.2 | 7.50 ± 0.05 |
| 2 | 4.5 | 481 ± 2.5 | 7.30 ± 0.04 |
| 3 | 5.0 | 399 ± 5.0 | 6.00 ± 0.08 |
| 4 | 6.0 | 461 ± 3.5 | 7.00 ± 0.05 |
| 5 | 7.2 | 462 ± 3.9 | 7.00 ± 0.06 |
| 6 | 8.0 | 545 ± 5.0 | 8.30 ± 0.08 |
The latter discussion also holds for the result of loading at pH 5.0 and the amount of loading is decreased further. Although, this mode can be satisfactorily employed to explain the decreasing in albumin immobilization by increasing the pH, it seems that the other scenario should be taken into account for the adsorption behaviour of albumin at higher pH values. In this regard, it was found that while the amounts of loaded albumin at pH's 6.0 and 7.2 were almost the same, the values were to the same extent higher than that observed at pH 5.0 (Table 3, entries 3–5).
The increase in loading was also seen at pH 8.0 (to 8.3 μmol g−1 SBA-15). According to the discussion that was put forward about the electrostatic interactions between the support and albumin molecules it is anticipated that the trend in decreasing the amount of loading should have been continued at pH's higher than 5.0. But this was not observed and instead the loading was increased. This increase in loading could not be explained solely with the electrostatic interactions between the support and albumin molecules although it might possibly have an electrostatic nature namely the effects of the different buffers that had been used for the establishment of pH's 4.0 to 5.0 (acetate buffer) and pH's 6.0 to 8.0 (phosphate buffer).
Recently, Katiyar et al.31 reported the effect of initial concentration of Bovine serum albumin (BSA, at 20, 50, and 80 mg mL−1) on its loading onto SBA-15 at pH 4.8, which is almost equal to the pI of BSA (i.e., 4.7). The loading they reported for the lowest initial concentration of BSA (20 mg mL−1) was 224 mg g−1 which was less than ours (6.0 μmol g−1 SBA-15 or 399 mg g−1 SBA-15).
Ionic strength was the last environmental factor whose effect was studied through including different concentrations of NaCl in the reaction mixture during the preparation of adsorbed albumin. As it can be seen in Table 4, upon increasing the salt concentration from 0 to 1.5 M, the amount of adsorbed albumin was decreased continuously from 545 to 223 mg g−1 SBA-15. The pH of the reaction mixture during preparation of the adsorbed albumin was 8.0 and, as it was noted before, at this pH the surface charge of albumin is negative and it could be postulated that by increasing the concentration of salt, the albumin molecules could have preferred to interact with the counter ions provided by the salt ions (i.e., Na+ ions) and hence their affinity to exit from the solution phase and enter the pores of the support was decreased continuously.
| # | NaCl Conc. (M) | Amount albumin adsorbed/g SBA-15 | |
|---|---|---|---|
| mg | μmol | ||
| 1 | 0 | 545 ± 5.0 | 8.30 ± 0.08 |
| 2 | 0.5 | 346 ± 3.5 | 5.20 ± 0.05 |
| 3 | 1 | 311 ± 4.0 | 4.70 ± 0.06 |
| 4 | 1.5 | 223 ± 4.5 | 3.40 ± 0.07 |
In order to see if the immobilized albumin had entered inside the channels of SBA-15 the N2 adsorption–desorption isotherms of the SBA-15 before and after adsorption of albumin were compared. The result can be seen in Fig. 3. It was found that after immobilization of albumin onto SBA-15, the surface area and pore volume showed a significant decrease, suggesting that the protein molecules were most likely introduced into the interior of SBA-15 mesopores. In particular, the nitrogen gas uptake decreased as the protein loading was increased to reach the minimum amount of 50% of its original value observed for the pristine SBA-15-2. Interestingly, the capillary condensation step was even observed for SBA-15-2/albumin having considerable amounts of albumin (8.3 μmol g−1), which provides clear evidence for the preservation of open-up mesoporous structure, a feature that would be very promising for the subsequent stability and biological activity studies.
The amount of leaching of the adsorbed albumin was also examined at two situations: without mixing and after mixing. The adsorbed albumin was incubated in the phosphate buffered solution (pH 8.0) for different durations (2, 8, 16, 24 and 48 hours) at room temperature and after which the absorption of the supernatant at 280 nm was examined. There was almost no absorption after the termination of all incubation times in the supernatant solution which showed almost no leaching of the adsorbed albumin. The same result was also obtained when the adsorbed albumin was mixed during the same incubation times and at room temperature. These results showed that the adsorbed albumin had considerable stability and leaching was minimal under the operated conditions.
The absence of leaching also highlights the notion that the large mesochannels in SBA-15-2 (5.5 nm) can provide enough space to accommodate albumin and still have appropriate surface properties for strong interaction with the protein surface under the described conditions.
Table 5 shows the effect of mixing duration at two different temperatures (room temperature and 45 °C) on the loading of trypsin. As it is clear, at room temperature the amount of loading increased upon increasing the mixing period from 2 to 24 hours. But this was not the case for 45 °C, where up to 4 hours mixing time, the loading of the enzyme increased and after that the loading was gradually decreased. It seems that incubating the enzyme during mixing for more than 4 hours at 45 °C had caused considerable structural changes in the trypsin such that its affinity to the support, and consequently its adsorption to the support, has decreased continuously.
| # | Mixing time (h) | Amount trypsin adsorbed per g SBA-15 | |||
|---|---|---|---|---|---|
| Room temperature | 45 °C | ||||
| mg | μmol | mg | μmol | ||
| 1 | 2 | 238 ± 5.1 | 10.00 ± 0.21 | 238 ± 5.0 | 10.00 ± 0.21 |
| 2 | 4 | 335 ± 4.3 | 14.10 ± 0.18 | 338 ± 5.1 | 14.20 ± 0.21 |
| 3 | 8 | 383 ± 5.0 | 16.10 ± 0.21 | 270 ± 4.2 | 11.30 ± 0.18 |
| 4 | 12 | 514 ± 4.5 | 21.60 ± 0.19 | 190 ± 3.4 | 8.00 ± 0.14 |
| 5 | 24 | 559 ± 4.8 | 23.50 ± 0.20 | 184 ± 4.3 | 7.70 ± 0.18 |
N2 adsorption–desorption isotherms for the adsorbed trypsin samples on SBA-15-1 were also measured and are shown in Fig. 4. The decrease in volume of the pores that was occurred in the support containing the enzyme in comparison with pristine SBA-15-1 is reminiscent of filling of the pores with the enzyme molecules. Also the structural order as well as open-up mesopores of the support are clearly preserved. Comparing Fig. 3 and 4 clarifies that the penetration of trypsin molecules inside the pores of SBA-15-1 had been much more prominent than that of albumin molecules into the pores of SBA-15-2. The reason for the higher penetration and retention of trypsin molecules inside the pores seems to be because of the smaller difference that existed between the diameter of trypsin (3.9 nm) and the pore sizes of SBA-15-1 (4.7 nm), that is 0.8 nm (hence tighter environment and more retention), compared with that of albumin with SBA-15-2 (5.5–4.0 = 1.5 nm).
Since the enzymatic activity of trypsin in the adsorbed form is of prime importance, we next proceeded to compare its activity in the solution (free enzyme) and adsorbed forms. Fig. 5 shows the remaining activity of the adsorbed trypsin after the termination of the mixing times at room temperature.
![]() | ||
| Fig. 5 Activity of the immobilized trypsin on SBA-15-1 after different mixing times at room temperature in comparison with the free enzyme. | ||
Enzyme samples mixed for different periods at 45 °C (Table 6) were only minimally active (only 9% activity) after 2 hours mixing. Longer duration of mixing at 45 °C resulted in complete deactivation. It is worth mentioning that free enzyme kept for 2 hours at 45 °C lost its activity completely.
We also determined the kinetic parameters (Km and Vmax) of the adsorbed and soluble trypsin. Fig. 6 shows the Michaelis–Menten plot of the two trypsin preparations (adsorbed and soluble). As it can be seen in the plot the constants are as follows: for the soluble trypsin we obtained Km = 0.145 mM and Vmax = 0.0034 mM min−1, and for the adsorbed trypsin the kinetic constants were: Km = 0.162 mM and Vmax = 0.0024 mM min−1. The increase in the Km of the adsorbed trypsin shows that the affinity for the substrate is decreased, and as the values of the maximum velocities show, Vmax of the adsorbed trypsin has also been decreased. But decreases in the affinity and maximum velocity after adsorption of trypsin could be compensated if the stability increases upon adsorption, and according to our data presented here (Tables 5 and 6) this was accomplished.
![]() | ||
| Fig. 6 Michaelis–Menten plot of the adsorbed (triangles) and soluble (circles) trypsin. The values of Km and Vmax are indicated beside each respective plot. | ||
Examination of high temperature (45 °C) during the preparation of the adsorbed enzyme showed that even after the shortest mixing time (i.e., 2 hours), 90% of its activity was lost. On the other hand adsorbed enzyme, prepared at room temperature (2 hours mixing) retained 60% of its activity (Fig. 5).
This observation showed that although preparing the adsorbed enzyme by mixing at 45 °C for 2 and 4 hours resulted in almost equal loading of trypsin compared to mixing at room temperature (Table 5), its enzymatic activity was lost considerably. It can also be observed from the data embodied in Table 5 that even loading for periods longer than 4 hours at 45 °C decreased in comparison with the corresponding samples that were prepared at room temperature. These observations showed that even if different preparation conditions could result in better loadings of trypsin (which was not the case for the preparation of adsorbed enzyme at 45 °C) its enzymatic activity could easily be lost if prepared at conditions far from optimum enzymatic activity.
Since our prime purpose in this study was to examine enzymatic activity together with obtaining maximal loading, we decided not to examine further the effects of different pH's and ionic strengths during the preparation of adsorbed trypsin.
In order to investigate about the stability of the adsorbed enzyme, we examined the activity of the immobilized enzyme (prepared at room temperature) at high temperatures, and in separate experiments, in the presence of proteolytic enzyme α-chymotrypsin, and compared the results with those of the soluble enzyme. Thermal denaturation of soluble enzymes occurs at different temperatures. One of the main reasons for enzyme immobilization is to increase their stability at temperatures in which they become denatured in the soluble form. Our solubilised trypsin preparation completely lost its activity after its incubation for 2 hours at 45 °C, whereas our immobilized trypsin showed considerable thermal stability at that temperature, as it is shown in Table 6. Although the amount of loading of trypsin at room temperature showed a direct relationship to the mixing time and increased steadily from 2 to 24 hours (Table 5), activity showed a reverse relationship and decreased when the mixing times increased (excluding the 12 hours mixing time adsorbed enzyme sample that at present we do not have an explanation for and need to perform further experimentation). The 2 hours mixing time adsorbed sample showed the highest enzymatic activity after 2 hours incubation at 45 °C (42 percent of the initial enzyme activity relative to that incubated at room temperature still remained) (Table 6). Since the activity remained after 2 hours incubation at 45 °C and in the adsorbed enzyme prepared by mixing for 24 hours (amount loaded: 559 mg g−1 SBA-15) the activity was only 9% compared to that of one mixed for 2 hours (amount loaded: 238 mg g−1 SBA-15 and 42% remaining activity), it can be seen that by increasing the mixing time the loading increases by 2× whereas the activity decreases by 5×.
We also examined the proteolytic stability of the immobilized trypsin. Actually we wanted to know if the immobilized enzyme was protected toward proteolytic activity in its environment or not and to what extent. If the enzyme had penetrated fully inside the pores, as it was our purpose from the beginning, the proteolytic enzyme, here α-chymotrypsin, would not have access to the immobilized trypsin. Table 7 shows the results. The first column shows different samples of immobilized trypsin (for example 2 h mixing is formed through 2 hours mixing of trypsin in the presence of SBA-15-1 at room temperature). Entry 1 shows the absorption of chymotrypsin itself without any immobilized trypsin. After different trypsin preparations were incubated with α-chymotrypsin for 40 minutes, the absorptions at 280 nm were measured. It can be said that by increasing the mixing time the amount of available enzyme (outside the SBA-15 channels) was decreased because the absorptions were decreased from 0.168 to 0.150. So by increasing the mixing time from 2 hours to 16 hours the penetration of the trypsin molecules inside the channels was increased and hence more protection from proteolysis by α-chymotrypsin can be attained. Almost the same trend can be seen in the catalytic activity as the 16 hours trypsin sample showed almost complete protection against proteolysis. The 24 hours mixing sample showed greater proteolysis (A280 = 0.336) and the catalytic activity decreased from 98% to 75%. Our interpretation is that in this sample a higher fraction of the immobilized enzymes were adsorbed outside the channels and hence there were more exposed for proteolysis.
| # | Sample | A280a | A405b | A405c | Activity (%)d |
|---|---|---|---|---|---|
| a Absorption of the supernatant at 280 nm after incubation of immobilized trypsin with α-chymotrypsin.b Absorption of the reaction mixture at 405 nm after incubation of immobilized trypsin with α-chymotrypsin that shows the catalytic activity of immobilized trypsin.c Absorption of the reaction mixture at 405 nm before incubation of immobilized trypsin with α-chymotrypsin that shows the catalytic activity of immobilized trypsin.d Activity (%) = [A405/A405] × 100. | |||||
| 1 | α-chymotrypsin | 0.148 ± 0.005 | — | — | — |
| 2 | 2 h mixing | 0.168 ± 0.004 | 0.304 ± 0.004 | 0.448 ± 0.006 | 68 |
| 3 | 4 h mixing | 0.154 ± 0.005 | 0.140 ± 0.005 | 0.172 ± 0.005 | 82 |
| 4 | 8 h mixing | 0.157 ± 0.004 | 0.196 ± 0.003 | 0.244 ± 0.004 | 80 |
| 5 | 16 h mixing | 0.150 ± 0.005 | 0.111 ± 0.003 | 0.113 ± 0.003 | 98 |
| 6 | 24 h mixing | 0.336 ± 0.003 | 0.080 ± 0.004 | 0.106 ± 0.003 | 75 |
Another factor which is very important in the practical uses of immobilized enzymes is to what extent they will be leached out after repetitive usages. In order to investigate the leaching, we incubated the immobilized enzyme at room temperature, without mixing for 24 hours and we detected no protein absorption in the supernatant. After 24 hours incubation at the same conditions, but this time with mixing, the measurement of protein absorption in the supernatant showed only 8% loss in the amount of immobilized enzyme.
Further studies on the application of other mesoporous structures including functionalized mesoporous materials and periodic mesoporous organosilicas (PMOs) for the immobilization of proteins are currently underway in our laboratories.
| This journal is © The Royal Society of Chemistry 2014 |