Carbon-induced Ru nanorod formation

Payam Kaghazchi *
Institute for Electrochemistry, Ulm University, Albert-Einstein-Allee 47, D-89069 Ulm, Germany. E-mail: payam.kaghazchi@uni-ulm.de

Received 21st October 2013 , Accepted 18th November 2013

First published on 20th November 2013


Abstract

Using DFT calculations we study morphology of C-covered Ru nanostructures. We find that the equilibrium shape of clean Ru nanoparticles is a polyhedron consisting mainly of {0001}, {10[1 with combining macron]0}, and {10[1 with combining macron]1} faces. At low and intermediate coverages of C the shape does not deviate much from that of clean nanoparticles. However, at higher coverages the particle's morphology transforms from the polyhedron to a rod-like shape, which mainly consists of {10[1 with combining macron]0} faces. The formation of nanorods is due to a high stability of Ru(10[1 with combining macron]0), which is induced by the formation of chains of C atoms on this surface. We find that under conditions of Fischer–Tropsch synthesis, in which C forms from the hydrogenation of CO, the rod-like Ru nanoparticle is the most favorable shape.
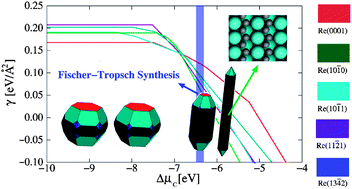

Industrial catalysts are often in nanoparticle (NP) form. Reactivity and selectivity of the catalysts depend strongly on size and shape of the NPs. The shape of freshly prepared and operating NPs are expected to be different. This is because the interaction between dissociated reactants and fresh NPs under high temperatures and reactant pressures (i.e. industrial reaction conditions) can destabilize the surfaces of NPs in favor of formation of other surfaces.1,2 This leads to a dramatic change in the shape of NPs. Consequently the activity of the operating NPs depends on the structure of stabilized surfaces.

Ruthenium is the most active metal catalyst for Fischer–Tropsch (FT) reactions,3 which are part of gas-to-liquid technology. In FT process, hydrogen and carbon monoxide react over a catalyst to form hydrocarbons. This is used to convert traditional fuel sources such as natural gas and coal into synthetic fuels such as methanol and gasoline.3–5 Among the proposed FT synthesis mechanisms, the carbide mechanism is the most accepted one. In this mechanism, FT synthesis begins with the dissociation of CO followed by hydrogenation of the chemisorbed C. It is therefore of interest to study the interaction of C with the Ru surfaces as a key step in understanding the FT synthesis.

There are only a few studies on adsorption of C over Ru surfaces. To our knowledge, only C/Ru(0001)6 and C/Ru(11[2 with combining macron]1)7 have been investigated. In these studies, the preferred adsorption site and binding energy of C have been determined using density functional theory (DFT) calculations.

In the aforementioned studies only a low coverage of C on the Ru(0001) and Ru(11[2 with combining macron]1) surfaces have been considered. In this work, by combining DFT and thermodynamic considerations we study the adsorption of different coverages of C on Ru(0001), (10[1 with combining macron]0), (10[1 with combining macron]1), (11[2 with combining macron]1), and (13[4 with combining macron]2) surfaces and determine the shape of C/Ru NPs. We find that at low and intermediate coverages C adsorption has a minor influence on the particle shape, which is polyhedron consisting mainly of (0001), (10[1 with combining macron]0), and (10[1 with combining macron]1) faces. At very high coverages of C, particles are nonorods consisting mainly of (10[1 with combining macron]0) faces.

The equilibrium shape of C/Ru NPs can be determined by Wulff's theorem.8 This theorem states that large particles (usually >3–5 nm) of a given volume in which the overall formation energy is dominated by surface contributions are bound with surfaces resulting in minimum total free energy:

 
image file: c3ra45985c-t1.tif(1)
where γi and Ai are the surface free energy and the area of the ith face, respectively, T is the temperature and pgas the partial pressure of the surrounding gas.

To calculate the surface free energies we use an ab initio atomistic thermodynamics approach,9–12 which allows for the calculation of the stability of surfaces in contact with surrounding gas atmospheres (reservoirs) using ab initio methods. The most stable structure of Ru surfaces in thermodynamic equilibrium with gas atmospheres is the one that has the lowest surface free energy:

 
image file: c3ra45985c-t2.tif(2)

Here, A and Gsurf are the surface area and Gibbs free energy of the slab, respectively. T is the temperature. μi and pi are the chemical potential and partial pressure of the ith species in the reservoir, respectively. Ni is the number of atoms of the ith species in the system.

To study the structure of Ru NPs in temperature and pressure conditions under which FT processes occur, we assume that each adsorbed C on Ru comes from the reaction between carbon monoxide and hydrogen:13

 
CO + H2 ⇔ H2O + C.(3)

We consider the constrained equilibrium approach14,15 in which a surface is assumed to be in thermodynamic equilibrium with non-interacting gas phase reservoirs. The chemical potential of CO, H2, and H2O can then be described by the ideal gas law, which then enables us to relate μC to specific temperatures and pressures:

 
image file: c3ra45985c-t3.tif(4)

Here, [small mu, Greek, macron]CO, [small mu, Greek, macron]H2, and [small mu, Greek, macron]H2O are the standard chemical potentials at temperature T, which includes all the contributions from vibrations and rotations of the molecules, and the ideal gas entropy at 1 atm. EtotCO, image file: c3ra45985c-t4.tif, and image file: c3ra45985c-t5.tif are the calculated total energies of the isolated molecules. The standard chemical potentials were obtained from the JANAF thermodynamic tables.16 The total energies required for eqn (2) and (4) were calculated using DFT.17

To construct Ru NPs we consider low-index Ru(0001), (10[1 with combining macron]0), (10[1 with combining macron]1), and (11[2 with combining macron]1) as well as high-index Ru(13[4 with combining macron]2) surface that was found to be a stable surface in contact with an nitrogen atmosphere.18

The calculated surface free energies for the clean surfaces (see Fig. 1) are listed in Table 1. Our calculations suggest the following order of stability from the most to least stable: γ0001 < γ10[1 with combining macron]0 < γ10[1 with combining macron]1 < γ13[4 with combining macron]2 < γ11[2 with combining macron]1. Although (13[4 with combining macron]2) is the most open surface among the considered surfaces and is expected to be the least stable (i.e. highest surface free energy), its stability is comparable to that of (11[2 with combining macron]1). This is because (13[4 with combining macron]2) can be viewed as a vicinal (01[1 with combining macron]1) surface with kinked steps and (01[1 with combining macron]1) terraces that are more close-packed than (11[2 with combining macron]1).19


image file: c3ra45985c-f1.tif
Fig. 1 Top views of Ru surfaces, showing binding sites at which C adsorption has been studied. The (1 × 1) surface unit cells are presented in red.
Table 1 Surface free energies (in meV Å−2) for Ru surfaces obtained using the PBE functional
Surface (0001) (10[1 with combining macron]0) (10[1 with combining macron]1) (11[2 with combining macron]1) (13[4 with combining macron]2)
γ 167 186 187 208 202


Afterwards, we studied the adsorption of atomic carbon on Ru surfaces by examining carbon adsorption at the surface sites presented in Fig. 1. Although formation of graphene and subsurface adsorption of carbon have been reported in experimental studies of ethylene adsorption on Ru(0001),20 we have not studied these structures in this work because of the following reasons: (i) the C/R(0001) surfaces with high coverage of carbon are much less stable than other C/Ru surfaces and therefore they can not affect the structure of C/Ru nanoparticles. (ii) Previous DFT calculations on C/Ru(0001) show that the subsurface structures are less favorable than surface adsorption.13

The most stable structures for different surfaces and coverages are presented in Fig. 2. We used geometrical coverages Θ given in GML, which are defined as the number of C adsorbates per (1 × 1)-unit cell of the substrate. As can be seen in Fig. 2C prefers binding at highest possible coordinated sites. This result is in line with previous studies for C/Ni,21 C/Fe,22 and C/Ir23 surfaces. For the lowest coverages considered for Ru surfaces, the threefold hollow hcp sites on (0001), the four-fold hollow sites on (10[1 with combining macron]0), (11[2 with combining macron]1), and Ru(13[4 with combining macron]2), and the five-fold hollow sites on (10[1 with combining macron]1) are the most stable adsorption sites.


image file: c3ra45985c-f2.tif
Fig. 2 Top views of the most stable structures for different coverages of C on Ru surfaces.

For higher coverages, the further adatoms bind at unoccupied high-coordinated sites on the Ru surfaces. Fig. 2 indicates that at high coverages, C atoms tend to be close to each other. On the (10[1 with combining macron]0) surface, we find a chain of C atoms. The formation of C chains is only possible on this surface. Similar behavior has been reported for C adsorption on Ni(111).24

The calculated binding energies versus coverage (in the unit of atom per m2) are illustrated in Fig. 3. The bond strength of C on Ru(0001) is the weakest for most of the coverages. Although the binding energy of C on Ru(10[1 with combining macron]1) is the highest at low coverages, it decreases significantly with coverage, showing strong repulsive C–C interactions. The weakest C–C interactions are for (10[1 with combining macron]0) and (11[2 with combining macron]1). The binding energy of C on the former surface does not change much even at the high coverage of 2 GML, where the chain of C atoms form on the surface (see Fig. 2).


image file: c3ra45985c-f3.tif
Fig. 3 Binding energy (referenced to C atom) as a function of carbon coverage on Ru surfaces.

The total energies obtained for the most favorable structures of the clean as well as C-covered Ru surfaces have then been used to construct the surface free energy plot presented in Fig. 4. Here, using eqn (2) we plot the stabilities versus ΔμC = μcEtotC, where EtotC is the total energy of an isolated C atom. Only those phases (lines) are shown which are most stable (lowest lying) in their particular chemical potential range. We have not considered Ru-carbide in our study since there is experimental evidence that a stable Ru-carbide cannot be obtained directly from the Ru and C elements.25


image file: c3ra45985c-f4.tif
Fig. 4 C/Ru phase diagram showing the surface stability γ as function of the chemical potential of carbon ΔμC = μcEtotC (see eqn (2)). Equilibrium shapes of Ru particles as function of carbon chemical potential, ΔμC (eV), are presented below the phase diagram.

Fig. 4 shows that for ΔμC lower than −8.35 eV no C atom adsorbs on the Ru surface. Above ΔμC = −8.35 eV, adsorption of C occurs first on (10[1 with combining macron]1). This result is due to the stronger binding energy of C with this surface compared to other Ru surfaces (see Fig. 3).

By increasing ΔμC, C starts to adsorb on other surfaces. Although the (0001) surface is the most stable before adsorption of C, it becomes much less stable than other Ru surfaces at high ΔμC. This is because the C–Ru interactions on this surface are weaker compared to those on other surfaces, which can be clearly seen in Fig. 3. Finally, at very high values of ΔμC ≥ −6.8 eV the (10[1 with combining macron]0) surface becomes the most stable.

The equilibrium shape of Ru nanoparticles at selected values of ΔμC are presented in Fig. 4. We find that at low values of ΔμC, where no C adsorbs on the surface, shape of Ru NPs is a polyhedron in which the {0001}, {10[1 with combining macron]0}, and {10[1 with combining macron]1} faces have the highest contribution to the NPs. This is because that these surfaces are more stable than high-index (11[2 with combining macron]1) and (13[4 with combining macron]2) surfaces (see Table 1). By increasing ΔμC above −8.35 eV adsorption of C occurs on Ru(10[1 with combining macron]1). Thus contribution of (10[1 with combining macron]1) faces is larger at ΔμC = −8.0 eV than ΔμC ≤ −8.35 eV. Above ΔμC = −6.8 eV, where the (10[1 with combining macron]0) surface covered with a chain of C atoms becomes the most stable surface among considered surfaces, the NP shape starts to change. By increasing ΔμC, {0001} and {10[1 with combining macron]1} faces shrink while {10[1 with combining macron]0} faces enlarge, leading finally to the formation of rod-like shape above ΔμC = −6.5 eV.

To find the structure of Ru NPs under industrial conditions for the FT processes we calculate ΔμC (see eqn (4)) for T ∼ 500 K, pCO + pH2 + pH2O = ptot ∼ 20–30 atm, pH2/pCO ∼ 2, and pH2O/pH2 < 1.5.26–28 The calculated range of the carbon chemical potential satisfying these conditions is −6.3 eV ≤ ΔμC ≤ −6.5 eV for 0.1 < pH2O/pH2. Fig. 4 indicates that rod-like NPs become thermodynamically stable under these conditions.

In summary, we used DFT-based thermodynamics to study the equilibrium shape of C-covered Ru particles. We showed that a low coverage of C does not change much the shape of Ru NP, which is a polyhedron. However, at high coverages of C, the rod-like shape, which mainly consists of {10[1 with combining macron]0} faces, is the most stable. This is due to the weak C–C interactions on (10[1 with combining macron]0) surfaces, where a chain of C atoms form. Our study suggests that under industrial FT processes and/or with high concentration of C impurities the structure of Ru catalysts can be strongly influenced.

Acknowledgements

The author gratefully acknowledges Prof. Timo Jacob for his valuable comments and the bw-grid for computing resources.29

References

  1. G. A. Somorjai, J. Mol. Catal. A: Chem., 1996, 107, 39 CrossRef CAS.
  2. P. Kaghazchi and T. Jacob, Phys. Rev. B: Condens. Matter Mater. Phys., 2012, 86, 085434 CrossRef.
  3. A. Y. Khodakov, W. Chu and P. Fongarland, Chem. Rev., 2007, 107, 1692 CrossRef CAS PubMed.
  4. M. E. Dry, Catal. Today, 2002, 71, 227 CrossRef CAS.
  5. A. Steynberg and M. Dry, Fischer-Tropsch Technology, Stud. Surf. Sci. Catal., 2004, 152, 406–481 CrossRef.
  6. T. K. Shimizu, A. Mugarza, J. I. Cerda, M. Heyde, Y. Qi, U. D. Schwarz, D. F. Ogletree and M. Salmeron, J. Phys. Chem. C, 2008, 112, 7445–7454 CAS.
  7. S. Shetty, A. P. J. Jansen and R. A. van Santen, J. Phys. Chem. C, 2008, 112, 1402714033 Search PubMed.
  8. G. Wulff, Velocity of growth and dissolution of crystal faces, Z. Kristallogr., 1901, 34, 449 CAS.
  9. E. Kaxiras, Y. Bar-Yam, J. D. Joannopoulos and K. C. Pandey, Ab initio theory of polar semicondutor surfaces. 1. Methodology and the (2 × 2) reconstructions of GaAs(111), Phys. Rev. B: Condens. Matter Mater. Phys., 1987, 35, 9625 CrossRef CAS.
  10. M. Scheffler, Physics of Solid Surfaces, Elsevier, Amsterdam, 1987 Search PubMed.
  11. G.-X. Qian, R. M. Martin and D. J. Chadi, 1st-principles study of the atomic reconstructions and energies of Ga-stabilized and As-stabilized GaAs(100) surfaces, Phys. Rev. B: Condens. Matter Mater. Phys., 1988, 38, 7649 CrossRef CAS.
  12. K. Reuter and M. Scheffler, Composition, structure, and stability of RuO2 (110) as a function of oxygen pressure, Phys. Rev. B: Condens. Matter Mater. Phys., 2002, 65, 035406 CrossRef.
  13. P. Sautet and F. Cinquini, ChemCatChem, 2010, 2, 636 CrossRef CAS.
  14. K. Reuter and M. Scheffler, Phys. Rev. Lett., 2003, 90, 046103 CrossRef PubMed.
  15. K. Reuter and M. Scheffler, Phys. Rev. B: Condens. Matter Mater. Phys., 2003, 68, 045407 CrossRef.
  16. D. R. Stull and H. Prophet, JANAF Thermochemical Tables, U.S. National Bureau of Standards (U.S. EPO), Washington, D.C., 2nd edn, 1971 Search PubMed.
  17. The ab initio calculations were performed using the DFT code CASTEP30 with a plane-wave basis set (Ecutoff = 380 eV), Vanderbilt ultrasoft pseudopotentials31 and the PBE-GGA exchange–correlation functional.32 The Brillouin zones of the (1 × 1)-surface unit cells of Ru(0001), (10[1 with combining macron]0), (10[1 with combining macron]1), (11[2 with combining macron]1), and (13[4 with combining macron]2) were sampled with (8 × 8), (5 × 8), (4 × 8), (4 × 4), and (3 × 3) Monkhorst–Pack k-point meshes. The surfaces were modeled by 5-, 11-, 14-, 19-, and 30-layer slabs, respectively, separated by at least 13 Å vacuum. The bottom 2, 4, 4, 4, and 14 layers were fixed at the calculated bulk structure, and the geometry of the remaining layers was fully optimized (up to < 0.03 eV Å−1).
  18. P. Kaghazchi and T. Jacob, Phys. Chem. Chem. Phys., 2012, 14, 13903 RSC.
  19. H. Wang, Ph.D. thesis, Rutgers University, 2008.
  20. Y. Cui, Q. Fu, D. Tan and X. Bao, ChemPhysChem, 2010, 11, 995 CrossRef CAS PubMed.
  21. F. Abild-Pedersen, J. K. Norskov, J. R. Rostrup-Nielsen, J. Sehested and S. Helveg, Phys. Rev. B: Condens. Matter Mater. Phys., 2006, 73, 115419 CrossRef.
  22. X. Tan, J. Zhoua, F. Liu, Y. Peng and B. Zhao, Eur. Phys. J. B, 2010, 74, 555 CrossRef CAS.
  23. K. Johnson, Q. Ge 1, B. Sauerhammer, S. Titmuss and D. A. King, Surf. Sci., 2001, 478, 49 CrossRef CAS.
  24. D. Cheng, G. Barcaro, J.-C. Charlier, M. Hou and A. Fortunelli, J. Phys. Chem. C, 2001, 115, 10537 CrossRef.
  25. R. W. Joyner, G. R. Darling and J. B. Pendry, Surf. Sci., 1988, 205, 513 CrossRef CAS.
  26. J. Chen and Z.-P. Liu, J. Am. Chem. Soc., 2008, 130, 7929 CrossRef CAS PubMed.
  27. E. van Steen, M. Claeys, M. E. Dry, J. van de Loosdrecht, E. L. Viljoen and J. L. Visagie, J. Phys. Chem. B, 2005, 109, 3575 CrossRef CAS PubMed.
  28. A. Y. Khodakov, W. Chu and P. Fongarland, Chem. Rev., 2007, 107, 1692 CrossRef CAS PubMed.
  29. http://www.bw-grid.de, member of the German D-Grid initiative, funded by the Ministry for Education and Research (Bundesministerium fuer Bildung und Forschung) and the Ministry for Science, Research and Arts Baden-Wuerttemberg (Ministerium fuer Wissenschaft, Forschung und Kunst Baden-Wuerttemberg).
  30. M. D. Segall, P. L. D. Lindan, M. J. Probert, C. J. Pickard, P. J. Hasnip, S. J. Clark and M. C. Payne, J. Phys.: Condens. Matter, 2002, 14, 2717 CrossRef CAS.
  31. D. Vanderbilt, Phys. Rev. B: Condens. Matter Mater. Phys., 1990, 41, 7892 CrossRef.
  32. J. P. Perdew, K. Burke and M. Ernzerhof, Phys. Rev. Lett., 1996, 77, 3865 CrossRef CAS PubMed.

This journal is © The Royal Society of Chemistry 2014