Electrochemical study of Alamar Blue (resazurin) in aqueous solutions and room-temperature ionic liquid 1-butyl-3-methylimidazolium tetrafluoroborate at a glassy carbon electrode
Sadegh Khazalpour and
Davood Nematollahi*
Faculty of Chemistry, Bu-Ali Sina University, Hamedan, 65178-38683, Iran. E-mail: nemat@basu.ac.ir
First published on 14th January 2014
Abstract
Electrochemical behaviour of Alamar Blue (resazurin) at a glassy carbon electrode in aqueous buffered solutions and room-temperature ionic liquid 1-butyl-3-methylimidazolium tetrafluoroborate, [C4mim][BF4], was studied using the cyclic voltammetry, chronoamperometry and chronocoulometry techniques. Our data confirm that the electrochemical reduction of resazurin in aqueous solutions takes place in two processes. In the first step, the cyclic voltammogram reveals an irreversible two-electron process leading to resorufin, whereas in the second step, cyclic voltammogram displays a reversible two-electron process related to the formation of dihydroresorufin. In [C4mim][BF4], however, our voltammetric data indicate that the reduction of resazurin takes place in two one-electron processes. The diffusion coefficient of resazurin in aqueous buffered solution and in [C4mim][BF4] was also determined using the both single potential-step chronoamperometry and chronocoulometry techniques. It is found that the diffusion coefficient varies from 8.5 × 10⁻⁷ cm2 s−1 in aqueous solution to 1.2 × 10⁻⁷ cm2 s−1 in [C4mim][BF4]. The orientation of adsorbed resazurin on the surface of glassy carbon electrode was also estimated. It is found that the orientation of the adsorbed resazurin at glassy carbon surface is edgewise.
Introduction
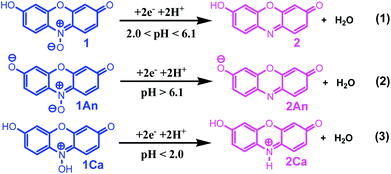
Dyes are used quite frequently as probes to analyze the behavior of various types of systems especially those having microheterogeneous regions.1,2 Additionally, various biochemical and industrial properties can be determined using dyes by utilizing the color changes of the compounds upon oxidation or reduction.2 Resazurin (1) is a phenoxazin-3-one dye with nitrone functional group that reduces in two steps, irreversibly to resorufin (2) and then reversibly to dihydroresorufin (3), providing color changes from purple to pink to colorless. Reduction of resazurin (1) (disappearance of purple) has been used to characterize bacterial contamination in milk,3 testing various biological materials such as biochemical antioxidants,4 assay cell viability,5 quality of semen,6 susceptibility testing of pathogenic microorganisms including many gram-negative bacteria, enterococci, grampositive bacteria7 and to quantify microbial activity in sediments.8 Other example of its use is the “resazurin test”; in this test the reduction of 1 to resorufin (2) depends on the ability of metabolically active spermatozoa. This reduction is manifested by a visible change in color from blue to pink, and this color change correlates significantly with concentration of motile spermatozoa.9 Resorufin (2) has also been used as a probe molecule to study the reorientation of solvent molecules, and has shown an interesting chemistry and photochemistry in protic solvents which strongly depends on temperature, viscosity and structure of the solvent.10–12 The reoxidation of dihydroresorufin (3) (appearance of pink) is widely used in anaerobic microbiology to indicate contamination with oxygen.13 These increased demands highlight the need for better understanding of the resazurin (1) electrochemical behavior. Furthermore, in some cases there is a relationship between voltammetry and biological samples, and the knowledge of the mechanism of their electrode reactions can provide a useful clue in elucidation of the mechanism of their interaction with living cells.14 Despite of the numerous reports on resazurin, a literature survey reveals that, a detailed study of the electrochemical behavior of resazurin (1) is missing and only one report has appeared on its electrochemical reduction at a mercury electrode.15 Ionic liquids are purely ionic, salt-like materials, which are per definition liquid below 100 °C. They have several advantages such as wide electrochemical windows, high conductivity, high thermal stability, good solvating ability and low volatility, which make them as ideal solvent in electrochemical studies.16,17 They have been extensively investigated for use as replacement solvents for numerous applications including clean synthesis and dye extractions.18–21The importance of resazurin (1) on the one hand and the lack of electrochemical data, on the other hand, prompted us to investigate the electrochemical reduction of resazurin (1) in the aqueous solutions and in a room-temperature ionic liquid, 1-butyl-3-methylimidazolium tetrafluoroborate, [C4mim][BF4] using cyclic voltammetry, chronoamperometry and chronocoulometry methods. In this paper the detailed mechanisms are proposed for the electrochemical reduction of resazurin (1) in different pH values and ionic liquid. This work also reports the orientation of adsorbed resazurin on the surface of glassy carbon electrode.
Results and discussion
The effect of pH
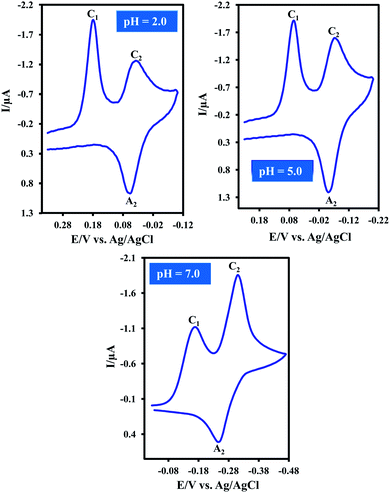
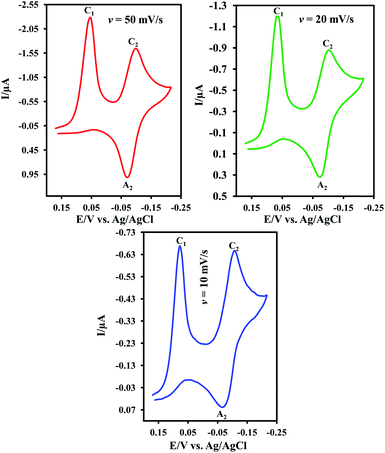
Cyclic voltammogram of resazurin (1) (0.05 mM) in water (pH = 2.0)/acetonitrile mixture (80/20, v/v) is shown in Fig. 1. In this condition, cyclic voltammogram exhibits two cathodic (C1 and C2) and one anodic peaks (A2) at 0.17, 0.04 and 0.06 V vs. Ag/AgCl, respectively. The cathodic peak C1 is related to the transformation of 1 to resorufin (2) within an irreversible two-electron process.15 Peaks C2 and A2 are related to the transformation of 2 to dihydroresorufin (3) and vice versa within a reversible two-electron process.15Cyclic voltammograms of 1 in water/acetonitrile mixture (80/20, v/v) at pHs 5.0 and 7.0 are also shown in Fig. 1. As can be seen, the cathodic peak current ratio (IpC1/IpC2) increases with decreasing pH as well as increasing potential scan rate (Fig. 2). This is due to the decrease of adsorption of 1 with increasing pH. In other words, this study indicates that the effect of pH on the adsorption of 1 is remarkable and shows that with increasing pH, the interaction between anionic forms of 1 and water becomes stronger and so, the adsorption capacity of 1 decreased.
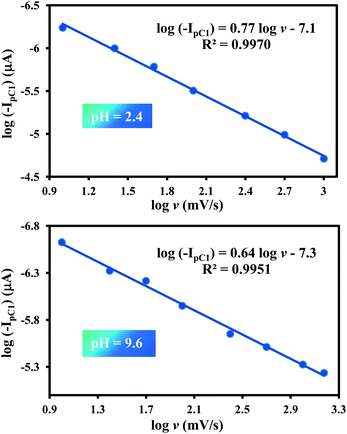
For more data, we plotted log![[thin space (1/6-em)]](https://www.rsc.org/images/entities/char_2009.gif) Ip for the peak C1 vs. log
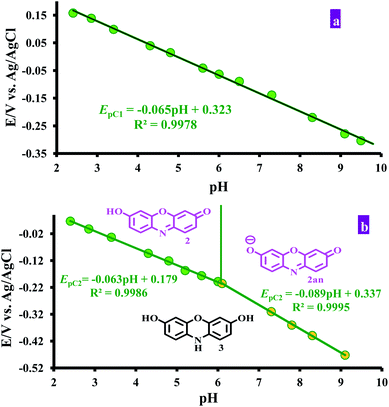
Ip for the peak C1 vs. log![[thin space (1/6-em)]](https://www.rsc.org/images/entities/char_2009.gif) v at pH values 2.4 and 9.6. In both cases, a linear relationship was observed (Fig. 3). The slopes are 0.77 and 0.64, respectively. These values are higher than the theoretical value of 0.5 for the diffusion controlled process and are less than one, which is theoretical value for the adsorption-controlled electrode process. These results indicate a partial adsorption of 1 at the surface of electrode in both pHs and confirm the effect of pH on the adsorption of 1. It was also found that the potential of both cathodic peaks (EpC1 and EpC2) shifted to the negative potentials by increasing pH. This is expected because of the participation of proton(s) in the reduction reaction of 1 to 2 and 2 to 3. The half-wave potential (E1/2), is given by:
v at pH values 2.4 and 9.6. In both cases, a linear relationship was observed (Fig. 3). The slopes are 0.77 and 0.64, respectively. These values are higher than the theoretical value of 0.5 for the diffusion controlled process and are less than one, which is theoretical value for the adsorption-controlled electrode process. These results indicate a partial adsorption of 1 at the surface of electrode in both pHs and confirm the effect of pH on the adsorption of 1. It was also found that the potential of both cathodic peaks (EpC1 and EpC2) shifted to the negative potentials by increasing pH. This is expected because of the participation of proton(s) in the reduction reaction of 1 to 2 and 2 to 3. The half-wave potential (E1/2), is given by:
| E′p = Ep − (2.303mRT/2F)pH |
| E′p = 0.32 − 0.065pH |
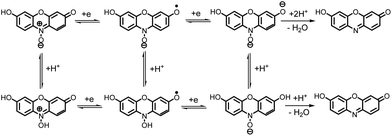
These data show that there is no significant difference between the acid–base properties of the redox couples, 1/2, 1An/2An or 1Ca/2Ca. According to these data, possible detailed mechanisms for the reduction of resazurin (1), “anionic” resazurin (1An) and “cationic” resazurin (1Ca) to resorufin (2), “anionic” resorufin (2An) and “cationic” resorufin (2Ca) respectively, are represented by the square-Schemes 2–4. The mechanism actually occurring depends on the solution pH.
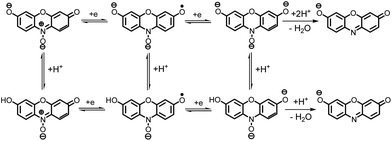 | ||
| Scheme 3 Detailed mechanism for the reduction of “anionic” resazurin (1An) to “anionic” resorufin (2An). | ||
 | ||
| Scheme 4 Detailed mechanism for the reduction of “cationic” resazurin (1Ca) to “cationic” resorufin (2Ca). | ||
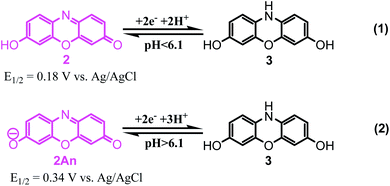
The second EpC2-pH diagram (curve b) comprises two linear segments with different slopes, which are crossing at pH = 6.1.
In pHs < 6.1:
| E′1/2 = 0.18 − 0.063pH or slope = 63 mV/pH |
In pHs > 6.1:
| E′1/2 = 0.34 − 0.089pH or slope = 89 mV/pH |
These data show that in various pHs, three different forms can be produced, two in the oxidized forms and another in reduced form. On the basis of the above mentioned slopes, it can be concluded that the electrode reaction occurring at the pH below 6.1 is a two-electron, two-proton process involving the reduction of resorufin (2) to the corresponding dihydroresorufin (3) in forward scan and oxidation of 3 to 2 in reverse scan with E1/2 = 0.18 V vs. Ag/AgCl (Scheme 5, eqn (1)). Whereas, the electrode reaction at pH > 6.1, corresponds to the two-electron, three-proton process with E1/2 = 0.34 V vs. Ag/AgCl involving the reduction of “anionic” resorufin (2An) to the corresponding dihydroresorufin (3) and vice versa (Scheme 5, eqn (2)). Also, the calculated pKa for 2/2An equilibrium shown in Scheme 6 is: 6.1.
Electrochemical study in [C4mim][BF4]
Room temperature ionic liquids (RTILs) can be defined as compounds composed entirely of ions, generally a bulky cation and an inorganic anion, existing in the liquid state at 298 K.22,23 RTILs have found increasingly popular use as solvents due to favourable properties such as high thermal stability, low volatility, wide electrochemical window and high tuneability.24,25 They also do not require addition of supporting electrolyte.Cyclic voltammogram of resazurin (1) (0.1 mM) in room-temperature ionic liquid (1-butyl-3-methylimidazolium tetrafluoroborate) [C4mim][BF4] is shown in Fig. 5. In this condition, cyclic voltammogram exhibit two cathodic (CI and CII) at −0.54 and −0.77 V vs. Ag/AgCl in the negative going scan, respectively and two anodic peaks (AI and AII) at −0.62 V and −0.47 V vs. Ag/AgCl in the positive going scan, respectively. As can be seen in Schemes 2–4, the reduction of 1 to 2, is involved in proton transfer from the water to the intermediate. This process is stopped by the lack of proton available in the ionic liquid.
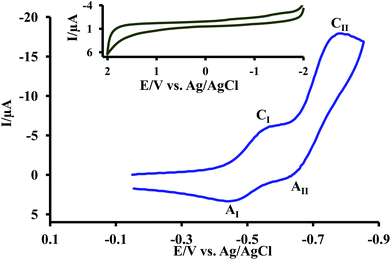 | ||
| Fig. 5 Cyclic voltammogram of resazurin (1) (0.1 mM) in [C4mim][BF4] at a glassy carbon electrode. Inset: cyclic voltammogram of background. Scan rate: 1500 mV s−1. | ||
It is well known that, the reduction mechanism of an organic compound changes from the one two-electron step in a protic to the two one-electron steps in an aprotic environment.26,27 So, it can be concluded that, the two-electron reduction of 1 to 2 in aqueous solutions (Scheme 1), changes to the two successive one-electron transfer steps in [C4mim][BF4] (Scheme 7).
According to the proposed mechanism, it seems that the cathodic peaks (CI and CII) and their anodic counterparts (AI and AII) are related to the transformation of 1 to 1R and 1R to resorufin (2) within two quasi-reversible one-electron processes and vice versa.
Chronoamperometry and diffusion coefficient
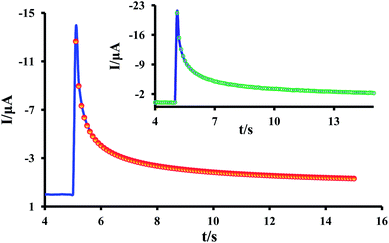
Chronoamperometry28 has been used for measuring the diffusion coefficients29–31 and the rate constants of homogeneous reactions.32,33 The main advantage of this method is its simplicity since it does not require any complicated potential-time dependences. The sample was pre-treated by holding the potential at a point corresponding to zero faradic current for 5 s, after which the potential was stepped to −0.17 V and the current measured for 10 s. The time-dependent current response obtained on the this step was analyzed using the following equations, as proposed by Shoup and Szabo,34 which sufficiently describe the current response, i, over the entire time domain, with a maximum error of less than 0.6%.| i = −4nFDcrdf(τ) | (1) |
f(τ) = 0.7584 + 0.8863τ−1/2 + 0.2146![[thin space (1/6-em)]](https://www.rsc.org/images/entities/char_2009.gif) exp(−0.7823τ−1/2) exp(−0.7823τ−1/2)
| (2) |
 | (3) |
A nonlinear curve fitting function (handwritten) was used to fit the theoretical data (using eqn (2)) to the experimental results. The value of rd, was calculated as discussed in ref. 36. An example of the fitting of experimental and theoretical data is shown in Fig. 6. Diffusion coefficients of resazurin (1) in different temperature from the best-fit are shown in Table 1. As can be seen, the diffusion coefficient increases with increasing temperature. The diffusion coefficient value of resazurin (1), was also determined in [C4mim][BF4] and compared to aqueous buffered solution (pH = 7.3) at room temperature. It is found that, the diffusion coefficient varies from 8.5 × 10⁻⁷ cm2 s−1 in aqueous solution to 1.2 × 10⁻⁷ cm2 s−1 in [C4mim][BF4] (η = 108 mPa s31). This is expected, since the diffusion coefficient decreases with increasing solvent viscosity.37
| T/°C | D/cm2 s−1 (× 10−6) | T/°C | D/cm2 s−1 (× 10−6) |
|---|---|---|---|
| 5 | 0.85 | 35 | 2.04 |
| 10 | 1.11 | 40 | 2.64 |
| 15 | 1.20 | 45 | 3.28 |
| 20 | 1.27 | 50 | 4.05 |
| 25 | 1.39 | 55 | 6.22 |
| 30 | 1.63 |
Chronocoulometry and orientation
An alternative and very useful, mode for recording the electrochemical response is to integrate the current, so that one obtains the charge passed as a function of time, Q(t). This chronocoulometric mode was popularized by Anson.38 The charge passed in reducing the diffusing reactant is described in eqn (4):28
 | (4) |
As can be seen, Qd rises with time, and a plot of its value vs. tl/2 is linear. The slope of this plot can be used to evaluating diffusion coefficient; D. In this work, a good agreement is observed between the diffusion coefficient obtained from chronoamperometry method and calculated by chronocoulometry method. This method is also useful for studying electroactive material that is adsorbed on an electrode surface. In this technique, the charge owing to electrolysis of the adsorbed species can be differentiated from the charge that is due to electrolysis of solution species. In this method, the total charge (Qtotal) measured in response to the potential step comes from electrolysis of diffused species (Qd = 2nπ−1/2FAD1/2C1/2t1/2), electrolysis of adsorbed species (Qads) and charging of the double layer (Qdl).28 The diffusion charge (Qd) has a square root dependence on time (Cottrell equation) whereas the adsorbed (Qads) and double layer (Qdl) charges are time-independent terms:
 | (5) |
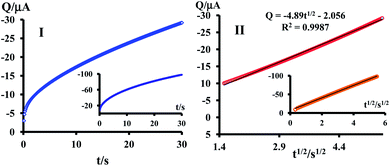
Chronocoulogram of 1.0 mM resazurin (1) in aqueous solution at pH = 7.3 were recorded at a glassy carbon electrode. The plots of the total charge (Qtotal) vs. t and t1/2 are shown in Fig. 7 (curves I and II).
As shown in curve II, the line does not pass through the origin. This is related to the participation of double-layer charging (Qdl) and the electroreduction of adsorbed resazurin (1) (Qads) in the Qtotal. Therefore, the intercept of this line can be used for determination of the sum of Qads and Qdl. Moreover, Qads can be calculated by subtracting Qdl from the intercept. Qads can be obtained by comparing the intercept of the Q–t1/2 plot obtained for a solution containing resazurin (1), with the charge passed in the same experiment performed with supporting electrolyte only.23 The same procedure was performed in [C4mim][BF4]. The technique of potential step chronocoulometry was undertaken using a sample time of 0.10 s, to determine the diffusion coefficient and the surface excess, Γ (mol cm−2), of adsorbed resazurin. The sample was pretreated by holding the potential at a point corresponding to zero faradic current (0.00 V) for 5 s, after which the potential was stepped from 0.00 to −0.17 V, and the electricity passed during electrolysis is measured for 30 s. The time-dependent charge response obtained on this step was analyzed using the eqn (5), as proposed by Anson.38 Diffusion coefficient and Γ of resazurin (1) in aqueous solution and in [C4mim][BF4] are shown in Table 2. Despite of the differences in the structure and property of water and [C4mim][BF4], only minor differences in the surface excess, Γ, of resazurin (1) was found.
Orientation of adsorbed resazurin
The absorbed concentration (Γ) of 2.04 × 10⁻¹⁰ mol cm−2 is reasonable for a monolayer on a solid electrode surface.39 Adsorption data are given in terms of σ, the average area (cm2) occupied by a molecule in the adsorbed layer:40| σ = 1/NAΓ | (6) |
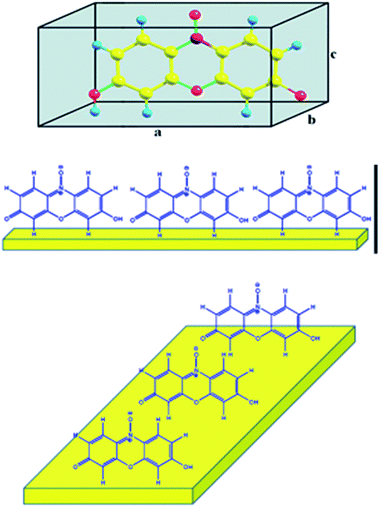 | ||
| Fig. 8 Ball and stick model structures of resazurin (1) in cubic unit cells and the probable orientation of the adsorbed resazurin at a glassy carbon electrode. | ||
Experimental
Cyclic voltammetry, chronoamperometry and chronocoulometry were performed using an Autolab model PGSTAT 30 potentiostat/galvanostat. The working electrode used in the voltammetry experiments was a glassy carbon disk (0.038 cm2 area) and a platinum wire was used as a counter electrode. The working electrode potentials were measured versus Ag/AgCl, 3 M, (from Metrohm). Resazurin were reagent-grade materials from Aldrich. Stock standard solutions were freshly prepared every day and were protected from light and air. All chemicals for the preparation of buffer solutions (phosphoric acid, perchloric acid, acetic acid and sodium bicarbonate) and solvents were of pro-analysis grade from E. Merck. These chemicals were used without further purification. Cyclic voltammetric, chronoamperometric and chronocoulometric measurements of each solution were carried out in a buffer solution (pH 2–10) as the supporting electrolyte. A solution of buffer, 9.0 mL, was put into the voltammetric cell and was deoxygenated with high-purity nitrogen (99.999%) for about 10 min. The background voltammograms were obtained by scanning the potential from 0.0 V to about −0.4 V or −0.6 V depending on pH of the solution. An aliquot of the stock solution of resazurin was added to the buffer solution and the cyclic voltammograms, chronoamperogram and chronocoulogram were recorded. 1-Butyl-3-methylimidazolium tetrafluoroborate, [C4mim][BF4], was dried as reported.43Conclusions
In this study electrochemical reduction of resazurin has been studied in aqueous buffered solutions with different pH values and in room-temperature ionic liquid, [C4mim][BF4]. Our results show that the reduction of resazurin in aqueous solutions proceeds by two two-electron processes; the first one is irreversible and the second one is reversible. In contrast, the reduction of resazurin in [C4mim][BF4], takes place in two quasi-reversible one-electron processes. In addition, the diffusion coefficient and surface excess, Γ, of resazurin in aqueous buffered solutions and [C4mim][BF4] were calculated. It is found that, the diffusion coefficient of resazurin in aqueous solution is more than that of [C4mim][BF4]. This is expected, since the diffusion coefficient decreases with increasing solvent viscosity. In addition, the average area occupied by each resazurin molecule on the surface of glassy carbon electrode in aqueous solution (pH = 7.3) was calculated to be 81.5 Å2 as compared with 83.3 Å2 found in [C4mim][BF4]. Furthermore, the orientation of resazurin on the glass carbon electrode was estimated by comparing the average area occupied by a molecule of resazurin (σ) with the calculated surface area for each possible orientation (flat, endwise and edgewise). The results show that the orientation of adsorbed resazurin molecules at glassy carbon surface is edgewise.Notes and references
- K. Kalyanasundaram, Photochemistry in microheterogeneous systems, Academic Press, New York, 1987 Search PubMed
.
- H. A. Montejano, M. Gervaldo and S. G. Bertolotti, Dyes Pigm., 2005, 64, 117 CrossRef CAS PubMed
.
- E. M. Foster, F. E. Nelson, M. L. Speck, R. N. Doetsch and J. C. Olson, Dairy Microbiology, Prentice-Hall, Englewood Cliffs, NJ, 1957, p. 492 Search PubMed
.
- W. A. Prütz, J. Chem. Soc., Chem. Commun., 1994, 1639 RSC
.
- J. O'Brien, I. Wilson, T. Orton and F. Pognan, Eur. J. Biochem., 2000, 267, 5421 CrossRef CAS
.
- K. V. R. Reddy, P. K. Meherji and S. K. Shahani, Indian J. Exp. Biol., 1997, 35, 369 CAS
.
- C. N. Baker, S. N. Banerjee and F. C. Tenover, J. Clin. Microbiol., 1994, 32, 1261 CAS
.
- D. Liu and W. M. J. Strachan, Adv. Limnol., 1979, 12, 24 CAS
.
- A. M. Mahmoud, F. H. Comhaire, L. Vermeulen and E. Andreou, Hum. Reprod., 1994, 9, 1688 CAS
.
- P. Schellenberg and J. Friedrich, J. Lumin., 1993, 56, 143 CrossRef CAS
.
- G. J. Blanchant and C. A. Gihal, J. Phys. Chem., 1988, 92, 5950 CrossRef
.
- L. E. Flamigni, E. Venuti, N. Camaioni and F. A. Barigelletti, J. Chem. Soc., Faraday Trans. 2, 1989, 85, 1935 RSC
.
- P. Gerhardt, Manual of Methods for General Bacteriology, American Society for Microbiology, Washington DC, 1981, p. 525 Search PubMed
.
- D. Bhaskara Rao, Electrochemistry for Environmental Protection, Arora Offset Press, Delhi, 2001 Search PubMed
.
- S. Çakir and E. Y. Arslan, Chem. Pap., 2010, 64, 386 CrossRef PubMed
.
- D. S. Silvester, Analyst, 2011, 136, 4871 RSC
.
- J. H. Davis, Chem. Lett., 2004, 1072 CrossRef CAS
.
- R. Vijayaraghavan, N. Vedaraman, M. Surianarayanan and D. R. MacFarlane, Talanta, 2006, 69, 1059 CrossRef CAS PubMed
.
- J. Lin, Y. Teng, Y. Lu, S. Lu, X. Hao and D. Cheng, Clean, 2013, 41, 9999 Search PubMed
.
- D. K. Sasmal, A. K. Mandal, T. Mondal and K. Bhattacharyya, J. Phys. Chem. B, 2011, 115, 7781 CrossRef CAS PubMed
.
- D. K. Sasmal, T. Mondal, S. S. Mojumdar, A. Choudhury, R. Banerjee and K. Bhattacharyya, J. Phys. Chem. B, 2011, 115, 13075 CrossRef CAS PubMed
.
- K. N. Marsh, A. Deev, A. C. T. Wu, E. Tran and A. Klamt, Korean J. Chem. Eng., 2002, 19, 357 CrossRef CAS
.
- D. S. Silvester and R. G. Compton, Z. Phys. Chem., 2006, 220, 1247 CrossRef CAS
.
- J. H. Davis, J. Chem. Lett., 2004, 33, 1072 CrossRef CAS
.
- P. Hapiot and C. Lagrost, Chem. Rev., 2008, 108, 2238 CrossRef CAS PubMed
.
- K. Izutsu, Electrochemistry in Nonaqueous Solutions, Wiley-VCH, Weinheim, 2002 Search PubMed
.
- R. Esmaili, F. Varmaghani and D. Nematollahi, J. Electrochem. Soc., 2012, 159, H680 CrossRef CAS PubMed
.
- A. J. Bard and L. R. Faulkner, Electrochemical Methods: Fundamentals and Applications, John Wiley & Sons, New York, 2nd edn, 2001 Search PubMed
.
- W. Hyk, A. Nowicka and Z. Stojek, Anal. Chem., 2002, 74, 149 CrossRef CAS
.
- J. V. Macpherson and P. R. Unwin, Anal. Chem., 1997, 69, 2063 CrossRef CAS PubMed
.
- H. Ikeuchi and M. Kanakubo, J. Electroanal. Chem., 2000, 493, 93 CrossRef CAS
.
- M. L. Olmstead and R. S. Nicholson, Anal. Chem., 1969, 41, 851 CrossRef CAS
.
- A. Bewick, D. Serve and T. A. Joslin, J. Electroanal. Chem., 1983, 154, 81 CrossRef CAS
.
- D. Shoup and A. Szabo, J. Electroanal. Chem., 1982, 140, 237 CrossRef CAS
.
- R. Wibowo, L. Aldous, E. I. Rogers, S. E. Ward Jones and R. G. Compton, J. Phys. Chem. C, 2010, 114, 3618 CAS
.
- M. J. A. Shiddiky, A. A. J. Torriero, C. Zhao, I. Burgar, G. Kennedy and A. M. Bond, J. Am. Chem. Soc., 2009, 131, 7976 CrossRef CAS PubMed
.
- K. R. J. Lovelock, A. Ejigu, S. Fun Loh, S. Men, P. Licence and D. A. Walsh, Phys. Chem. Chem. Phys., 2011, 13, 10155 RSC
.
- F. C. Anson, Anal. Chem., 1966, 38, 54 CrossRef CAS
.
- R. Bowling and R. L. McCreery, Anal. Chem., 1988, 60, 605 CrossRef CAS
.
- M. P. Soriaga and A. T. Hubbard, J. Am. Chem. Soc., 1982, 104, 2735 CrossRef CAS
.
- M. P. Soriaga, P. H. Wilson, A. T. Hubbard and C. S. Benton, J. Electroanal. Chem., 1982, 142, 317 CrossRef CAS
.
- L. C. Pauling, Nature of the Chemical Bond, Cornell University Press, New York, 3rd edn, 1960, p. 221 Search PubMed
.
- A. Brandt, M. J. Ray, T. Q. To, D. J. Leak, R. J. Murphy and T. Welton, Green Chem., 2011, 13, 2489 RSC
.
| This journal is © The Royal Society of Chemistry 2014 |

