Mariana Hinojosa-Reyesa,
Vicente Rodríguez-González*a and
Rodolfo Zanellab
aDivisión de Materiales Avanzados, IPICYT, Instituto Potosino de Investigación Científica y Tecnológica, Camino a la Presa San José 2055 Col. Lomas 4a. sección C.P., 78216, San Luis Potosí, S.L.P., Mexico. E-mail: vicente.rdz@ipicyt.edu.mx; Tel: +52 44483 42000 ext. 7295
bCentro de Ciencias Aplicadas y Desarrollo Tecnológico, Universidad Nacional Autónoma de México, Circuito Exterior S/N, Ciudad Universitaria, A. P. 70-186, Delegación Coyoacán, C.P. 04510, Mexico D. F., Mexico
First published on 4th December 2013
Gold nanoparticles deposited on TiO2–Ni prepared by sol–gel process catalyses the CO oxidation to hydrogen purification. Gold-catalysts were characterized by UV-Vis and Raman spectroscopies, X-ray diffraction, H2-TPR, N2 physisorption, HRTEM and STEM-HAADF microscopies. These catalysts were applied in the water–gas shift reaction at temperatures from 30 to 300 °C and this reaction was studied by DRIFTS to understand the catalytic surface phenomena. The best CO conversion was showed by doped Au/TiO2–Ni(1) with regard to Au/TiO2 sol–gel and Au/TiO2–P25 catalysts. DRIFTS confirm the strong and favorable effect of doping nickel ions into the reducible TiO2 framework. Nickel contents from 1 to 10% enhance the WGS reaction in contrast to the undoped catalyst. Ni-doped TiO2 support was practically inert for WGS reaction. These gold catalysts present significant activity in the water–gas shift reaction that allows purification of hydrogen from industrial sources at low-temperature.
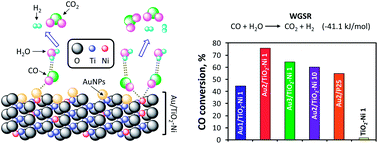
On the other hand, the WGSR is an important step to remove carbon monoxide from various chemical processes such as hydrogen from steam reforming of hydrocarbons and ammonia production.2 This reaction involves the reduction of H2O molecule and the oxidation of CO to produce CO2 and H2, breaking an energetic barrier of 41.1 kJ mol−1 (exothermic reaction).3 This method is one of the most used when high-purity hydrogen is required for the operation of fuel cells that use sensitive membranes. Recently, the interest of WGSR has been renewed due to the possibility to obtain pure hydrogen for the more efficient use of fuel-cells or in other reactions related to environmental protection and clean technologies.4,5
Currently the use of Au-based catalysts has been of interest in WGSR thanks to the good catalytic properties of nanometric gold at low reaction temperatures in contrast to others metal catalysts and the inert properties of bulk gold. It has been demonstrated that gold nanoparticles (AuNPs) can have remarkable catalytic properties in this reaction.6 AuNPs supported on metallic oxides are active for certain reactions including low-temperature catalytic combustion, partial oxidation of hydrocarbons, and reduction of nitrogen oxides.7 It is generally agreed that the catalytic activity of gold catalysts depends on the size, shape and dispersion of the gold particles, but the nature of the support material, the preparation method, and the activation procedure have a crucial role.7–11 The role of the TiO2 as substrate is very important, because, most of the works report that AuNPs supported on reducible oxide supports are more active than gold on nonreducible supports as Al2O3.12 Andreeva et al. were the first to use AuNPs supported on reducible support for the WGSR displaying promising results.13,14 TiO2 as a support of AuNPs has been vastly used with outstanding results. However to enhance the activity, stability and AuNPs dispersion, doping TiO2 framework has been the principal strategy.15 To our knowledge, there are no reports of the use of nickel-loaded TiO2 as a reducible support for WGSR. Particularly, reducible supports such as TiO2, CeO2 and Fe2O3 are the most suitable for CO oxidation at low temperatures; however, its role in the CO oxidation is still under discussion.16
On the other hand, there is evidence that nickel oxide can act as reducible support and has a good performance in many reactions such as catalytic hydrogenation, Wolff–Kishner and Clemmensen reduction, methanation by Fisher Tropsch, among others.17–19 Also, Sreethawong et al.20 reported synthesis of mesoporous TiO2-supported NiO photocatalyst by single step sol–gel process for photocatalytic H2-production from methanol aqueous solution. Jing et al.21 investigated the fabrication of Ni-doped mesoporous TiO2 and its photocatalytic activity for hydrogen evolution in methanol aqueous solution. In 2009, Jang et al.22 reported the enhanced photocatalytic H2-production efficiency of nickel-intercalated titanate nanotube from methanol aqueous solution.23 However, to the best of our knowledge, there aren't reports on the water–gas shift reaction H2 production over Au/TiO2–Ni.
In the present work, we study for the first time the WGSR at low temperatures using AuNPs supported on the TiO2 reducible support modified with different contents of nickel. The role of nickel in the TiO2 host lattice was determined by XRD, N2 physisorption, TPR, UV-Vis and Raman spectroscopies and HRTEM and STEM microscopies. Diffuse reflectance infrared Fourier transform spectroscopic (DRIFTS) characterization was carried out to directly obtain insights of AuNPs support interactions with CO in the WGSR evaluation.
After the deposition–precipitation procedure, all the samples were centrifuged, washed with water at 50 °C and then centrifuged four times and dried under vacuum for 2 h at 100 °C. The thermal treatments were performed in a U reactor with a fritted plate of 1.5 cm of diameter; the calcination under a flow of dry air (1 mL min−1 mgsample−1) was performed at 300 °C, for 2 h. All the catalysts were stored at room temperature under vacuum in a desiccator away from light in order to prevent any alteration.28,29 Catalysts were identified as Au/TiO2–Ni(X), where Au content was constant (2 wt%) and X indicates Ni content (wt%).
The reactant gas mixture (5% CO, 10% water vapor in He balance) was introduced with a total flow rate of 40 mL min−1, the heating rate was 2 °C min−1. The products were monitored with an on-line gas chromatograph Agilent Technologies 6890N equipped with a FID detector and a HP Plot Q column. H2O produced during the WGSR was trapped into U glass before the FID detector.
The hydrogen temperature programmed reduction (H2-TPR) study of the dried catalysts was performed in a RIG-150 unit under a flow of 10% H2/Ar gas mixture (30 mL min−1) and with a heating rate of 10 °C min−1 from room temperature to 600 °C. H2O produced during the reduction process was trapped before the TCD detector. After ex situ thermal treatment under the identical conditions as for the WGSR, the catalysts were examined by transmission electron microscopy (TEM) in a Tecnai FEI 300 microscope operated at 300 kV. The samples were suspended in isopropanol and then sonicated for 5 min. Finally, the samples were mounted in a Cu TEM grid. The particle size distribution histograms for the catalysts were established from the measurements of 300 particles. The average particle diameter (ds) was calculated using the following formula: ds = Σnidi/Σni, where ni is the number of particles of diameter di.
CO adsorption was followed by DRIFTS spectroscopy to characterize the metallic surface. The experiments were carried out in a Nicolet 670FT-IR spectrophotometer equipped with a Praying Mantis for DRIFTS and a low/high temperature reaction chamber by Harrick. In each experiment, approximately 25 mg of dried catalyst was packed in the sample holder and pretreated in situ under air flow (30 mL min−1, heating rate 2 °C min−1) up to the chosen temperature followed by a plateau for 1 h. After the thermal treatment, the catalyst was cooled to room temperature under the same gas flow and then purged with N2 before the introduction of 5% CO in N2 (30 mL min−1). A spectrum recorded under N2 flow was used as reference, then several spectra were recorded under the CO flow until the band intensity was stable; afterwards, temperature was increased under CO flow, and the spectra were recorded at increasing temperatures. Finally the catalyst was cooled again until 100 °C and the surface was cleaned with N2, in order to simulate WGSR water was introduced and CO, spectra were recorded from 100 to 300 °C. The turnover frequencies (TOF), number of molecules of CO converted per surface atom of gold particles and per second, were determined from the reaction rates obtained in the kinetic regime and the dispersion of gold (surface atoms/total atoms in the particle). The dispersion of gold was calculated with the assumption that gold particles were cuboctahedral with a hexagonal face in contact with the TiO2 surface.
In Fig. 1b the activity of the most active catalyst (Au/TiO2–Ni(1)) is compared with the one of the gold catalysts supported on bare TiO2 synthesized by sol–gel and TiO2 Degussa P25. At 180 °C the nickel doped gold catalyst, Au/TiO2–Ni(1) clearly shows an increase of CO conversion in contrast to bare catalysts. It is important to note that all the nickel modified TiO2 AuNPs showed higher CO conversion than the AuNPs supported on bare TiO2 catalysts (Table 1). According to specific surface area (SSA) data show in Table 1, the method of synthesis provides SSA values up to 72 m2 g−1 for the most of the catalysts, only the catalyst Au/TiO2–Ni(10) which has a SSA of 48.5 m2 g−1 presents a negative effect. TiO2–P25 bare catalyst also show low SSA (51 m2 g−1). In Table 1 a direct relationship between SSA and %CO conversion can be noticed, meaning, the more SSA, the greater catalytic activity; therefore, when the nickel content is 10 wt% there is a low SSA and low CO conversion, 60% at 300 °C. The suitable amount of nickel incorporation on the sol that allows the doping effect seems to be less that 2.5 wt%. It is shown that the nickel ions incorporation has an important surface effect with AuNPs for enhancing the CO conversion from 100 °C to 300 °C probably due to the good dispersion of AuNPs.
Catalyst | Crystallite size (nm) | Specific area (m2 g−1) | CO conversiona (%) | Reaction ratea (mol CO per mol Au per h) (10−3) | SPRb (nm) |
---|---|---|---|---|---|
a CO conversion and reaction rate were determined at 300 °C.b Wavelength which occurs SPR (Surface Plasmon Resonance) of AuNPs. | |||||
Au/P25 | 19.7 | 51.3 | 54.9 | 1.37 | 546 |
Au/TiO2 | 16.3 | 72.7 | 44.6 | 1.12 | 546 |
Au/TiO2–Ni 1 | 13.9 | 79.0 | 75.9 | 1.90 | 518 |
Au/TiO2–Ni 2.5 | 13.3 | 78.8 | 75.3 | 1.88 | 522 |
Au/TiO2–Ni 5 | 10.9 | 76.3 | 75.0 | 1.88 | 526 |
Au/TiO2–Ni 10 | 13.7 | 48.5 | 60.2 | 1.51 | 549 |
![]() | ||
Fig. 2 CO conversion during WGSR of Au/TiO2–Ni catalyst varying Au content with in situ thermal treatment conditions. |
To understand this behavior in the WGSR and correlate with catalytic activities of these materials, their structural characterization was carried out.
XRD characterization allows the identification of the structure and crystalline phases of catalysts. The diffractogram patterns presented in Fig. 3 show that in catalyst with a low nickel content (1 and 2.5 wt%) only anatase crystalline phase is detected (JCPDS 04-002-2678) whereas for higher nickel contents (5 and 10 wt%), nickel titanate crystalline phase is observed (JCPDS 04-012-0745). It is worth to note that other peaks attributable to metallic nickel or nickel oxides are not observed, see Fig. 3.
According to JCPDS cards of anatase and nickel titanate, 04-002-2678 and 04-012-0745, respectively, anatase has a tetragonal structure and the nickel titanate is rhombohedral. This indicates that both phases can coexist.30 The observed reflections of NiTiO3 show that at amounts bigger than 2.5% wt, nickel ions started to segregate from the TiO2 framework and crystallized as a NiTiO3 phase. This could be the reason why Au/TiO2–Ni(10) catalyst had low SSA. It has been reported that titanate oxides present low SSA.31 The crystallite size of TiO2–anatase was estimated by Scherrer equation,32 the results are reported in Table 1. The more crystalline sample was the bare TiO2 P25, because of that, this sample presents a bigger crystallite size (19.7 nm).
In Fig. 4a, the results of Raman spectroscopy of Au/TiO2–Ni catalysts are shown. One can observe vibrational modes of anatase (Eg – 144 cm−1, Eg – 197 cm−1, B1g – 400 cm−1, A1g + B1g – 515 cm−1 and Eg – 640 cm−1)33,34 and nickel titanate phases for Au/TiO2–Ni catalyst with more than 2.5% of Ni loading,35,36 see Fig. 4a.
According to spectra shown in Fig. 4b we can assume that a substitutional doping occurred, because it is observed a red-shift between Au/TiO2 and Au/TiO2–Ni(2.5) samples of 1.6 cm−1 in the main vibrational mode of anatase Eg (144 cm−1) that is associated to O–Ti–O bending type vibrations, Fig. 4b and c. This shift is significant, considering the spectral resolution of the equipment of 0.1 cm−1. This shift suggests a shortening and/or rigidity of the bonding Ti–O of this vibrational mode due to increase of vacancies produced by surface oxygen, attributable to nickel doping agent incorporation, which reduces the O/Ti rate.37–39 Furthermore only the AuNPs incorporation in TiO2 sol–gel produces an overall red-shift of 1.8 cm−1 in the same vibrational mode Eg anatase indicating that AuNPs are giving electronic density to TiO2 support, see Fig. 4c.
According to UV-Vis spectra showed in Fig. 5, the surface plasmon resonance (SPR) of AuNPs can be seen on the bare materials Au/P25 and Au/TiO2 around 545 nm, which is usually located at 520 nm, but depending on the support properties this band could be blue-shifted or red-shifted.40 Analyzing the shift of the Au SPR band of TiO2–Ni catalysts, according to the plasmonic bands of the bare catalysts, the shift may be associated with their catalytic activity. The catalyst with larger blue-shift with respect to the bare Au/TiO2 from 518 to 526 nm has higher CO conversion: in agreement with the literature, a blue-shift means that the support is donating electronic density toward AuNPs.41 It means that most of AuNPs are in reduced state, Au0. Therefore, the materials that presents plasmonic band from 546 to 549 nm have lower CO conversion. This red-shift indicates that electronic density is transferred from the AuNP to the support.41 This means that AuNPs has been partially oxidized. Thereby catalytic activity of the catalysts is correlating with the SPR position in the UV-Vis spectra.42
In the case of materials with nickel content of 5 and 10 wt%, that contain nickel titanate crystalline phase an additional band appears at 450 nm, Fig. 5. This band is due to the crystal field splitting of the 3d8 band associated with Ni2+ ions which splits up into two sub-bands as charge transfer bands of Ni2+ → Ti4+.31 This result supports the assumption of the segregation on Ni2+ ion to the surface and the formation of NiTiO3 ilmenite crystalline phase for Ni content starting approximately from 5 wt%.
Reduction peaks at temperatures around 450 °C may be related to the reduction of Ni2+ to Ni0 and those at temperatures higher than 500 °C indicate the reduction of the support Ti4+ to Ti3+.45,46
A homogeneous dispersion of AuNPs on the TiO2–Ni support was observed. The particle size distribution histogram for this catalyst (Fig. 7b) showed that the average diameter of AuNPs was centered at 3.2 nm, which agrees with previous published works where AuNPs were prepared by DP method using urea as precipitant agent.26,27,47,48
Fig. 8a shows HRTEM images of Au/TiO2–Ni(1) catalyst activated ex situ in air at 300 °C. In these images it can be observed AuNPs (black spots) and crystallographic planes for the two crystalline phases present in the catalyst. The lattice distances were measured using the software Digital Micrograph. In Fig. 8a the lattice distance of 0.34 nm corresponds to the (101) plane of anatase TiO2, whereas the lattice distance of 0.28 nm can be attributed to the nickel titanate crystalline phase corresponding to the (104) plane. Thus, at low nickel contents, nickel ions start to segregate and the growth of nickel titanate on surface of TiO2 starts. For the case of the catalyst Au/TiO2–Ni(10), a higher ratio of crystals showing interplanar distance corresponding to the (104) plane of nickel titanate was observed regarding to the (101) plane of anatase TiO2 (Fig. 8b). This result is in agreement with crystalline phases identified in the characterization by XRD (Fig. 3).
Fig. 9a shows the DRIFTS spectra of Au/TiO2–Ni(1), that show the characteristic band attributed to the interaction between CO and the catalyst surface. The band at 2103 cm−1 corresponds to the vibration mode of Au0–CO which gradually decreases in intensity and shifts toward 2118 cm−1. Some authors have suggested that this shift is related to the π backdonation from Au to CO and the decrement in intensity has been attributed to the Auδ+–CO species formation.49,50 However as in Fig. 9 this band do not change in intensity as a function of the temperature, it is most surely due to molecular CO adsorbed on the TiO2 surface.51,52
Moreover it is observed an important increase in intensity of a band that appears at 2074 cm−1 (between 0 and 20 minutes) that is due to the constant reduction of Au0 to Auδ− and to the fact that the intensity of absorption of CO on Auδ− is higher than the one on Au0.53,54
Another band is detectable at 2172 cm−1. This band has been attributed to the electrostatic interaction Au3+–CO which has been reported to be very stable due to the synergism between δ and π compounds of the bonding Au–CO.49 However this band is also present during CO adsorption onto the bare sol–gel support TiO2–Ni(1), see Fig. 10, thus this band can be attributed to CO adsorption onto Ti4+ of TiO2, particularly of the anatase structure, meaning a linear adsorption of CO onto Tiδ+ cations where probably δ = 4.55–58 On the other hand, a band at 2120 cm−1 (present in catalysts with and without gold) can be attributable to gaseous CO or to framework vibration of the catalyst support when temperature increases.51,52
![]() | ||
Fig. 10 DRIFTS spectra using support TiO2–Ni(1) catalyst during CO adsorption with temperature increase from 25 to 300 °C. |
With the purpose to analyze CO adsorption–desorption onto active sites of the catalyst, an experiment under continuous flux of CO as a function of temperature from 25 to 300 °C was carried out. Fig. 9b shows DRIFTS spectra where the following issues can be noticed. (i) An increase of the intensity of the 2077 cm−1 band (Auδ−–CO) followed by a gradual shift toward 2054 cm−1. At 300 °C, this band decreases and the largest shift of 23 cm−1 occurs. This red shift can be attributed to the decrease of the CO dipole–dipole interaction because of the decreasing CO coverage of the gold particles as temperature increases.59 (ii) At 1905 cm−1 a new band appears which gradually increases with regard to temperature. According to the literature data this band is attributable to carbonyl bridges formed on cationic sites, therefore this band can be related to the bridged structure Ni2+–(CO)2.48,60 This band is not visible in Au/TiO2 previously reported by one of us.44 An increase of the intensity of this band as a function of the temperature of the catalyst is observed in Fig. 9b. This can be due to surface saturation of Au sites with CO and the requirement of CO to keep on surface searching other kind of bonding. Decrease of this band at 250 °C is due to the desorption process by the increase of temperature. According to these issues, we can confirm the participation of Ni ions in the adsorption of CO. A higher content of nickel participating in CO adsorption enhance the efficiency of WGSR for the hydrogen purification. In Fig. 10 it is observed that at temperatures higher than 250 °C a band begins to appear at 2076 cm−1. This band has been assigned to the linear adsorption of CO onto metallic nickel.61,62 This can suggest that nickel crystals growth in the TiO2 surface at high reaction temperatures.
Finally, an experiment to simulate WGSR conditions into the DRIFTS cell was done. In that case the experiment started at 100 °C which is the temperature at which CO conversion starts, see Fig. 1. Before the introduction of reactant WGSR mixture the catalyst surface was cleaned with N2. In Fig. 9c the spectra at 100, 125 and 150 °C are shown. A similar behavior in the bands increased intensity of 2074 and 1905 cm−1 (Auδ−–CO and Ni–(CO)2), respectively, is observed. However, at 300 °C these bands decrease due to the CO desorption. Moreover the 2074 cm−1 band has the largest red-shift at this temperature.
The reaction is visible in DRIFTS from 200 °C. This is notably due to increase of the band assigned to the generation of CO2 at 2400 cm−1 associated to H2 production.
At these temperatures, the maximum CO conversion is due to a remarkable redox processes in WGSR as seen in Fig. 1 and 2. At 300 °C, CO2 desorption in both nickel Ni–(CO)2 and Auδ−–CO is observed. According to Fig. 1 and DRIFTS experiments simulating WGSR, the incorporation of nickel ion in the framework of TiO2 has an important consequence in the adsorption of CO species. The WGSR was enhanced at Ni content lower than 2.5% favoring adsorption of CO and desorption of CO2 as a product. The structural characterization shows that segregation of nickel as ilmenite NiTiO3 structure starts from 2.5% of Ni and becomes a mixed oxide TiO2–NiTiO3 at 10% wt Ni. Considering the ionic radii of nickel, titanium, and oxygen of 0.69, 0.96, and 0.22 Å, respectively, some Ni2+ ions could replace some Ti4+ ions or some superficial O2− ions during the gelling step, the TiO2 framework will be stressed, which may constrain the growth of TiO2–anatase crystallites, thereby favoring the formation of NiTiO3 ilmenite structure.63 According to the cited ionic radii, it is most probable that both Ni2+ and O2− ions stressed the framework and constrain the growth of TiO2–anatase crystallites, as it was observed in XRD characterization. Then at 5% of nickel, probably nickel ions replace some Ti4+ and O2− ions start to form nickel titanate instead of TiO2. Therefore, the coexistence of anatase tetragonal structure and a nickel titanate rhombohedral one inhibits the CO conversion in WGSR.
AuNPs supported on Ni-doped TiO2 represents an effective and stable catalyst for hydrogen purification at low temperature by WGSR.
This journal is © The Royal Society of Chemistry 2014 |