Cytotoxicity and immune response of CdSe/ZnS Quantum dots towards a murine macrophage cell line
Guimiao Lin†
a,
Zhangchi Ding†b,
Rui Huc,
Xiaomei Wanga,
Qiang Chena,
Xiaomei Zhub,
Kan Liua,
Jinghua Lianga,
Fangqi Lua,
Delin Leia,
Gaixia Xu*ab and
Ken-Tye Yong*c
aThe Engineering Lab of Synthetic Biology and the Key Lab of Biomedical Engineering, School of Medicine, Shenzhen University, Shenzhen, 518060, China
bKey Laboratory of Optoelectronics Devices and Systems of Ministry of Education/Guangdong Province, College of Optoelectronic Engineering, Shenzhen University, Shenzhen 518060, P. R. China. E-mail: xugaixia@szu.edu.cn
cSchool of Electrical and Electronic Engineering, Nanyang Technological University, Singapore 639798, Singapore. E-mail: ktyong@ntu.edu.sg
First published on 6th November 2013
Abstract
The quantum dots (QDs) community has raised great concerns about the exposure and possible cytotoxicity impact of QDs to biological systems since the majority of QDs are made from heavy metals such as cadmium and lead. It is well known that macrophage cells serve as the first line of immune defense against exogenous substances, but the toxicity of QDs on macrophages remains poorly understood to date and some reported literature even have shown inconsistent results. In this study, we aimed at investigating the cytotoxicity and immune response of CdSe/ZnS QDs in mouse macrophage cells. Our confocal images showed that CdSe/ZnS QDs were captured by macrophages and were located in the cytoplasmic region. The flow cytometry assay showed that the uptake efficiency of QDs within cells was as high as 90%. More importantly, the cells treated with QDs showed a decrease in the cell viability and an enhanced gene transcription of cytokines IL-6 and TNFα was observed, but no changes were detected in the mechanism of releasing cytokines IL-6 and TNFα in the cells. These results suggest that the treatment of CdSe/ZnS QDs is indeed affecting the cell viability of the macrophages but did not cause any obvious immune response changes in the cells.
1. Introduction
Quantum dots (QDs) are nanometer-scale crystals which are made of semiconductor materials such as CdSe or CdTe.1,2 QDs have been rapidly applied in the biomedical imaging and drug delivery fields due to their unique tunable optical properties.3–5 In comparison to traditional organic fluorophores and fluorescent proteins, QDs provide several unique advantages such as bright fluorescence, broad excitation wavelengths, a narrow emission spectra, a high photostability, and a size-tunable optical property.1 However, the likelihood of QD exposure from research institutions and product industries resulting in toxicity in vitro and in vivo is much higher as time progresses because of their wide range of applications. Thus, serious concerns have been raised about the employment of QDs for biomedical applications6,7 since the understanding of QD toxicity is still in its infancy stage.Recent studies have yielded some useful information about the cytotoxicity of QDs and their related mechanisms.8 To date, a large amount of studies have focused on the systematic cytotoxicity assessment of QDs in terms of their chemical composition, size, shape and surface charge.8–10 However, the immunological effects and related mechanisms of QDs on various biological systems still remain unclear due to the complexity process in investigating the model in detail. In our former studies, we have shown that QDs mainly accumulate in the spleen which is an important peripheral immune organ and they are abundant with immune cells.11 Macrophages are professional antigen presenting cells (APCs) which are at the forefront of the immune system and serve as important bridges for connecting innate immunity and adaptive immunity.12,13 They are located in the skin, lungs and the body cavities where they will capture foreign substances and further process them as antigenic molecules whereby alarming other immune cells to trigger an immune response within the system.12 After the engulfment process takes place, macrophages usually become mature as active antigen presenting cells and release cytokines and chemokines to attract neutrophils and other inflammatory cells to the invaded sites.12–14 To date, no adequate toxicological data of macrophages pertaining QDs are available in the literature.
In this study, we aimed to investigate the cytotoxicity and immune response of carboxyl-terminated CdSe/ZnS QDs in mouse macrophage cells. Basically, we exposed a mouse macrophage cell line (Raw264.7) to a CdSe/ZnS QDs suspension and studied the QDs uptake, cell viability and cytokine profile of the treated cells. Our results showed that QDs were taken up efficiently by the macrophage cells and higher doses of QDs were cytotoxic to the cell viability. However, no obvious immune response was observed during this process, which suggests that lower doses of CdSe/ZnS QDs were non-cytotoxic and may be used as a guideline for choosing the initial dose of QDs for in vivo studies.
2. Materials and methods
2.1 Characterization of QDs
ZnS-coated CdSe QDs (Q21321MP) were purchased from Invitrogen Company. The hydrodynamic size distribution of the QDs was measured by a dynamic light scattering (DLS) machine (Zetasizer Nano ZS, Malvern, UK). The fluorescence spectra were obtained by a spectrophotometer (F-4600, Hitachi, Japan).2.2 Cell culture
Mouse Raw264.7 macrophage cells were obtained from ATCC and maintained in Dulbecco's Modified Eagle's Medium (DMEM, Hyclone), supplemented with 10% fetal bovine serum (FBS, Hyclone), 100 μg mL−1 penicillin (Ameresco) and 100 μg mL−1 streptomycin (Ameresco). The cells were cultured at 37 °C in a humidified atmosphere with 5% CO2.2.3 Confocal imaging
The Raw264.7 cells were treated with QDs of 1.25 nM or 2.5 nM. At different time points, the supernant was removed, and the cells were washed thrice with phosphate-buffered saline (PBS) and fixed with 4% formaldehyde (Sigma) for 10 minutes. Before imaging, the cells were treated with 0.1 mg mL−1 DAPI (Sigma) for 10 minutes for the staining of the nuclei. The cells were washed with PBS twice and then cell imaging was carried out using a laser scanning confocal microscope (FV10i, Olympus, Japan).2.4 Flow cytometry
For the flow cytometry experiments, cells treated with QDs for 2 hours were washed twice with PBS and harvested by trypsinization. The QDs also served as the luminescent marker to determine the uptake efficiency quantitatively. The samples were analyzed using a FACS Calibur flow cytometer (Becton Dickinson, USA).2.5 Gene expression analysis
The Raw264.7 cells were treated with QDs for 6 hours, and the total RNA was extracted from the cells using TRIzol reagent (Invitrogen) and quantitated by a spectrophotometer (Nano-Drop ND-1000). The total RNA (2 μg) was reverse transcribed to cDNA using the reverse transcriptase kit from Promega according to the manufacturer's instructions. Real-time quantitative PCR detection was performed to determine the cytokines relative mRNA expression levels normalized to the expression of β-actin using a fluorescent quantitative PCR machine (Bio-Rad, USA). The gene amplification was performed at the conditions according the SYBR kit (Promega, USA). The data were presented using the ΔΔCt quantitative relative analysis of the differences in the level of gene transcription. The primer sequences for real-time PCR were as follows:Mouse TNF-α Forward: 5-TCCGCGACGTGGAACTG-3, Reverse: 5-ACCGCCTGGAGTTCTGGAA-3;
Mouse IL-6 Forward: 5-ACAACCACGGCCTTCCCTACTT-3, Reverse:5-CACGATTTCCCAGAGAACATGTG-3;
Mouse β-actin Forward: 5-AGAGGGAAATCGTGCGTGAC-3, Reverse, 5-CAATAGTGATGACCTGGCCGT-3.
2.6 Cell viability
Cell viability was measured by an MTT (3-(4,5-dimethylthiazol-2-yl)-2,5-diphenyltetrazolium bromide) (Sigma) assay. Cells were seeded in a 96-well plate at a density of 5 × 10³ cells per well and incubated with QDs for 24 or 48 hours. 20 μL of 5 mg mL−1 MTT in PBS was added and the cells were incubated for 4 hours. 150 μL of 100% dimethylsulfoxide (DMSO, Sigma) was then added to solubilize the precipitate with 5 minutes gentle shaking. Absorbance was measured with a microplate reader (Biotek, Epoch, USA) at a wavelength of 490 nm. The cell viability was obtained by normalizing the absorbance of the sample well against that from the control well and expressed as a percentage, assigning the viability of non-treated cells as 100%.2.7 ELISA assay
The levels of cytokines produced by the Raw264.7 macrophage cells (7000 cell per well) in culture supernatants were analyzed according to the manufacturers' instructions using ELISA kits for mouse TNF-α and mouse IL-6 (Ebioscience, USA). Briefly, a 96-well polystyrene microplate was coated with capture antibody and washed with PBST buffer (1× PBS, 0.05%Tween20) 3 times. The culture supernant from the Raw264.7 cells was added after dilution in PBS and incubated overnight at 4 °C. For detection, goat anti-mouse immunoglobulin conjugated with horseradish peroxidase was used. The wells were then washed 6 times with PBST. The substrate solutions were added and incubated for 5 minutes with constant shaking. The reaction was then stopped with a stop solution, and the plates were read at 450 nm. Serial dilutions of known concentrations of TNF-α and mouse IL-6 were used to generate a standard curve.2.8 Statistical analysis
All data were presented as mean ± SD. The results were compared by analysis of variance (ANOVA). All statistical calculations were performed with the SPSS 11.0 software package. A p value less than 0.05 was regarded as a statistically significant difference.3. Results
3.1 Characterization of QDs
The average hydrodynamic diameter of QDs was about 8 nm (Fig. 1A), which is consistent with the data provided by Invitrogen. The fluorescence spectra shows that the emission peak for the QDs is positioned at 655 nm (Fig. 1B). This data indicates that the distribution of the nanocrystals is highly monodispersed and they have excellent colloidal stability. No aggregation or precipitation was observed even after a few weeks of storage. | ||
| Fig. 1 The characterization of the CdSe/ZnS QDs. (A) The hydrodynamic diameter of the aqueous dispersive CdSe/ZnS QDs measured by DLS. (B) The absorption and emission spectra of the CdSe/ZnS QDs. | ||
3.2 The uptake of QDs by mouse macrophages
Fig. 2 shows the confocal images of Raw264.7 macrophage cells treated with QDs at different time points and the signals of the QDs are displayed in a red pseudocolor. After 2 hours of nanocrystals treatment with the dosage of 1.25 nM and 2.5 nM, the signals of the QDs can be detected in the cells. A confocal 3-D sectioning in the vertical direction further confirmed that the QDs were inhomogeneously internalized in the cytoplasm (data not shown). In comparison, no obvious fluorescent signal was detected from the cells treated with QDs at the same dosage for 1 hour. These results indicate that the in vitro uptake of the carboxylated QDs is time dependent. A similar feature was observed even if the cells were incubated with QDs for a longer period of time. | ||
| Fig. 2 The laser scanning confocal microscopic images of Raw264.7 cells treated with CdSe/ZnS QDs at indicated time points. The cell nucleus was stained with DAPI (pseudo-colored in blue) and signals from the QDs are assigned in red. Scale bar: 80 μm. | ||
To further quantitatively evaluate the uptake efficiency of QDs by Raw264.7 macrophage cells, flow cytometry analysis was performed. Fig. 3A shows the representative plots of the fluorescence intensity in Raw264.7 macrophage cells treated with QDs at the dosage of 1.25 nM and 2.5 nM for 2 hours. Cells treated with QDs (721.33 ± 121.72 for 1.25 nM and 830.37 ± 42.16% for 2.5 nM) showed strong fluorescent signals (Fig. 3C), which indicated the abundant accumulation of the QDs within the cells. The fraction of cells with strong fluorescent signals for the group treated with QDs was counted to be over 90% (96.05 ± 3.38% for 1.25 nM and 93.37 ± 5.19% for 2.5 nM) in our experiments (Fig. 3B). This portion represented as a percentage directly correlates well to the uptake efficiency of the QDs by Raw264.7 macrophage cells, and strongly suggests that the negatively-charged QDs can enter the membrane of the macrophage cells efficiently.
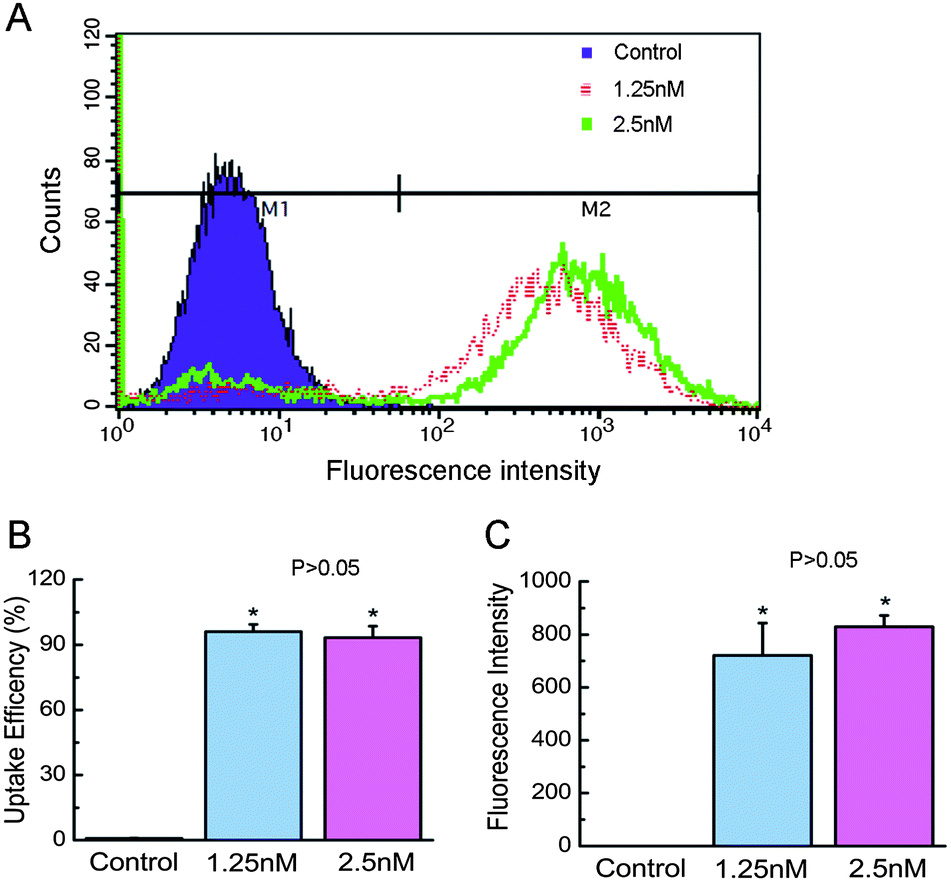 | ||
| Fig. 3 The uptake efficiency of the Raw264.7 cells treated with the CdSe/ZnS QDs for 2 hours determined by flow cytometry analysis. (A) Representative pictures of the flow cytometry analysis. (B) The uptake efficiency from the experiments shown in (A). The values are means ± SD, n = 3; *, P < 0.001 vs. control. (C) The average fluorescence intensity from the experiments shown in (A). The values are means ± SD, n = 3; *, P < 0.001 vs. control. | ||
3.3 The cytotoxicity of the QDs on mouse macrophage cells
In order to evaluate the toxicity of the QDs on macrophage cells in vitro, an MTT cell viability assay was conducted on Raw264.7 cells treated with QDs for 24 and 48 hours. The untreated Raw264.7 cells served as a reference (i.e. 100% cell viability). The results from the MTT assay showed that the treatment of the Raw264.7 cells with a low dosage of QDs did not cause any significant cytotoxicity within 24 or 48 hours (Fig. 4). However, it is worth mentioning that the cell viability for the cells treated with 2.5 nM QDs was obviously much lower than the untreated ones or the ones treated with 1.25 nM QDs. These results revealed that the dosage of 2.5 nM ODs will significantly inhibit the cell viability of the macrophage cells, but a lower concentration of 1.25 nM showed no considerable cytotoxic effects to the cells. | ||
| Fig. 4 The cytotoxicity study of the CdSe/ZnS QDs. The Raw264.7 cells were treated with 1.25 nM or 2.5 nM QDs for 24 and 48 hours. The values are means ± SD, n = 5; *, P < 0.05 vs. Control; **, P < 0.01 vs. control; Δ, P < 0.05 vs. 1.25 nM QDs. | ||
3.4 The effect of the QDs on the gene transcription of cytokines in macrophage cells
Macrophages are important immune cells which play a key role in the body's nonspecific immune defense against exogenous substances such as pathogenic microorganisms. In the immune response such as inflammation, macrophages can be activated and secrete some cytokines, including interferon, interleukin, chemokines and tumor necrosis factor (TNF). In order to evaluate the immunological activity of the QDs on macrophage cells, the QDs were incubated with macrophage cells for 6 hours and the mRNA levels of the genes IL-2, IL-6, IL-12 and TNF-α were determined by real-time PCR technique. Our results showed that the cells treated with 1.25 nM or 2.5 nM QDs demonstrated no significant difference in the mRNA levels of IL-2 and IL-12 when compared to the untreated cells (data not shown). However, remarkably enhanced mRNA levels of IL-6 and TNF-α were observed from the cells incubated with 1.25 nM QDs (P < 0.05) and 2.5 nM QDs (P < 0.01) when compared to the untreated cells. In addition, the cells treated with 2.5 nM QDs exhibited higher mRNA levels of IL-6 and TNF-α than the cells treated with 1.25 nM QDs (P < 0.05). To further evaluate the impact of the immune response from the QDs, the gene expression of IL-6 and TNF-α in cells treated with CpG-ODN that has been proved to be able to activate the macrophages was also performed. The cells treated with CpG-ODN showed remarkably higher gene expression levels of IL-6 (858.31 ± 57.48%) and TNF-α (34685.02 ± 81.38%) than the QDs-treated cells (P < 0.0001). These results clearly suggest that the CdSe/ZnS QDs have the ability to promote the transcription of IL-6 and TNF-α, however this ability is far below the immune stimulus threshold of CpG-ODN (Fig. 5). | ||
| Fig. 5 The relative gene expression levels of IL-6 and TNF-α in Raw264.7 cells after treatment with CdSe/ZnS QDs were detected by RT-PCR. The values are means ± SD, n = 4; *, P < 0.05 vs. control; **, P < 0.01 vs. control; Δ, P < 0.05 vs. 1.25 nM QDs. | ||
3.5 Cytokine release in vitro in response to QDs
Since our data showed that the treatment of QDs obviously promoted the transcription of IL-6 and TNF-α, we then carried out an ELISA assay to determine the levels of the IL-6 and TNF-α proteins in the culture supernant released by the macrophages treated with the QDs. Surprisingly, the cells treated with 1.25 nM or 2.5 nM QDs showed no significant difference in the release of IL-6 and TNF-α when compared with untreated cells (P > 0.05). In contrast, the macrophages cultured with CpG-ODN produced significant amounts of both cytokines, as compared with the untreated cells (P < 0.0001) or QDs-treated cells (P < 0.0001). The results presented here indicated that the uptake of QDs promotes the transcription of IL-6 and TNF-α, but does not result in any obvious immune response from the macrophage cells over a time period of 24 hours. This indicates that low doses of QDs (<1.25 nM) are relatively safe to be used for in vitro imaging and drug delivery studies (Fig. 6). | ||
| Fig. 6 The in vitro cytokine release in response to the CdSe/ZnS QDs. The cells were treated with QDs for 24 hours and the production of IL-6 and TNF-α in the culture supernatants was measured using an ELISA assay. The values are means ± SD, n = 4; *, P < 0.0001 vs. control. | ||
4. Discussion
To date, QDs have been widely used in applications ranging from medicine to material science due to their unique tunable optical properties.15–18 However, with the continuous growth of QD research and applications, it is of paramount importance for us to understand their potential toxicity in vitro and in vivo.7 To understand some aspects of this issue, the present study investigated the effects of the commercially available and frequently used carboxyl CdSe/ZnS QDs on the viability and function of the macrophages.Here, our results showed that carboxylated CdSe/ZnS QDs entered the cell membrane successfully, which is consistent with the results reported by Aaron et al.19 In addition, our data showed that a treatment of CdSe/ZnS QDs at the dose of 2.5 nM inhibited the viability of the macrophages significantly, which was in line with the studies that have revealed similar cytotoxicity features of some cadmium-based QDs towards cell lines such as human keratinocytes HaCaT cells.20,21 In fact, the cytotoxicity of the QDs is caused by several factors.22–25 Derfus et al. showed that the cytotoxicity of the CdSe/ZnS QDs was associated with the release of cadmium ions from the surface of the particles.26 Kirchner et al. showed that in addition to the release of cadmium ions, their surface functional groups (e.g., NH2 and COOH), and in particular their colloidal instability which resulted in the formation of aggregates in the medium, played an important role for the cytotoxic effects.22 Parak et al. further demonstrated that the precipitation of the QDs on the cell surface could also impair the cells.27 All these studies have pointed out that as long as the QD surface is not carefully passivated, QD degradation will occur and this causes the leakage of cadmium ions and surfactants from the particles to the local biological environment.
In addition, we observed the potential activation of the macrophages caused by the CdSe/ZnS QDs. Our data showed that the exposure of macrophage cells to the CdSe/ZnS QDs promoted the gene transcription of proinflammatory factors IL-6 and TNF-α, but no detectable changes were observed in the release of these two cytokines. However, a different trend was discovered in the mRNA and protein levels. This may be a result of other influencing factors such as posttranscriptional mechanisms that control the protein translation rate, the half-lives of proteins or mRNAs and the intracellular location of proteins. For instance, Gygi et al. have demonstrated that the correlation between the mRNA and protein levels is complicated, and the levels of protein are not solely dependent on the gene transcription, rather it involves other posttranscriptional factors.28
The secretion of IL-6 and TNF-α is an indicator of macrophage activation. In this study, no elevated release of these two cytokines was observed. These data indicated that no obvious immune response was involved after the cells were exposed to QDs. However, many studies have shown that other engineered nanomaterials such as polymeric nanoparticles and nanoliposomes did cause immune responses when they are interacting with the cells.29–33 In general, the effects of nanomaterials on the immune system can be determined by several factors such as concentration, surface chemistry and the colloidal stability of the nanocrystals. For example, high concentrations of pristine and oxidized multi-wall nanotubes were shown to generate an immunological effect on human peripheral blood lymphocytes.34 In addition, some data showed that cationic (positively-charged) particles are more likely to induce inflammatory reactions than anionic (negatively charged) and neutral particles.29,35 Dumortier et al. demonstrated that functionalized carbon nanotubes dispersion did not affect the functionality of primary immune cells in vitro.36 In contrast, Kazuto et al. showed that the production of TNF-α by the human monocytic cell line THP-1 and total mouse spleen cells was induced upon incubating them with nonfunctionalized single-walled carbon manotubes.37 Based on these studies, we propose that as long as low concentrations (<1.25 nM) and carboxylated CdSe/ZnS QDs are used for in vitro studies, minimum immune responses will be observed. However, further in vivo study is needed to confirm that the CdSe/ZnS QDs will not cause any immune response in the animal models.
5. Conclusion
In summary, we report the effects of CdSe/ZnS QDs on the potential activation of macrophage cells. The results revealed that high doses of QDs caused the cell viability to decrease but it did not result in any obvious immune responses whereby suggesting that the CdSe/ZnS QDs can be served as useful optical probes for biological and therapeutic applications without affecting the immune system when an appropriate concentration and surface chemistry are optimized and used.Conflict of interest
No conflict of interest exits in the submission of this manuscript and none declared.Acknowledgements
This work was supported by the grants from National Natural Science Foundation of China (NSFC) (81301318 & 61107017), the Science and Technology Project of Guangdong (2011B031800351), the Technological and Scientific Innovation Project of Guangdong Educational Commission (2012KJCX0094), Shenzhen Basic Research Project (JCYJ20120613170218654), and Natural Science Foundation of SZU (80100035901).References
- M. J. Bruchez, M. Moronne, P. Gin, S. Weiss and A. P. Alivisatos, Science, 1998, 281, 2013–2016 CrossRef CAS.
- S. Veeranarayanan, A. C. Poulose, M. S. Mohamed, Y. Nagaoka, S. Iwai, Y. Nakagame, S. Kashiwada, Y. Yoshida, T. Maekawa and D. S. Kumar, Int. J. Nanomed., 2012, 7, 3769–3786 CAS.
- J. M. Feugang, R. C. Youngblood, J. M. Greene, A. S. Fahad, W. A. Monroe, S. T. Willard and P. L. Ryan, J. Nanobiotechnol., 2012, 10, 45 CrossRef CAS PubMed.
- Y. P. Zhang, P. Sun, X. R. Zhang, W. L. Yang and C. S. Si, Nanoscale Res. Lett., 2013, 8, 294 CrossRef PubMed.
- T. Jamieson, R. Bakhshi, D. Petrova, R. Pocock, M. Imani and A. M. Seifalian, Biomaterials, 2007, 28, 4717–4732 CrossRef CAS PubMed.
- M. Bottrill and M. Green, Chem. Commun., 2011, 47, 7039–7050 RSC.
- T. S. Hauck, R. E. Anderson, H. C. Fischer, S. Newbigging and W. C. Chan, Small, 2010, 6, 138–144 CrossRef CAS PubMed.
- R. Hardman, A toxicologic review of quantum dots, Environ. Health Perspect., 2006, 114, 165–172 CrossRef.
- Y. Tang, S. Han, H. Liu, X. Chen, L. Huang, X. Li and J. Zhang, Biomaterials, 2013, 34, 8741–8755 CrossRef CAS PubMed.
- J. Lovric, S. J. Cho, F. M. Winnik and D. Maysinger, Chem. Biol., 2005, 12, 1227–1234 CrossRef CAS PubMed.
- L. Ye, K.-T. Yong, L. Liu, I. Roy, R. Hu, J. Zhu, H. Cai, W.-C. Law, J. Liu, K. Wang, J. Liu, Y. Liu, Y. Hu, X. Zhang, M. T. Swihart and P. N. Prasad, Nat. Nanotechnol., 2012, 7, 453–458 CrossRef CAS PubMed.
- D. M. Mosser and J. P. Edwards, Nat. Rev. Immunol., 2008, 8, 958–969 CrossRef CAS PubMed.
- Z. Q. Yan and G. K. Hansson, Immunol. Rev., 2007, 219, 187–203 CrossRef CAS PubMed.
- G. J. Bancroft, J. P. Kelly, P. M. Kaye, V. McDonald and C. E. Cross, Immunol. Lett., 1994, 43, 67–70 CrossRef CAS.
- S. Thiollet, C. Bessant and S. L. Morgan, Anal. Biochem., 2011, 414, 23–30 CrossRef CAS PubMed.
- Y. Lin, L. Zhang, W. Yao, H. Qian, D. Ding, W. Wu and X. Jiang, ACS Appl. Mater. Interfaces, 2011, 3, 995–1002 CAS.
- E. Giovanelli, E. Muro, G. Sitbon, M. Hanafi, T. Pons, B. Dubertret and N. Lequeux, Langmuir, 2012, 28, 15177–15184 CrossRef CAS PubMed.
- S. H. Hsu, C. J. Wen, S. A. Al-Suwayeh, Y. J. Huang and J. Y. Fang, Nanomedicine, 2013, 8, 1253–1269 CrossRef CAS PubMed.
- J. S. Aaron, A. C. Greene, P. G. Kotula, G. D. Bachand and J. A. Timlin, Small, 2011, 7, 334–341 CrossRef CAS PubMed.
- N. Chen, Y. He, Y. Y. Su, X. M. Li, Q. Huang, H. F. Wang, X. Z. Zhang, R. Z. Tai and C. H. Fan, Biomaterials, 2012, 33, 1238–1244 CrossRef CAS PubMed.
- K. Pathakoti, H. M. Hwang, H. Xu, Z. P. Aguilar and A. Wang, J. Environ. Sci., 2013, 25, 163–171 CrossRef CAS.
- C. Kirchner, T. Liedl, S. Kudera, T. Pellegrino, A. Muñoz Javier, H. E. Gaub, S. Stölzle, N. Fertig and W. J. Parak, Nano Lett., 2005, 5, 331–338 CrossRef CAS PubMed.
- N. Lewinski, V. Colvin and R. Drezek, Small, 2008, 4, 26–49 CrossRef CAS PubMed.
- B. I. Ipe, M. Lehnig and C. M. Niemeyer, Small, 2005, 1, 706–709 CrossRef CAS PubMed.
- J. M. Tsay, M. Trzoss, L. Shi, X. Kong, M. Selke, M. E. Jung and S. Weiss, J. Am. Chem. Soc., 2007, 129, 6865–6871 CrossRef CAS PubMed.
- A. M. Derfus, W. C. W. Chan and S. N. Bhatia, Nano Lett., 2004, 4, 11–18 CrossRef CAS.
- W. J. Parak and T. Pellegrino, Nanotechnology, 2005, 16, R9–R25 CrossRef CAS PubMed.
- S. P. Gygi, Y. Rochon, B. R. Franza and R. Aebersold, Mol. Cell. Biol., 1999, 19, 1720–1730 CAS.
- M. A. Dobrovolskaia and S. E. McNeil, Nat. Nanotechnol., 2007, 2, 469–478 CrossRef CAS PubMed.
- B. S. Zolnik, A. Gonzalez-Fernandez, N. Sadrieh and M. A. Dobrovolskaia, Endocrinology, 2010, 151, 458–465 CrossRef CAS PubMed.
- P. D. Dwivedi, A. Tripathi, K. M. Ansari, R. Shanker and M. Das, J. Biomed. Nanotechnol., 2011, 7, 193–194 CrossRef CAS PubMed.
- M. Plebanski and S. D. Xiang, Methods, 2013, 60, 225 CrossRef PubMed.
- J. Palomaki, P. Karisola, L. Pylkkanen, K. Savolainen and H. Alenius, Toxicology, 2010, 267, 125–131 CrossRef CAS PubMed.
- B. Massimo, B. Shane, N. Konstantina, B. Nunzio, B. Stefano, M. Andrea, B. Antonio and M. Tomas, Toxicol. Lett., 2006, 160, 121–126 CrossRef PubMed.
- Y. Tan, S. Li, B. R. Pitt and L. Huang, Hum. Gene Ther., 1999, 10, 2153–2161 CrossRef CAS PubMed.
- H. Dumortier, S. Lacotte, G. Pastorin, R. Marega, W. Wu, D. Bonifazi, J.-P. Briand, M. Prato, S. Muller and A. Bianco, Nano Lett., 2006, 6, 1522–1528 CrossRef CAS PubMed.
- K. Kazuto, S. Yoshinori, Y. Motoaki, F. Bunshi, W. Fumio, T. Kazuyuki and S. Ken-ichiro, J. Biomed. Nanotechnol., 2005, 1, 359–364 CrossRef PubMed.
Footnote |
| † These authors contributed equally to this work. |
| This journal is © The Royal Society of Chemistry 2014 |