Electric cell–substrate impedance sensing technique to monitor cellular behaviours of cancer cells

Rangadhar Pradhan*, Shashi Rajput, Mahitosh Mandal, Analava Mitra and Soumen Das
School of Medical Science and Technology, Indian Institute of Technology, Kharagpur 721302, India. E-mail: rangadhar@iitkgp.ac.in; Fax: +91 3222282221; Tel: +91 3222281228

Received 13th September 2013 , Accepted 2nd December 2013

First published on 2nd December 2013


Abstract

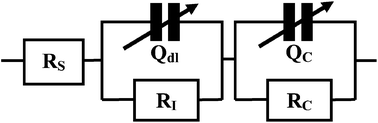
The present work reports the cellular electrical behaviour of the MDA-MB-231 breast cancer cell line treated with the anticancer drug ZD6474, using impedance sensing devices. Microelectrode-based devices with four different electrode geometries are fabricated by microfabrication technology. Real-time impedance monitoring data show high impedance variation during the initial 5 hours, revealing rapid spreading of cells over electrode surfaces. It is further established that impedance variation is mostly controlled by cells covering the electrode surface area, and thus, an enhanced effect is seen with electrode devices with a smaller geometry. Real-time impedimetric cytotoxicity data reveal that cell death and detachment starts at 21 h after inoculation of cells in the devices. The frequency response characteristics of drug-treated cells are studied to evaluate the cytotoxic effect of ZD6474. Compared to the control, a significant variation in the magnitude of the measured impedance data is observed for drug-treated samples above a 5 μM dose, indicating cell growth suppression and cell death. Finally, an empirical relationship between cell impedance and drug dose is established from impedance data, which shows that they are negatively correlated.


Introduction

Cell adhesion and cell spreading are essential cellular processes which help to build tissue, strengthen the immune system, and monitor the signal transduction pathways of a cell. Thus, the study of cell adhesion and spreading helps to elucidate several biological phenomena such as cell division, cell differentiation, cell migration and cell mortality, with respect to both normal and cancer cells. Cell attachment is often studied using microscopic as well as radiation label techniques.1 However, these techniques do not provide dynamic as well as qualitative information about cell adhesion. To study cell mortality after exposure to a drug, several conventional in vitro cell-based assays are available, which include biochemical methods (the 3-(4,5-dimethylthiazol-2-yl)-2,5-diphenyltetrazolium bromide test, MTT), neutral red uptake (NRU), ATP measurement or growth assays such as measurement of the colony forming efficiency (CFE).2–4 The mechanism involved in all of the above methods is to calculate the drug concentration giving 50% inhibition (the IC50) after a fixed exposure time. However, most of these assays do not give information about cell–drug interactions. Moreover, these assays are time- and labor-consuming, and end with the death of the cells.

Therefore, at this advanced stage of tissue culture research, we need label-free detection methods for cellular behaviours. Monitoring the bioimpedance properties of cells using electric cell–substrate impedance sensing (ECIS) is one non-labelling technique used to understand cell functionality by investigating cellular electrical properties when subjected to an electric field. ECIS is now an established, non-invasive electrochemical technique that has been successfully used to monitor the adhesion, growth and differentiation of cells in real time,5–10 cell migration,11–14 morphological changes during apoptosis,15,16 single cell analysis by microfluidic impedance cytometry,17 and the toxic effects of drugs on cellular behaviour.18–22

ZD6474 is a novel heteroaromatic-substituted anilinoquinazoline (Fig. S1), which inhibits two key pathways in tumour growth by targeting tumour growth indirectly, via inhibition of VEGF-dependent tumour angiogenesis and VEGF-dependent endothelial cell survival,23–26 and also, by targeting tumour growth directly, via inhibition of EGFR-dependent tumour cell proliferation and survival.27 However, all reported studies regarding the cytotoxicity of ZD6474 include conventional methods. In this paper, the real-time monitoring of cell adhesion and proliferation is carried out by culturing MDA-MB-231 cells. In addition, the effect of different doses of ZD6474 is measured by recording changes in cellular viability and/or functionality, along with electrical impedance under the influence of an electric field on ECIS devices. The electrical properties of cells are mainly explored in this study to understand the quantitative relationship between drug dose and impedance. In this experiment, the MTT assay and microscopic images are used as standard methods for comparing the impedance data obtained from a cancer cell line treated with different doses of ZD6474.

Materials and methods

Materials and reagents

Pyrex glass wafers were purchased from Semiconductor Wafer Inc., Taiwan. Polydimethylsiloxane (PDMS, Sylgard 184) was supplied by Dow Corning, Inc., Midland. SU8 was purchased from MicroChem, Newton. DMEM–F12 medium, fetal bovine serum, the trypsin–EDTA solution, penicillin, and streptomycin were purchased from Himedia, India. All other required reagents were supplied by Sigma-Aldrich, India.

Cell culture

MDA-MB-231 cells were purchased from the American Type Culture Collection (ATCC, Manassas, VA). Cells were cultured on electrode surfaces using DMEM–F12 medium supplemented with 10% heat-inactivated fetal bovine serum, 2 mmol L−1 L-glutamine, 100 IU mL−1 penicillin, 100 μg mL−1 streptomycin, 20 ng mL−1 epidermal growth factor, 500 ng mL−1 hydrocortisone, 100 ng mL−1 cholera toxin, and 10 μg mL−1 bovine insulin at 37 °C in a humidified atmosphere with 5% CO2. Cell suspensions were prepared by trypsinizing the cells with a 0.05% trypsin–EDTA solution.

MTT assay and cell viability count

The viability of MDA-MB-231 breast cancer cells was determined by the MTT dye-reduction assay. Cell suspensions were dispensed in quadruplicate into 96-well tissue culture plates at an optimized concentration of 104 cells per well in complete medium. After 24 h of treatment with various concentrations of ZD6474, ranging from 10 nM to 50 μM, along with 0.1% DMSO as a control, cell viability was measured at 540 nm using a micro-plate spectrophotometer (Bio-RAD Benchmark Plus).

Imaging

Phase contrast images of the MDA-MB-231 cells during culture on the ECIS device for 0 h to 6 h were taken using a Carl Zeiss Observer Z1 microscope with a CCD camera attached, using the monochromatic phase contrast mode. Moreover, the same observation was made for the drug-treated cells after 24 h of incubation.

Impedance measurements

Impedimetric measurements were performed with an actuation voltage of 10 mV using the computer-controlled electrochemical work station SP 150 (Bio-Logic, France). The general set-up for impedance measurement is described in Fig. S2. Voltage was applied on the working electrode and the potential changes of the working electrode (WE) were measured independently of charges that may have occurred at the counter electrode (CE). The real-time monitoring of cell adhesion and cytotoxicity was performed by measuring the impedance at 10 kHz in a time lapse of 10 minutes for 0 to 24 h. In this case, the normalised impedance (NI) value has been calculated using eqn (1) to eliminate the effect of medium. Cell growth and proliferation causes rapid changes in electrode impedance which are difficult to see when Z(f) is plotted on a logarithmic scale. To more clearly reveal the impedance change due to cell growth, the normalized impedance was plotted whereby its peak magnitude reflected the completion of the spreading stage.28
 
NI = (ZCellZNo cell)ZNo cell−1 (1)
where ZCell and ZNo cell are the impedance of the system with and without cells in culture media of the same volume.

The frequency responses of the cytotoxic effects were studied by measuring the impedance of MDA-MB-231 cells treated with different doses of ZD6474 within a frequency range from 100 Hz to 1 MHz with 51 points on a logarithmic scale, after 24 h of drug treatment.

Equivalent circuit simulation

The measured impedance data obtained from the experiment were imported to ZsimpWin (Version 3.10) for fitting purposes. The equivalent circuit was taken from the literature29 and is shown in Fig. 1.
image file: c3ra45090b-f1.tif
Fig. 1 The equivalent circuit of ECIS devices (RS represents the solution resistance. Qdl represents the interface and coating capacitance. RI represents the resistance due to charge transfer in the medium, while QC and RC are the capacitance and resistance of the cultured cell line on the electrodes).

Sensitivity of devices

The sensitivity of the ECIS devices was calculated using eqn (2), which was taken from the literature: 30
 
Sensitivity (f) = (|ZCell (f)| − |ZNo cell (f)|)Qcell−1 (2)
where f is the sensing frequency and Qcell is the maximum cell density (about 106 cells per cm2).

Experimental procedures

Before cell seeding, the ECIS device was sterilized with 75% ethanol for 15 min, dried with nitrogen, and irradiated with ultraviolet radiation for 15 min. DMEM–F12 (1 mL) was then added to the ECIS device and incubated at 37 °C for 20 min to record the background impedance value (ZNo cell). A cell suspension of MDA-MB-231 (1 mL, 1 × 10⁶ cells) was added into each cell culture chamber. After a 10-min equilibration, the device was placed into the incubator for cell culture and impedance sensing. Different doses of ZD6474 (0, 5, 10 and 15 μM) were then added into the well of the ECIS devices after 30 min of inoculation, to study the cytotoxic effects of the drug.

Correlation between drug dose and impedance

A quantitative relationship is required to understand the correlation between impedance and drug dose. For this, the magnitude of impedance and phase angle data were plotted with independent variables such as drug dose and working electrode area, to establish an empirical relationship by using LAB Fit curve fitting software.

Results and discussion

Design of the ECIS devices

The methods used to design and fabricate the ECIS devices were taken from the literature. Mishra et al.31 used a smaller WE area than that of the reference electrode (RE) to minimize the influence of the impedance of the electrolyte. Brett and Brett32 showed that the ratio of the surface area of the CE to that of the WE should be greater than 10 in order to support the current generated at the working electrode. In the present study, the surface area ratio of the WE to the RE and the WE to the CE was fixed at 0.01. To avoid cross-contamination, the CE and RE were placed at a distance of 100 μm from the WE position in all the designs.33,34 From the active electrode region, each electrode was connected to a large contact pad by a 250 μm-wide metal interconnection line. To eliminate the artifacts in impedance measurement due to the large passive area of interconnecting metal, a coating layer was provided by using an SU8 polymer with a thickness of 50 μm. In the present study, four different configurations of ECIS devices were designed, with varying WE, RE, and CE dimensions, as given in Table 1.
Table 1 Dimensions of the different designs of the three-electrode-based ECIS devices
Device WE area (mm2) RE and CE area (mm2) Lead width (mm) Lead length (mm) WE/RE and WE/CE SU8 thickness (mm)
Design 1 0.05 × 0.05 0.5 × 0.5 0.25 25 0.01 0.05
Design 2 0.1 × 0.1 1 × 1 0.25 25 0.01 0.05
Design 3 0.15 × 0.15 1.5 × 1.5 0.25 25 0.01 0.05
Design 4 0.2 × 0.2 2 × 2 0.25 25 0.01 0.05


Fabrication of the ECIS devices

The manufacture of the impedance sensing device by the microfabrication technique has been described previously35 and is shown in Fig. 2. The ECIS devices were fabricated on Pyrex wafers using thin film deposition and photolithographic techniques, and the fabrication process flow is described in Fig. S3. Initially, the wafers were cleaned and thin layers of chromium (Cr) and gold (Au) were deposited by the thermal evaporation technique. Subsequently, the electrode patterns and the contact pads were lithographically defined on the deposited metal film. Another photosensitive polymer (SU8) layer was then spin coated and lithographically patterned to obtain a polymer passivation coating over the interconnections. The patterning of the SU8 layer was performed in such a way that the active metal electrode areas and contact pads were kept exposed to make contact with the electrolyte and to apply electrical signals, respectively. The SU8 layer was hard-baked to impart stability and inertness to the polymer during its exposure to the electrolytic solution. The individual device was diced and fixed on a PCB board following the attachment of a cloning cylinder around the three-electrode system, which served as an electrolyte reservoir for culture of MDA-MB-231 cells.
image file: c3ra45090b-f2.tif
Fig. 2 Photograph of the fabricated ECIS devices, along with an enlarged view.

Real-time monitoring of the attachment and spreading of MDA-MB-231 cells

Cell adhesion to the extracellular matrix is a basic parameter in cancer biology, as this helps to study the morphology of cancer cells. The time-dependant impedance signals obtained from cultured breast cancer cells on the microelectrode surface of various ECIS designs are explored to study cell adhesion to the electrodes and growth characteristics. Fig. 3 shows the real-time monitoring of cell adhesion and spreading of MDA-MB-231 cells. The results show that during the first hour the normalized impedance value increases slowly, indicating the cell adhesion stage in which the cells start to settle down towards the electrode surface, and became adherent to the electrodes. In the next 2–5 h, the impedance value increases rapidly, signifying the spreading stage.
image file: c3ra45090b-f3.tif
Fig. 3 Real-time monitoring of cell spreading of MDA-MB-231.

Although the general trend of the NI against time plot is the same for all the electrode designs, a maximum variation in the NI value is observed for Design 1, i.e. the design with the smallest working electrode area. The results indicate that during the cell adhesion stage the electrode area has less effect on the normalized impedance variation as the current path is restricted mostly to the electrolyte solution, and increases gradually due to the attachment of cells on the electrode surface. During the cell spreading stage the impedance variation is mostly controlled by the cells covering the electrode surface region.28 Since the concentration of the cells and the enclosed area of the cloning cylinder are the same in all four ECIS devices having various electrode designs, the fraction of electrode surface covered by cell growth and spreading at any moment in time is effectively greater in Design 1 compared to the other electrode designs. Thus, NI variation will be more pronounced in smaller electrode devices and slowly decrease for larger electrodes as described in previous literatures.36,37 A theoretical study predicts that the impedance of the cell-covered surface is inversely proportional to the electrode area30 because of the blocking of the current path at the electrode surface. Similar experimental observation has also been reported for HeLa and HaCaT cells.29

Fig. 4 shows microscopic images of the breast cancer cells after they are seeded in the well for 0 h, 2 h, 4 h and 6 h. As soon as the cells are seeded, a round morphology appears due to trypsinization, and by the time the cells are allowed to settle down to the surface, they form extended processes to anchor the substrate. It can be seen that at 2 h, the cells start to settle down onto the electrode surface, and the spreading process begins as the cells change from being a round shape to having extended processes. It is also observed from the picture that the cell line takes 4 to 5 h to complete the spreading stage. This result can be compared to the real-time impedance data obtained from the ECIS technique, as shown in Fig. 3.


image file: c3ra45090b-f4.tif
Fig. 4 MDA-MB-231 cells were allowed to spread on the microelectrodes for 0 h to 6 h. The microscopic photos were taken under ×20 magnification.

Impedimetric cytotoxic effects of ZD6474 on MDA-MB-231 cells

Different doses of ZD6474 are added to the cells after a 30-min inoculation of cultures on fabricated devices. The real-time cytotoxicity plot is shown in Fig. 5 for Design 1 and Fig. S4 for Designs 2–4. From the figure, it is evident that the drugs started working on the cells at around 21 h and the impedance started to decrease. The decreasing impedance trend for all the devices shows a similar pattern.
image file: c3ra45090b-f5.tif
Fig. 5 Real-time monitoring of the cytotoxicity of ZD6474 in Design 1.

The Bode plots for the cytotoxic effects of ZD6474 on MDA-MB-231 cells after 24 h are presented in Fig. 6 for Design 1 and Fig. S5 for Designs 2–4. The experimental data fit perfectly with the equivalent circuit used, which is shown in Fig. 1.


image file: c3ra45090b-f6.tif
Fig. 6 Bode plot for the effects of ZD6474 on MDA-MB-231 cancer cells in Design 1.

The results illustrate that the impedance value is inversely proportional to the WE area, as its magnitude is highest for all the samples measured in the ECIS device based on Design 1 compared to other designs, as observed from Fig. 6 and S5. From the figures, it is evident that the magnitude of impedance decreases gradually with an increase in frequency, while the phase angle value decreases up to 700 Hz and forms a plateau in the frequency range of 0.7 to 10 kHz, before increasing up to 1 MHz. At a lower frequency, a variation in the slope of the impedance data is observed. This may be due to a strong interaction between the drug and the cancer cells, followed by cell death and detachment of cells from the electrodes as described in previous literature.38 The relative standard deviation (RSD) for treated and untreated samples for different designs remains below 10%, which demonstrates the reproducible nature of the fabricated ECIS devices. To investigate the effect of the drug in solution on impedance values, an experiment is conducted by measuring the impedance of cell-free medium with different doses of drug, and the plot is described in Fig. S6. From the figure, it is evident that the impedance values for different drug doses vary negligibly, with 0.01% error. Thus, it may be assumed that the impedance due to different drug doses in solution plays no role in the impedance decrease of cells.

The frequency-dependent sensitivity of ECIS devices is calculated using eqn (2) and a characteristic plot using control data is shown in Fig. 7 for the various electrode dimensions. Among the various electrode geometries, the calculated sensitivity for Design 1 is highest, followed by the other designs, which implies that sensitivity is inversely proportional to the area of the electrode. This may be due to the increased attachment of cells at the electrode area reducing the reaction of the electrolyte with the electrode interface.


image file: c3ra45090b-f7.tif
Fig. 7 The sensitivity of the ECIS devices based on different designs. The RSD values remained below 10%.

ZD6474 inhibits the proliferation of MDA-MB-231 cells in a dose-dependent manner, and cell death is noted between drug concentrations of 1–15 μM in the MTT assay. The IC50 value of ZD6474 with respect to MDA-MB-231 obtained from the MTT assay is 7.65 ± 0.5246 μM. The percentage of living cells present for the control, 5 μM-, 10 μM- and 15 μM-treated samples is 95 ± 4, 62 ± 3, 42 ± 5, and 30 ± 4, respectively, as measured from the cell viability count. The IC50 value of ZD6474 is also calculated from the impedance data using eqn (3) and the plot is shown in Fig. 8:

 
image file: c3ra45090b-t1.tif(3)
where ZC and ZT represent the NI values of control and treated sample at 24 h, respectively.


image file: c3ra45090b-f8.tif
Fig. 8 Impedimetric cell viability calibration curve for ZD6474.

Curve fitting is carried out using LAB fit curve fitting software, and the equation correlating drug dose and cell viability is shown in eqn (4).

 
Cell viability = 98.75 × 0.9138Drug dose (4)

From the equation, it is evident that the IC50 value of ZD6474 is 7.74 ± 0.3532, which correlates well with the IC50 value obtained by the MTT assay method.

Fig. 9 shows phase contrast images for treated and non-treated MDA-MB-231 cancer cells. Cell death due to drug treatment is clearly evident from these images. It is apparent from the figure that cell death is greater with higher drug doses. This may be due to the lethal effects of ZD6474, which block cell proliferation and tumor growth, leading to increased cell motility.39 Thus, it can be said that the rate of cell death is inversely proportional to the impedance measured by the ECIS technique.


image file: c3ra45090b-f9.tif
Fig. 9 Dose-dependent apoptotic effect of ZD6474. Photomicrographs of MDA-MB-231 cells treated with 0, 5, 10 and 15 μM ZD6474 for 24 h.

Correlation between drug dose and impedance

From the above analysis, a qualitative approach to the assessment of the cytotoxic effects of ZD6474 is observed. However, a quantitative approach is required to understand the relationship between drug dose and impedance without using conventional methods. In addition, the characterization of an empirical relationship between drug dose, electrode area, and impedance obtained by correlation experiments would facilitate the design of the complex electrode geometries of ECIS devices. The correlation curves for impedance and phase angle values are shown in Fig. S7.

The obtained empirical relationship between the magnitude of impedance, the drug dose, and the working electrode area is expressed in eqn (5):

 
Z = (P1 + A)/(Q1 + R1 × D) (5)
where Z represents the impedance, D is the drug dose and A is the working electrode area. P1, Q1, and R1, are constant terms and their values are −0.58951 × 10⁵, −1.331, and −0.2581, respectively. The relationship between the phase angle, the drug dose, and the active electrode area is described in eqn (6):
 
θ = (P2 + A)/(Q2 + R2 × D) (6)
where θ represents the phase angle and the values of P2, Q2, and R2, are 0.4028 × 10⁶, 0.6519 × 10⁴, and 0.6601 × 10², respectively.

Eqn (5) and (6) describe the strong relationship between the drug dose and impedance by using the working electrode area as a dependant variable. However, a direct correlation can be established by keeping the frequency and the working electrode area constant.

Fig. S8 shows the inhibitory plot of ZD6474 in terms of the magnitude and phase angle of impedance.

The obtained mathematical relationship between the magnitude of impedance and the drug dose is expressed in eqn (7):

 
Z = R1 × S1D (7)
where R1 and S1 are constant terms and their values are 0.2960 × 10⁵ and 0.8986, respectively. The relationship between the phase angle and the drug dose is described in eqn (8):
 
θ = R2 × D + S2 (8)
where R2 and S2 are constants and the values are 0.5136 and −0.5878 × 10², respectively.

From the figure, a negative slope is evident in the case of the magnitude of impedance, while a positive slope in a negative direction is found for the phase angle value during curve fitting of impedance data. Thus, it can be said that with increased drug dose, the impedance value decreases.

Conclusions

This paper presents an assessment of the cytotoxic effects of ZD6474 on MDA-MB-231 breast cancer cells cultured on ECIS devices. It is observed in the present paper that the peak magnitude and the position of the normalized impedance changes can be correlated to cell adhesion and spreading. The cytotoxic effects of ZD6474 are associated with lower impedance values for drug-treated cells compared to control cells. The MTT assay and phase contrast images correlate well with the impedimetric cytotoxicity data. The quantitative relationship between impedance and drug dose proves that impedance decreases with increased drug dose. Thus, impedance sensing can be further used to study the cytotoxicity of several drugs as cell death is inversely proportional to the impedance.

References

  1. J. G. Pickering, L. H. Chow, S. Li, K. A. Rogers, E. F. Rocnik, R. Zhong and B. M. C. Chan, Am. J. Pathol., 2000, 156, 453–465 CrossRef CAS.
  2. E. Borenfreund, H. Babich and N. Martin-Alguacil, Toxicol. in Vitro, 1988, 2, 1–6 CrossRef CAS.
  3. F. Mazzotti, E. Sabbioni, J. Ponti, M. Ghiani, S. Fortaner and G. L. Rossi, ATLA, Altern. Lab. Anim., 2002, 30, 209–217 Search PubMed.
  4. L. Ceriotti, J. Ponti, F. Broggi, A. Kob, S. Drechsler, E. Thedinga, P. Colpo, E. Sabbioni, R. Ehret and F. Rossi, Sens. Actuators, B, 2007, 123, 769–778 CrossRef PubMed.
  5. J. Hong, K. Kandasamy, M. Marimuthu, C. S. Choi and S. Kim, Analyst, 2011, 136, 237–245 RSC.
  6. H. E. Park, D. Kim, H. S. Koh, S. Cho, J. S. Sung and J. Y. Kim, J. Biomed. Biotechnol., 2011, 485173 Search PubMed.
  7. J. Wegener, C. R. Keese and I. Giaever, Exp. Cell Res., 2000, 259, 158–166 CrossRef PubMed.
  8. C. Xiao and J. H. T. Luong, Biotechnol. Prog., 2003, 19, 1000–1005 CrossRef PubMed.
  9. A. Janshoff, A. Kunze, S. Michaelis, V. Heitmann, B. Reiss and J. Wegener, J. Adhes. Sci. Technol., 2010, 24, 2079–2104 CrossRef PubMed.
  10. J. Wang, C. Wu, N. Hu, J. Zhou, L. Du and P. Wang, Biosensors, 2012, 2, 127–170 CrossRef.
  11. A. R. Burns, D. C. Walker, E. S. Brown, L. T. Thurmon, R. A. Bowden, C. R. Keese, S. I. Simon, M. L. Entman and C. W. Smith, J. Immunol., 1997, 159, 2893–2903 CAS.
  12. C. M. Chan, J. H. Huang, H. S. Chiang, W. B. Wu, H. H. Lin, J. Y. Hong and C. F. Hung, Mol. Vision, 2010, 16, 586–595 Search PubMed.
  13. C. C. Hsu, W. C. Tsai, C. P. C. Chen, Y. M. Lu and J. S. Wang, Am. J. Physiol.: Cell Physiol., 2010, 299, C528–C534 CrossRef CAS PubMed.
  14. C. C. Lee, A. J. Putnam, C. K. Miranti, M. Gustafson, L. M. Wang, G. F. V. Woude and C. F. Gao, Oncogene, 2004, 23, 5193–5202 CrossRef CAS PubMed.
  15. S. Arndt, J. Seebach, K. Psathaki, H. J. Galla and J. Wegener, Biosens. Bioelectron., 2004, 19, 583–594 CrossRef CAS.
  16. H. Y. Yin, F. L. Wang, A. L. Wang, J. Cheng and Y. X. Zhou, Anal. Lett., 2007, 40, 85–94 CrossRef CAS.
  17. T. Sun and H. Morgan, Microfluid. Nanofluid., 2010, 8, 423–443 CrossRef CAS.
  18. K. B. Male, S. M. Crowley, S. G. Collins, Y. M. Tzeng and J. H. T. Luong, Anal. Methods, 2010, 2, 870–877 RSC.
  19. J. Muller, C. Thirion and M. W. Pfaffl, Biosens. Bioelectron., 2011, 26, 2000–2005 CrossRef PubMed.
  20. Y. C. Xu, Y. Lv, L. Wang, W. L. Xing and J. Cheng, Biosens. Bioelectron., 2012, 32, 300–304 CrossRef CAS PubMed.
  21. D. Opp, B. Wafula, J. Lim, E. Huang, J. C. Lo and C. M. Lo, Biosens. Bioelectron., 2009, 24, 2625–2629 CrossRef CAS PubMed.
  22. C. Xiao and J. H. T. Luong, Toxicol. Appl. Pharmacol., 2005, 206, 102–112 CrossRef CAS PubMed.
  23. C. K. Goldman, J. Kim, W. L. Wong, V. King, T. Brock and G. Y. Gillespie, Mol. Biol. Cell, 1993, 4, 121–133 CrossRef CAS.
  24. D. S. Salomon, R. Brandt, F. Ciardiello and N. Normanno, Crit. Rev. Oncol. Hematol., 1995, 19, 183–232 CrossRef CAS.
  25. J. Gille, R. A. Swerlick and S. W. Caughman, EMBO J., 1997, 16, 750–759 CrossRef CAS PubMed.
  26. P. Perrotte, T. Matsumoto, K. Inoue, H. Kuniyasu, B. Y. Eve, D. J. Hicklin, R. Radinsky and C. P. Dinney, Clin. Cancer Res., 1999, 5, 257–265 CAS.
  27. K. L. Weber, M. Doucet, J. E. Price, C. Baker, S. J. Kim and I. J. Fidler, Cancer Res., 2003, 63, 2940–2947 CAS.
  28. X. Huang, D. W. Greve, D. D. Nguyen and M. M. Domach, Impedance based biosensor array for monitoring mammalian cell behavior, 2003 Search PubMed.
  29. R. Pradhan, L. Das, J. Chatterjee, M. M. A. Mitra and S. Das, Sens. Lett., 2013, 11, 466–475 CrossRef CAS PubMed.
  30. L. Wang, H. Wang, K. Mitchelson, Z. Yu and J. Cheng, Biosens. Bioelectron., 2008, 24, 14–21 CrossRef PubMed.
  31. N. N. Mishra, S. Retterer, T. J. Zieziulewicz, M. Isaacson, D. Szarowski, D. E. Mousseau, D. A. Lawrence and J. N. Turner, Biosens. Bioelectron., 2005, 21, 696–704 CrossRef CAS PubMed.
  32. C. M. A. Brett and A. M. O. Brett, Electrochemistry: Principles, Methods, and Applications, Oxford University Press, London, UK, 1993, pp. 185–186 Search PubMed.
  33. R. Lind, P. Connolly, C. D. W. Wilkinson and R. D. Thomson, Sens. Actuators, B, 1991, 3, 23–30 CrossRef CAS.
  34. L. J. Breckenridge, R. J. A. Wilson, P. Connolly, A. S. G. Curtis, J. A. T. Dow, S. E. Blackshaw and C. D. W. Wilkinson, J. Neurosci. Res., 1995, 42, 266–276 CrossRef CAS PubMed.
  35. R. Pradhan, A. Mitra and S. Das, Electroanalysis, 2012, 24, 2405–2414 CrossRef CAS.
  36. R. Pradhan, M. Mandal, A. Mitra and S. Das, Sens. Actuators, B, 2014, 193, 478–483 CrossRef CAS PubMed.
  37. R. Pradhan, M. Mandal, A. Mitra and S. Das, IEEE Sens. J., 2014 DOI:10.1109/jsen.2013.2296717.
  38. R. Pradhan, S. Rajput, M. Mandal, A. Mitra and S. Das, Biosens. Bioelectron., 2014, 55, 44–50 CrossRef PubMed.
  39. S. R. Wedge, D. J. Ogilvie, M. Dukes, J. Kendrew, R. Chester, J. A. Jackson, S. J. Boffey, P. J. Valentine, J. O. Curwen, H. L. Musgrove, G. A. Graham, G. D. Hughes, A. P. Thomas, E. S. E. Stokes, B. Curry, G. H. P. Richmond, P. F. Wadsworth, A. L. Bigley and L. F. Hennequin, Cancer Res., 2002, 62, 4645–4655 CAS.

Footnote

Electronic supplementary information (ESI) available. See DOI: 10.1039/c3ra45090b

This journal is © The Royal Society of Chemistry 2014