T. A.
Arun‡
a,
Daya K.
Chacko‡
a,
Asha Anish
Madhavan
a,
T. G.
Deepak
a,
G. S.
Anjusree
a,
Thomas
Sara
a,
Seeram
Ramakrishna
b,
Shantikumar V.
Nair
a and
A. Sreekumaran
Nair
*a
aAmrita Centre for Nanoscience & Molecular Medicine, Amrita Institute of Medical Sciences, AIMS Ponekkara PO, Kochi 682041, Kerala, India. E-mail: sreekumarannair@aims.amrita.edu
bCentre for Nanofibers and Nanotechnology, Department of Mechanical Engineering and Nanoscience & Nanotechnology Initiative, National University of Singapore, 2 Engineering Drive 3, Singapore 117576
First published on 15th November 2013
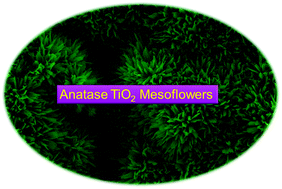
The present paper reports a simple route to fabricate high surface area anatase TiO2 mesoflowers from electrospun TiO2–SiO2 composite nanostructures. Electrospun fiber- and rice-shaped TiO2–SiO2 composite nanostructures upon treatment with concentrated alkali (NaOH) under hydrothermal conditions (180 °C) result in chemical transformation of the TiO2 and in situ etching of SiO2 to give sodium titanates. The sodium titanate upon acidification followed by a low temperature sintering (180 °C) results in 3D TiO2 mesoflowers. The material is found to be superior to the commercial P-25 in photocatalysis.
Titanate route, first reported by Kasuga et al.,7 has been used as a versatile method for increasing the surface area of TiO2 by several scientists. The process involves chemical transformation of the spherical TiO2 (P-25) particles into 1-D nanorods/nanowires by treating with concentrated alkali followed by acidification, washing and sintering.8 However, the titanate route when applied to electrospun TiO2 nanostructures gives interesting new morphologies of TiO2.9 We have previously shown that electrospun TiO2–SiO2 composites when treated with conc. NaOH at 80 °C (under ambient pressure) followed by hydrothermal treatment with acid (HCl) leads to high surface area 1-D titanates/TiO2.9 However, when the reaction sequences were reversed, i.e., when the TiO2–SiO2 composites were first hydrothermally treated (in an autoclave at high pressure and 180 °C) followed by acidification and low temperature sintering (180 °C), the result was highly crystalline, high surface area anatase 3-D TiO2 mesoflowers, which is the subject matter of the present paper. The material showed excellent photocatalytic property.
Experimental details are given in ESI 1–4.†Fig. 1A shows the SEM image of the as-electrospun TiO2–SiO2–PVAc composite nanofibers. The fibers were smooth with diameters varying between 80 nm and 400 nm. The as-spun fibers upon sintering (at 450 °C for 3 h) results in the degradation of the polymer forming rice-shaped TiO2–SiO2 composites (Fig. 1B). The average dimensions of the rice-shaped structures were ∼400 nm in length and ∼90 nm in diameter. The bottom and top insets of Fig. 1B shows a highly-resolved SEM and TEM image, respectively, of a single rice-like structure revealing its porous nature. Fig. 1C shows an EDS spectrum recorded from the sample showing the elemental composition (Ti, Si and O, the presence of Au was from the sputter coating). Fig. 1D shows a lattice-resolved TEM image indicating the TiO2 lattice fringes corresponding to 0.35 nm (implying anatase nature of the TiO2). Powder XRD spectrum of the material showed prominent peaks of the anatase TiO2 alone (ESI-5†), implying the amorphous nature of the SiO2 (this is further evident from the TEM image in Fig. 1D where the crystalline regions could be TiO2 and the amorphous ones SiO2, marked with dotted circles of different colors). The peaks are indexed in the spectrum itself. The material was further characterized by XPS. The survey spectrum (ESI-6†) and high-resolution spectra of elements (ESI-6†) show elemental composition and oxidation state of the elements. The high-resolution spectra of the O (the spectrum of the O could be de-convoluted into two peaks at 529.2 eV and 532.8 eV, implying the presence of Ti–O–Ti and Si–O–Si bonds)10 and Si imply the existence of SiO2 into the TiO2 matrix. The SEM image of the sodium titanate (Na2Ti3O7) obtained from the rice-shaped TiO2–SiO2 composite (before acid treatment and sintering) is shown in Fig. 2A. The initial rice-shaped morphology has been totally lost and sheet/ribbon-like structures appeared. The sheet-like, layered structure of the titanates is evident from the TEM images (Fig. 2B & C, respectively). The spacing between the individual layers was ∼0.8 nm (ref. 11) as evident from the high-resolution image (Fig. 2C). Fig. 2D shows the powder XRD of the titanates showing the relevant diffraction peaks.7,8,11 The BET surface area of the titanate was found to be 182 m2 g−1.
![]() | ||
Fig. 2 (A) SEM image of the sodium titanate. (B) TEM image of the sheet-like titanate. (C) High resolution TEM image of the titanate sheet. (D)XRD spectrum of the titanate (JCPDS File no. 31-1329). |
Fig. 3A & B show a large area and enlarged SEM images, respectively, of the flower-shaped TiO2 obtained after acidification and low temperature sintering (180 °C) of the sodium titanate. It is evident that the sheet or ribbon-like structures seen for the titanates got completely transformed into flower-shaped mesostructures. Acidification and washing stages help in exchange of Na+ with H+ (resulting in H2Ti3O7) and subsequent low temperature sintering was enough for conversion of hydrogen titanates to TiO2.7,8,11Fig. 3C shows a TEM image of a part of the flower-like TiO2 revealing that the TiO2 is actually made-up of small spherical particles of ∼5 nm diameters. High-resolution image of a single particle is shown in the inset of Fig. 3C showing the 0.35 nm lattice spacing corresponding to the (101) phase of anatase TiO2. Fig. 3D shows EDS spectrum of TiO2 additionally confirming the elemental composition of the TiO2 mesoflowers.
ESI-7A† shows the XRD pattern of the flower TiO2 showing its anatase and highly crystalline nature. Major peaks are indexed in the spectrum itself. This further implies the phase purity of the TiO2 produced by the route (absence of rutile phase, other impurity, etc.). The average size of the crystallites estimated using the Debye Scherrer equation was ∼6.1 nm in agreement with TEM results. The elemental composition and phase purity of the TiO2 was assessed by XPS spectroscopy as well. ESI-7B† shows the survey spectrum revealing the elemental composition (Ti & O, respectively). The binding energies of Ti 2p3/2 and Ti 2p1/2 were centered at 458.14 eV and 463.82 eV, respectively (ESI-6C†), corresponding to a spin–orbit coupling of 5. 68 eV. The O1s (ESI-7D†) showed a single peak implying the absence of impurities. The BET surface area of the material was 132 m2 g−1. The average pore size and pore volumes of the TiO2 were found to be 1.3 nm and 0.11 cm3 g−1, respectively. The TiO2 was further characterized by Raman spectroscopy (ESI-8†). The peaks at 158 cm−1, 201 cm−1 and 644 cm−1, respectively, correspond to the Eg modes and the remaining two peaks at 402 cm−1 and 525 cm−1 correspond to the B1g and A1g modes, respectively.12 The band-gap of TiO2 was found to be 3.2 eV (from diffuse reflectance spectroscopy measurement).
From the experimental observations, a tentative mechanism of formation of the flower-shaped structures could be proposed as follows: we believe that the alkali treatment of the TiO2–SiO2 composite results in Ti–O–Na bond (amorphous) formation8 with the in situ dissolution of SiO2 from the TiO2 matrix. The Ti–O–Na bond formation is accompanied by the formation of sheet/ribbon-like structures (SEM image in Fig. 2A). The sheet-like structures upon acidification followed by sintering self-assemble and results in the formation of flower-shaped TiO2 mesostructures (Fig. 3). The structural rearrangement of the TiO2 and the in situ dissolution of SiO2 have contributed to the enormous increase in surface area for the final TiO2 (from 38 m2 g−1 for the TiO2–SiO2 composite to 132 m2 g−1 for the final TiO2). A tentative mechanism of the overall formation process is shown in the Schematic in Fig. 4. However, complete unravelling of the mechanism needs further in-depth investigations which are in progress.
We have checked whether the same mechanism operates in electrospun fiber-shaped TiO2–SiO2 composites (see ESI-2, 3 & 9†) under the same conditions. SEM images of the fiber-shaped TiO2–SiO2 composite (ESI-9†) and the final cauliflower-like TiO2 are shown in ESI-10.† The anatase nature of the TiO2 is evident from the powder XRD data in ESI-11.† Thus it is clear that the chemistry operates nearly in the same manner in both the cases, however, the morphology of the final TiO2 slightly differs from that of the rice-shaped TiO2–SiO2 composite. This further implies that the morphology of the final TiO2 by the route depends on the morphology of the initial TiO2–SiO2 composite as well.
To demonstrate the potential use of the material for photocatalytic applications, we have tested the degradation of a drop of methyl orange (MO) on thin films (the films had same area of 2 cm2 and average thickness of ∼30 μm fabricated by screen printing technique on glass slides) of the respective TiO2. The films carrying MO drops (single drop from a dropper) were irradiated for 20 min and digital photographs of the films were taken at an interval of 5 min each (Fig. 5). As could be seen from Fig. 5, the dye degraded faster in the case of the film made out of TiO2 mesoflowers (near complete degradation in 20 min) while that in presence of P-25 was slower. We have also investigated the degradation behavior of the dye in the absence of light where the effect was found to be negligible. The superior photocatalytic activity of the mesoflowers could be attributed to its high surface area and crystallinity in comparison to that of the P-25.
In summary, we have found a simple route for fabricating high surface area 3-D TiO2 mesoflowers from TiO2–SiO2 composites. The TiO2–SiO2 composite upon treatment with 5 M NaOH under hydrothermal conditions followed by acidification with HCl and low temperature sintering result in flower-shaped anatase TiO2. The methodology works with rice- and fiber-shaped TiO2–SiO2 composites. The mesoflowers were characterized thoroughly by spectroscopy and microscopy. The material showed excellent photocatalysis property.
Footnotes |
† Electronic supplementary information (ESI) available: Experimental and characterization details and SEM images of the TiO2 obtained from TiO2–SiO2 composite nanofibers. See DOI: 10.1039/c3ra45021j |
‡ These authors contributed equally. |
This journal is © The Royal Society of Chemistry 2014 |