Alfred Tawirirana Chidemboa,
Seyed Hamed Aboutalebia,
Konstantin Konstantinov*a,
Charl Jeremy Jaftab,
Hua Kun Liua and
Kenneth Ikechukwu Ozoemenabc
aInstitute for Superconducting & Electronic Materials (ISEM), University of Wollongong, Innovation Campus, Wollongong, NSW 2519, Australia. E-mail: atc987@uowmail.edu.au; konstan@uow.edu.au; Fax: +61 242215731; Tel: +61242215730
bEnergy Materials Unit, Materials Science and Manufacturing, Council for Scientific & Industrial Research (CSIR), Pretoria 0001, South Africa. E-mail: kozoemena@csir.co.za
cDepartment of Chemistry, University of Pretoria, Pretoria 0002, South Africa. E-mail: kozoemena@csir.co.za
First published on 15th November 2013
We report the use of a spray pyrolysis method to synthesize high surface area (BET surface area of 139 m2 g−1) self-organized, micron sized urchin-like composites made up of reduced graphene oxide and needle-shaped manganese oxide (rGO–Mn2O3–Mn3O4). Maximum capacitances of 425 Fg−1 at 5 mV s−1 from a three electrode set up and 133 Fg−1 at a current density of 0.2 Ag−1 were recorded using an asymmetric two electrode set up with graphene as the anode. The composite material also showed a capacitance retention of 83% over 1000 cycles. We attribute this remarkable performance to the high specific surface area due to the urchin-like hollow structures and synergy between the manganese oxide and reduced graphene oxide materials within the composite. Furthermore, this synthesis technique can be exploited further in the bulk synthesis of cost effective graphene–metal oxide hybrid materials for energy storage applications.
Depending on the method of preparation and conditions, a variety of nanostructures have also been reported. We are aware of the many reports on MnOx urchin-like structures in literature. These have been shown to possess high surface area and good electrochemical activity although their preparation time takes a conciderably long time when compared to the spray pyrolysis method.17,18
In this work we use the in situ spray pyrolysis method to produce for the first time, hybrid 3D urchin-like architectures of Mn2O3 and Mn3O4 anchored on a highly conductive reduced graphene oxide support with improved electrochemical performance. A total specific capacitance of 425 Fg−1 and 133 Fg−1 in three-electrode and two-electrode asymmetric set ups were recorded in 1 M NaOH as an electrolyte respectively. In spite of the very limited time of heat treatment, the spray pyrolysis method proved to be effective in the reduction of graphene oxide (GO) to reduced graphene oxide (rGO), which offers a simple yet effective approach to design advanced graphene based hybrid materials with extraordinary capacitance. Due to the presence of rGO, high capacitance retention of 83% was observed over 1000 cycles.
The spray pyrolysis technique: while providing perfect homogeneity of the final products and productivity with industry up-scaling capabilities offers great flexibility regarding the type and use of initial solutions and/or suspensions. By controlling the fabrication process, it is possible to manufacture a wide range of materials with numerous shapes and structures. We therefore suggest that this method can be further exploited to fabricate a wide range of graphene–metal oxide–hydroxide materials for different applications in energy storage devices.
![]() | ||
Fig. 1 Schematic diagram showing the experimental procedure for the formation of the Mn2O3–Mn3O4–rGO composites from manganese nitrate hydrate. |
To investigate the effect of adding GO to the manganese oxide we prepared the first material without any GO present. This material was prepared by adding 27.39 g of Manganese(II) nitrate hydrate (Mn(NO3)2·xH2O, 98%, Sigma) powder into water resulting in a brown suspension, the same as Winkler test.20
2Mn(NO3)2(s) + 3/2O2(g) + H2O(l) → 2MnO(OH)2(s) + 2N2O5(g) | (1) |
The red-brownish suspension was stirred for 30 minutes using a conventional magnetic stirrer and then sprayed at 600 °C in air into a vertical-type spray-pyrolysis reactor (note that this material was not mixed with graphene oxide). Following this, we prepared GO containing mixtures with varying amounts of GO with weight ratios of 1:
12 and 1
:
7 (GO
:
Mn (NO3)2·xH2O). Manganese(II) nitrate hydrate (Mn(NO3)2·xH2O, 98%, Sigma) was diluted in a GO dispersion in water. The dispersion was stirred for 30 minutes using a conventional magnetic stirrer followed by spray-pyrolysis at 600 °C into a vertical-type spray-pyrolysis reactor to obtain rGOMO1 and rGOMO2.
The electroactive material (rGOMO) were mixed with carbon black and PVDF binder at a mass ratio of 70:
20
:
10 in an Agate mortar with (N-methyl pyrrolidinone) NMP solvent and ground to form a slurry.
This was then spread on to the polished stainless steel surface to achieve mass loadings between 1 and 2 mg and allowed to dry in a vacuum oven for 24 h. Electrochemical experiments were then performed at room temperature on the CHI660C (CH Instruments, Inc) electrochemical workstation using the three electrode system in a beaker type cell in 1 M NaOH. An Ag|AgCl reference electrode and a platinum foil counter electrode were used for the cyclic voltammetry (CV) over a voltage range of −0.2 to 0.5 V at various scan rates (5 to 100 mV s−1). Electrochemical impedance spectroscopy (EIS) measurements were carried out between 10 kHz and 0.01 Hz using a 5 mV rms sinusoidal modulation.
To fabricate the positive electrode for the coin cell asymmetric setup, a slurry of the active material (in this case rGOMO1) was prepared as described above but this time coated onto the nickel foam substrate, with an average mass loading of ∼1.4 mg cm−2. The same procedure was followed for the negative electrode made up of graphene. The electrodes were then dried at 80 °C for 8 hours in a vacuum oven and pressed to a thickness of ∼0.5 mm. These electrodes were assembled in a coin cell (LIR 2032) separated by whatman© filter paper with 1 M NaOH as electrolyte. A combined mass of 3.6 mg was used for both electrodes with a mass ratio (m+/m−) of ∼2. The cell was then tested using Galvanostatic charge–discharge measurements and EIS on an Autolab potentiostat PGSTAT 302N (Eco Chemie, Utrecht, The Netherlands) driven by the General Purpose Electrochemical Systems data processing software (GPES and FRA software version 4.9).
MnO(OH)2 → Mn(OH)2 → MnO(OH) → MnO2 → Mn2O3 → Mn3O4 | (2) |
Nonetheless, the addition of graphene oxide (GO) to the suspension and spray pyrolysis results in the conversion of MnO(OH)2 to Mn2O3 and Mn3O4. XRD patterns suggest that at higher concentration of GO, characteristic peaks of Mn3O4 emerge more sharply. Therefore, higher concentration of GO seems to increase the kinetics of phase transformation of Mn2O3 to Mn3O4 that usually needs heat-treatment at temperatures in excess of 800 °C.5,21
In the case of spray pyrolysis, due to the very short reaction time, the co-existence of Mn2+ and Mn3+ favours the formation of hausmannite (Mn3O4).22,23 The addition of GO sheets, which exhibit oxygen functional groups in the form of carboxyl, hydroxyl or epoxy groups on their basal planes and edges and water molecules in between the GO sheets, can therefore promote faster kinetics of conversion to hausmannite (Mn3O4). These functional groups, which also contain hydrogen, might alleviate the decomposition of manganese hydroxide compounds and the reduction of Mn2O3 to Mn3O4. Therefore, the existence of the higher percentage of Mn3O4 in rGOMO2 hybrid material compared to rGOMO1 can be attributed to the higher percentage of GO and consequently higher percentage of hydrogen containing functional groups. Field emission scanning electron microscopy (FE-SEM) was employed to investigate the morphology of the obtained samples. Fig. 3 shows FE-SEM micrographs of all three samples where unique urchin like microstructures with manganese oxide needles are observed to grow radially from the rGO core of the hollow spheres.
Manganese oxides have the tendency to form nanorods or needle like structures.16,24,25 Though the formation mechanism of the nanorods requires further investigation, the particles originating from the sprayed suspension are believed to orient themselves to form one-dimensional nanorods on the rGO sheets. Through oriented attachment along the side surfaces, 1D nanorods enlarge their diameter to become bulky nanorods in order to minimize the surface energy according to Li et al.26
In Fig. 3a and b, the nanorods between adjacent microspheres are observed to be entangled, creating a network on the electrode surface. However, higher amounts of GO sheets decrease the solubility of the Mn species, which is in agreement with the decrease in the length of nanorods upon increasing the percentage of GO in the solution. Moreover, the addition of GO dispersion (with pH of around 3–4) to manganese suspension increases the acidity of the suspension which results in proton chemisorption which in turn stabilizes the surface of small particles and limits the growth stage27 as observed in Fig. 3c and d. A combination of the nanoparticles and spherically shaped graphene oxide sheets provide a porous network on the electrode surface ideal for charge storage.
FE-SEM micrographs (In Fig. 3d and e) clearly suggest that an increase in the concentration of GO in rGOMO2, hinders further growth of manganese oxide needles upon keeping manganese oxide particles apart from each other. This is in agreement particularly with the BET results for the best performing rGOMO1 observed to be 139 m2 g−1 while that of the manganese oxide–hydroxide was only 29 m2 g−1.
To further investigate the formation process, HRTEM was performed on the samples to reveal an aggregation of different primary nanoparticles in Fig. 4a. This suggests that the manganese oxide–hydroxide sample contains single crystal nanoparticles which are in good agreement with the formation mechanism suggested above. The attachment of these single crystal nanoparticles to form nanorods and further orientation of these 1D nanorods to form bulky nanorods is also illustrated in Fig. 4b. The combination of manganese oxide nanorods with graphene oxide sheets is shown in Fig. 4c suggesting the hollow nature of the spheres. Upon closer inspection it can be clearly seen in Fig. 4d, that the nanorods are actually composed of a few primary nanorods aggregated along the lateral faces.28
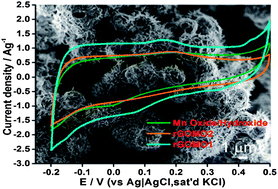
Typical C1s spectra of both as-prepared graphene oxide and spray pyrolyzed sample at 600 °C obtained by XPS are shown in Fig. 5. Deconvolution and curve fitting of C1s spectra were performed using CASAXPS software employing a Gaussian–Lorentzian peak shape after performing a Shirley background correction. The C1s spectra mainly consist of 5 individual peaks namely: carbon sp2, carbon sp3, epoxy/hydroxyls, CO groups and carboxylates. The significant increase in the ratio of carbon–carbon bonds to functional oxide groups (from 0.76 to 1.25) clearly suggests that spray pyrolysis can induce the graphene oxide to reduced graphene oxide transition in spite of the very limited time of heat treatment (less than 1 second). Cyclic voltammetry was used as the first diagnostic tool to electrochemically characterize the manganese oxide–hydroxide and rGOMO composites as shown in Fig. 6a. A large current separation was observed for the rGOMO1 electrode suggesting higher capacitance compared to rGOMO2 and manganese oxide–hydroxide electrodes.
![]() | ||
Fig. 5 Fitted XPS C1s spectra of (a) as-prepared GO sample and (b) spray pyrolyzed sample at 600 °C. |
The CV's deviate from the rectangular shape expected for an electrical double layer capacitor (EDLC) due to the pseudocapacitance contribution by the manganese oxides which is known to add to the overall capacitance due to the variable oxidation states exhibited by manganese. Individually, Mn2O3 and Mn3O4 have been meagrely reported in literature as supercapacitor electrodes with low capacitance due to poor conductivity.5,29 However, a mixture of Mn2O3 and Mn3O4 mixed with multiwalled carbon nanotubes (MWCNT) has been reported by Lin et al. to give better performance due to the pseudocapacitance arising from electron transfer at Mn sites and EDCL contribution by the MWCNTs.30 Similarly, we observed the same phenomenon this time using rGO. The Mn3+ in Mn2O3 has been described as going through an oxidation reaction giving rise to one electron being transferred and attaining a valence state of Mn4+.5 Accordingly, the electrochemical reaction in eqn (3) is expected to take place during the charge–discharge process involving OH− chemisorption/intercalation into Mn2O3 structure.5
Mn[Mn]O3 + OH− ↔ 4Mn4+[Mn3+]OH−O3 + ē | (3) |
While the energy storage mechanism of Mn3O4 supercapacitor electrode materials has been recorded previously as a proton–electron mechanism, the CV peaks in Fig. 6a cannot be assigned specifically to a particular phase since rGO also possesses some oxide groups on its surface that are capable of participating in redox reactions. However, the overall effect is an enhanced capacitance due to the pseudocapacitance effect arising from all the constituent materials in the composite. The following formula was therefore used to calculate the specific capacitance of the electrode materials at different scan rates.31
![]() | (4) |
As scan rate is increased, a drop in specific capacitance can be noted. This is due to the less effective interaction between electrolyte ions and the electrode at high scan rates. However, the 3D structure of the rGOMO1 material is essentially an ensemble of concealed interfaces which become accessible at low scan rates thereby increasing the electroactive surface area available for charge storage.32 We therefore established that at 5 mV s−1, the chemisorption and/or intercalation of OH− into the microstructure is facilitated by the low scan rate hence the more pronounced peaks and higher capacitance. At high scan rates, the peaks become less pronounced (see Fig. 6b) due to the limited time for ions to reach some of the buried interfaces mentioned earlier.
Further tests to investigate mechanistic effects on the electroactive material such as ion transfer, conduction and capacitive behaviour were carried out using EIS. Fig. 6d shows comparative Nyquist plots for the three electrodes in the three electrode set-up. The Nyquist plot is made up of two regions: the high frequency and low frequency regions with each point on the Nyquist plot representing a particular measurement taken at a specific frequency. From the inset in Fig. 6d, the small semi-circle observed in the high frequency region is due to charge transfer resistance (Rct) on the electrode/electrolyte interface. The intercept between the plots and the Z′ axis represents the ohmic resistance (Rs). From the plot, the manganese oxide/hydroxide material is observed to have a small Rct (5.80 Ω) possibly due to the large number of nanorods that enhance the electrode surface area.33 An addition of rGO clearly enhances the conductivity of the composite as can be observed from the reduction in the Rct with increase in graphene oxide content in rGOMO2. The rGOMO1 hybrid material shows an Rct value of 4.53 Ω while that of rGOMO2 is only 3.7 Ω. rGO therefore acts both as a conductive support as well as an agent for the uniform dispersion of manganese oxide nanoparticles in the composite thereby enhancing charge transfer within both electrode materials.
The specific capacitance values calculated from the charge–discharge method using eqn (5) are in agreement with those from CV with the rGOMO1 achieving a specific capacitance of 356 Fg−1 followed by rGOMO2 with a specific capacitance of 249 Fg−1 and 178 Fg−1 for the manganese oxide–hydroxide at 0.35 Ag−1.
C = i(A) × Δt(s)/m(g) × ΔE(V) | (5) |
From the values achieved, we can attribute the outstanding performance to the distinctive 3D network (combination of nanotubular whiskers and nanoparticles homogenously distributed on the surface of mircospheres), synergy between metal oxide and the transition from GO to rGO after the spray pyrolysis. The rGO has been reported to be more conducting and also more capacitive than GO also showing good power capabilities.34
![]() | (6) |
So far we have shown that the composite electrode material between manganese oxides and rGO results in enhanced capacitance. Following this, high energy and power densities of the asymmetric supercapacitor assembly should be expected due to the high surface area of rGO implying high power density while the manganese oxide has a high energy density. This synergy between the constituent materials results in a robust asymmetric device with an energy density of 9.07 W h kg−1 and a power density of 26.4 kW kg−1. These values were calculated using eqn 7 and 8 from the galvanostatic data.
SE(W h/kg) = i(A) × Δt(s) × ΔE(V)/m(kg) | (7) |
SP(W/kg) = SE/t | (8) |
One of the characteristics that make supercapacitors more attractive energy storage devices when compared to batteries is the long cycle life of these devices. In light of this, a cycle life test was performed over 1000 cycles with the capacitance retention recorded at 2 Ag−1 using charge–discharge. A capacitance retention of 83% shown in Fig. 8 can be attributed to the presence of the more stable rGO support and graphene anode in the device. Carbonaceous materials are well known to possess remarkable cycling stability which renders the supercapacitor device appropriate for practical applications. Accordingly, the excellent interfacial contact between the Mn2O3 and Mn3O4 and formation of nanorods effectively prevent the agglomeration and restacking of graphene sheets thereby enhancing the electrochemical activity of the composites. Additionally, the presence of rGO in the final electrode materials assists in improving the conductivity of the poorly conducting Mn2O3 and Mn3O4 resulting in an enhanced electrical double layer capacitance to the overall specific capacitance, resulting in rapid charge–discharge process.
![]() | ||
Fig. 8 Cycle life of the assembled asymmetric supercapacitor device tested over 1000 cycles at a current density of 0.2 Ag−1 within a potential window of 1.4 V. |
This journal is © The Royal Society of Chemistry 2014 |