An N-doped anatase/rutile TiO2 hybrid from low-temperature direct nitridization: enhanced photoactivity under UV-/visible-light
Liya
Hu
a,
Jingyu
Wang
*b,
Jianxiong
Zhang
b,
Qiuyan
Zhang
a and
Zhihong
Liu
*a
aKey Laboratory of Analytical Chemistry for Biology and Medicine (Ministry of Education), College of Chemistry and Molecular Sciences, Wuhan University, Wuhan, China. E-mail: zhhliu@whu.edu.cn
bDepartment of Chemistry, Harbin Institute of Technology, Harbin, China. E-mail: jingyu.wang@163.com
First published on 6th November 2013
Abstract
Colloidal N-doped TiO2 nanocrystals are successfully synthesized by low-temperature direct nitridization in triethylamine solution during hydrolysis of tetrabutyl titanate, followed by acidic peptization at 70 °C. Through adjusting the acid concentration and peptization time, the N-doped samples consisting of different proportions of anatase and rutile phases are obtained. Several characterization techniques including X-ray diffraction (XRD), transmission electron microscopy (TEM), X-ray photoelectron spectroscopy (XPS) and UV-vis diffuse reflectance spectroscopy are employed to determine the crystal phase, morphology, degree of nitrogen incorporation and optical properties of the products. The high resolution XPS spectrum of the N 1s region confirms the substitutional nitrogen doping of lattice oxygen in TiO2 crystals. For comparison, it is found that most of the N species are chemisorbed on the surface of TiO2 particles if the N-source is introduced after crystallization. The light response in the range of 400–500 nm is obviously improved by N doping, which facilitates the absorption of photons to produce e−–h+ pairs under visible irradiation. On the other hand, nitrogen doping also inhibits the recombination of the photoinduced carriers and therefore increases the quantum efficiency of the TiO2 photocatalyst. As a result, the as-synthesized N-doped TiO2 nanomaterials exhibit higher photocatalytic activity both in the UV- and visible-light region in contrast to the non-doped TiO2. The hybrid containing 63.1% anatase shows the highest photocatalytic activity, which is due to a synergistic effect between anatase and rutile.
Introduction
Titanium dioxide (TiO2) has attracted extensive interest in the past decades owing to its potential applications in environmental abatement (degrading waste materials and harmful compounds), water splitting, and solar energy conversion.1,2 However, the high recombination rate of photogenerated carriers hinders its further application in industry. In most cases, the electron–hole pairs simply recombine at the surface or bulk trapping sites with the release of photons and heat, which is responsible for the low quantum yields. In comparison to the serious recombination of charge carrier in TiO2 with single crystal phase, the enhancement of photocatalytic activity in the coexistence of anatase and rutile phases has been revealed by plenty of experimental evidence.3–6 The anatase/rutile TiO2 hybrid nanostructure is intriguing because it involves only a change in the crystal structure and can be achieved in the same solution. The electrons excited by UV-light can be effectively transferred from anatase to rutile, which has slightly lower CB energy, and thus the charge recombination is suppressed.7Currently another drawback of TiO2 photocatalyst in practical application is the lack of visible light utilization because of its wide bandgap (3.2 eV for anatase TiO2). Since Asahi et al. reported in 2001 that N-doped TiO2 synthesized by sputtering method showed obvious visible-light absorption.8 Increasing attention has been paid to the doping of TiO2 with nonmetal atoms. To date, a variety of nonmetal atoms like B, C, N, P, S, and X (X = F, Cl, Br or I) have been successfully doped in the lattice of TiO2 crystals.9–14 Among the existing systems, N doping is considered as an ideal candidate because N 2p states could effectively mix with O 2p states.15 Density functional theory (DFT) calculations show that substitutional N atoms narrow the bandgap of TiO2 by creating an energy level above the valence band (VB) maximum or lowering the oxygen vacancy formation energy below the conduction band (CB) minimum.16 However, Torres et al. found that the additional energy level created by N doping also acted as recombination centers of visible-light excited charge carriers, and that increasing the doping density enhanced the recombination as a result of the reduced bandgap.17 Such a drawback of N-doped TiO2 limits its applications in visible-light photocatalysis. A recent study proposed that the visible-light generated electrons could be transferred from the CB of anatase to that of rutile, causing effective electron–hole separation.18 Therefore, doping N in anatase/rutile TiO2 hybrid structure is expected to extend the light absorption range as well as improve the charge carriers separation.
Although several chemical approaches, such as mechanochemical synthesis, chemical vapor deposition and ion implantation technology have been reported for synthesizing N-doped TiO2 materials,19,20 the urgency of developing improved preparation route is still highlighted. The common defect of these techniques is the requirement of complicated and expensive equipments. Moreover, mechanochemical synthesis usually practices the doping process on a micrometer scale and is inclined to destroy the original manner of crystals. Another catalog of synthesis method for N-doped TiO2 involves calcinations at high temperature (>400 °C) using inorganic or organic N-sources, such as annealing TiO2 targets in an N2, NH3 or N2H4 atmosphere, and co-annealing hydrated precipitation (TiO2·nH2O) with urea, ammonium salts or ethylenediaminetetraacetic acid (EDTA).8,18,21,22 Nevertheless, this kind of doping route results in undesirable particle agglomeration, low specific surface area and very small amounts (≤2%) of N incorporation.23 The third methodology is based on wet-chemical process, which not only decreases the reaction temperature to some extent but also ensures sufficient doping. Han et al. put the mixture of TiO2 and triethylamine into Teflon lined autoclave followed by maintaining at 180 °C for 24 h.24 In order to establish a milder and simpler approach to obtain N–TiO2 composites, Gole and Burda employed the direct nitridization of anatase TiO2 particles with alkylammonium salts or triethylamine at room temperature.23,25 The nitrogen element in the composite mainly existed as oxynitride bound to surface oxygen sites of TiO2 (i.e. chemically adsorbed N species), as evidenced by the N 1s peaks locating at ∼400.7 eV in XPS spectra. The mostly possible reason is that the nitridization process occurred after the crystallization of TiO2 so that the crystal structure remained unchanged during reacting with N-sources.
Inspired by the low-temperature nitridization concept and based on our previous work concerning low-temperature technique for adjusting the phase composition of nanosized TiO2 crystals,26,27 herein we introduced N-source (triethylamine) during the hydrolysis of titanate to achieve substitutional N-doping in TiO2 lattice and phase conversion in the process of crystallization. In this case, most nitrogen species existed in a substitutional doping state as N–Ti–O rather than chemically adsorbed on TiO2 surface. This novel low-temperature strategy yielded N-doped anatase/rutile TiO2 hybrid with obvious visible-light absorption as well as efficient separation of charge carriers.
Experimental section
Catalyst preparation
TiO2 hydrosol was prepared by a low-temperature route developed in this lab.26,27 And N-source was introduced into the system during hydrolysis of titanate. In a typical procedure, 0.5 mL of tetrabutyl titanate was dissolved in absolute alcohol with the volume ratio of 1![[thin space (1/6-em)]](https://www.rsc.org/images/entities/char_2009.gif) :
:![[thin space (1/6-em)]](https://www.rsc.org/images/entities/char_2009.gif) 20. The solution was added dropwise to 95 mL of distilled water solution containing 20 mL of triethylamine. A clear mixture was generated after continuous stirring for 24 h at room temperature and the pH value was about 12.0. In this process, the condensation and crystallization occurred. For comparative analysis of crystal phase, the intermediate product was collected, which was labeled as N0. Then 0.5 M nitric acid (HNO3) aqueous solution was added to the system. After peptizing at 70 °C for 20 h for further crystallization, the N-doped TiO2 product was obtained, which was labeled as N3. In this way, various products (labeled as Nn, where n ranges from 2 to 8) were synthesized under different acid concentration (c) or peptization time (t). The pure TiO2 product, N1, was obtained as well without the addition of triethylamine.
20. The solution was added dropwise to 95 mL of distilled water solution containing 20 mL of triethylamine. A clear mixture was generated after continuous stirring for 24 h at room temperature and the pH value was about 12.0. In this process, the condensation and crystallization occurred. For comparative analysis of crystal phase, the intermediate product was collected, which was labeled as N0. Then 0.5 M nitric acid (HNO3) aqueous solution was added to the system. After peptizing at 70 °C for 20 h for further crystallization, the N-doped TiO2 product was obtained, which was labeled as N3. In this way, various products (labeled as Nn, where n ranges from 2 to 8) were synthesized under different acid concentration (c) or peptization time (t). The pure TiO2 product, N1, was obtained as well without the addition of triethylamine.
For comparison, a surface-N-bound TiO2 sample was produced by adding N-source to TiO2 system after condensation and crystallization in light of ref. 23 and 25. Briefly, the titanate–alcohol solution with same volume ratio was added dropwise to 95 mL of 0.1 M HNO3 aqueous solution. A clear solution was generated after continuous stirring this mixture for 24 h at room temperature. Then 20 mL of triethylamine was added to the system to initiate the nitridization process. After peptizing at 70 °C for 20 h, the product was collected and labeled as N9. The experimental conditions as well as the phase compositions of as-prepared samples (N0–N9) were given in Table 1.
| Sample | Acid concentration, c | Peptization time, t | Anatase | Rutile |
|---|---|---|---|---|
| a N0 is the intermediate product before adding HNO3 solution. b N1 is the non-doped TiO2 product without adding triethylamine. c N9 is the surface-N-bound product by adding triethylamine after condensation and crystallization of TiO2. | ||||
| N0a | — | — | 100% | 0% |
| N1b | 0.1 M | 20 h | 100% | 0% |
| N2 | 0.1 M | 20 h | 100% | 0% |
| N3 | 0.5 M | 20 h | 63.1% | 36.9% |
| N4 | 1.0 M | 20 h | 12.3% | 87.7% |
| N5 | 0.5 M | 4 h | — | — |
| N6 | 0.5 M | 8 h | 81.2% | 18.8% |
| N7 | 0.5 M | 36 h | 27.4% | 72.6% |
| N8 | 0.5 M | 48 h | 24.8% | 75.2% |
| N9c | 0.1 M | 20 h | 100% | 0% |
Characterization
The structure and phase transformation were measured by X-ray diffraction (XRD, Rigacu Dmax-3C, Cu Kα radiation) at a scan rate of 2° (2θ) min−1 in the range of 20–70°. The step time was 1s, adequate to obtain a good signal-to noise ratio. The average particle size was determined according to the Scherrer equation using the full-width at half-maximum (FWHM) of (101) diffraction peak with the instrument broadening being considered. The light response was examined by UV-vis diffuse reflectance spectroscopy (Shimadzu-UV3600). The measurement was performed in absorbance mode, scanning from 200 to 800 nm using a 5 nm slit. The morphology of nanoparticles such as size, shape and crystallinity was observed with a transmission electronic micrograph (TEM, JEM-2010). The surface electronic states were investigated by X-ray photoelectron spectroscopy (XPS, Perkin-Elmer PHI 5000C).Photoactivity measurement
The photocatalytic activity of each sample was evaluated in terms of degrading methylene blue (MB) dye. MB was selected as a model pollutant because it is a common contaminant in industrial wastewater and has good resistance to light degradation. A high-pressure 100 W mercury lamp and a 300 W halogen lamp (Institute of Electric Light Source, Beijing) were used as UV- and visible-light source. A Pyrex vessel was filled with circulating water to cool the reaction system. A cutoff filter was placed outside the halogen lamp to completely remove any radiation below 420 nm and to ensure illumination by visible-light. 20 mL of aqueous suspensions of MB solution (20 μM, pH = 2.5) and photocatalyst powders (0.5 g L−1) were placed in a beaker (50 mL). In the photocatalytic experiment, the reaction system was kept under constant air-equilibrated condition and maintained at 25 ± 2 °C by using a water bath before and during the irradiation. Prior to irradiation, the suspensions were magnetically stirred for 60 min under dark condition to establish an adsorption–desorption equilibrium between the dye and photocatalyst surface. The value of C/C0 was calculated to indicate the decomposition rate.Results and discussion
XRD and TEM characterization
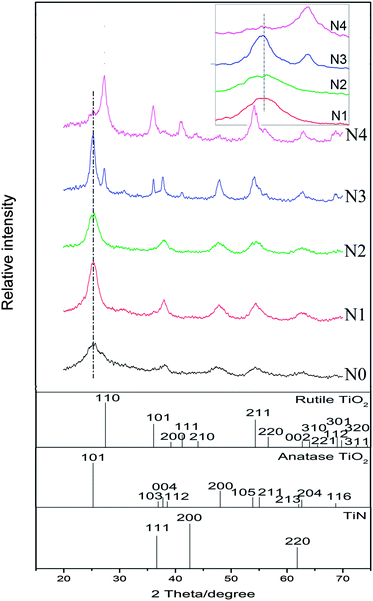
XRD patterns of the N-doped TiO2 samples is shown in Fig. 1. No obvious diffraction peaks of brookite phase (2θ = 30.8°, JCPDS 29-1360) of TiO2 crystal are detected. The state of nitrogen during hydrolysis process scarcely forms new TixNy crystal phase (see JCPDS 38-1420, 39-1015, 40-0958, et al.). The condensation and crystallization of TiO2 is confirmed by analyzing the intermediate product (N0), which was sampled after reacting for 24 h at room temperature. It should be noted that part of (101) diffraction peaks of N-doped TiO2 samples (N2–N4) shifted towards lower angles in comparison to the non-doped TiO2 (N1), which can be attributed to the slightly larger ionic radius of N than that of O (the inset in Fig. 1). The increase in this lattice parameter suggests that N atoms are doped into TiO2 crystal lattice by substituting O atoms. The weight fractions of anatase and rutile phase of TiO2 can be estimated from the peak intensity using the following equation.28 | (1) |
Under a certain HNO3 concentration (0.1 M), the influence of N doping on the particle size of TiO2 crystal is studied. The average size of anatase crystals can be calculated from the diffraction peak of (101) facet by Scherrer's equation:
 | (2) |
The influence of peptization time on the crystallization as well as phase composition of N-doped TiO2 samples is shown in Fig. 2. At the early stage of the peptization (4 h, N5), the N-doped TiO2 product exhibits relatively weaker crystallization. With extending the peptization time (up to 20 h, N6 and N3), the peak intensity of both anatase and rutile obviously increases, which suggests that the crystallization is gradually proceeding during this period. With the further increase of peptization time, such as to 36 h (N7), the intensity of the diffraction peaks of anatase decreases, while that of rutile increases, suggesting that the fraction of the rutile phase gradually increases at the expense of the anatase phase during this period. It is known that both anatase and rutile have the same fundamental structural octahedral units with edges and corners sharing in different manners. The crystal lattice of anatase consists of octahedra that share four edges and form zigzag ribbons along (221), while the octahedra in the rutile lattice only share two edges, and these edge-sharing units form linear chains parallel to (001).30,31 Barbe et al. gave evidence that hindering the aggregation of anatase particles would suppress the formation of rutile.32 Therefore, this phase transition could be explained by a growth mechanism mediated by the aggregation of anatase crystals with prolonged acid peptization.27 When the peptization time was prolonged to as long as 48 h (N8), the change in the phase composition became indistinct, indicating that the thermodynamic equilibrium must have been established between the two phases.
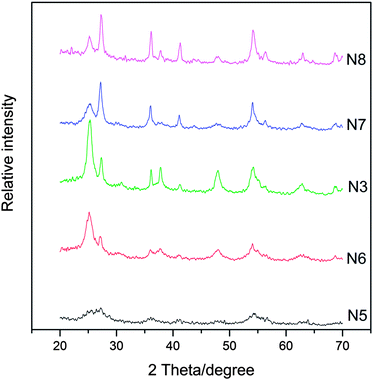 | ||
| Fig. 2 XRD patterns of samples obtained from different HNO3 peptization time (t). t = 4 h, 8 h, 20 h, 36 h, and 48 h correspond to N5, N6, N3, N7, and N8, respectively. | ||
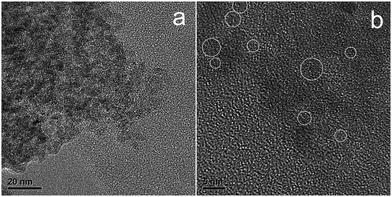
TEM images shown in Fig. 3 indicate that the N-doped TiO2 nanoparticles aggregated to form clusters with polycrystalline in nature. The size of crystals can hardly be identified from Fig. 3a because of their obscure boundary. HRTEM observation was utilized to separate these ultrafine grains according to their characteristic crystal lattice as marked in Fig. 3b. The discrete regions indicate the good dispersibility of N–TiO2 clusters with the particle size of 3–6 nm.
XPS analysis
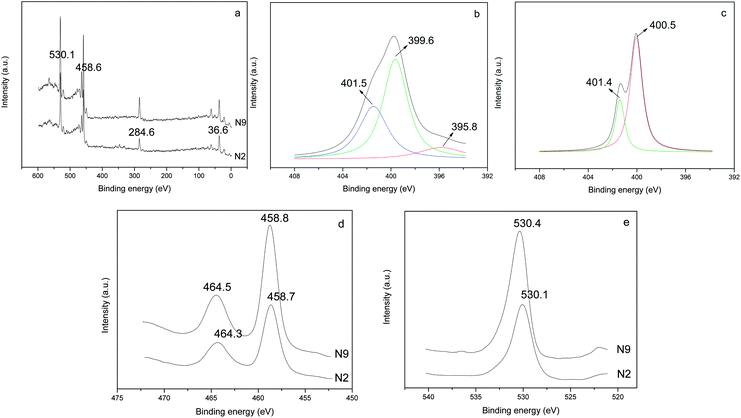
The XPS technique monitors the composition and electron binding energy of sites within a few nanometers of the surface layer (Fig. 4a). The nitrogen concentrations on the surface of N2 and N9 are 6.0% and 2.4%, respectively, indicating the higher proportion of nitrogen when introducing N-source before crystallization. During the hydrolysis of titanate, mononuclear Ti(IV) species is probably the predominant product.33 Under alkaline condition, Ti(IV) exists as an OH− coordinate polyhedron [Ti(OH)6]2−.34,35 Then the sufficient adsorption of N-source can be achieved by hydrogen bond formation between N(C2H5)3 and hydroxyl group in the first stage of N–TiO2 preparation.36 While in N9, the Ti(IV) species are kept in HNO3 solution as anionic complex of [Ti(OH)n(NO3)m]2− (n + m = 6) besides some TiO2 crystals. As the acidity in feedstock is higher, the number of OH ligand is less (i.e. the value of m is bigger), which hinders the binding of N-source on TiO2 surface. The prior bonding of N species on TiO2 surface appears to facilitate nitrogen uptake when Ti–O–Ti structure rearranges to form TiO2 crystals.The high resolution XPS spectra of the N 1s region show only one asymmetric peak with a binding energy (BE) of 395–404 eV for samples N2 and N9 (Fig. 4b and c). On deconvolution, it can be seen that the broad peak consists of three different peaks at 395.8, 399.6 and 401.5 eV in the sample N2. The rather weak peak at 395.8 eV is due to the presence of little atomic nitrogen bonded to titanium (Ti–N) in the TiO2 lattice.22,37 The dominant peak at 399.6 eV is attributed to the anionic N− in O–Ti–N linkages, suggesting the nitrogen substitutes for oxygen in an anatase matrix, which is consistent with the reported characteristics in literatures.38,39 The appearance of the peak at 401.5 eV accounts for the presence of oxidized state of N as NO or NO2 resulting from the decomposition of triethylamine molecule chemically adsorbed on the surface of TiO2 particles.37 While in the sample N9, only two peaks centered at 400.5 and 401.4 eV are detected. As revealed by Asahi et al. and Kisch et al., the BE at 400.5 eV can be assigned to molecularly chemisorbed N2 like species, which commonly coexists with the BE of N 1s at 401.4 eV.8,40 Combined with XRD analysis of the intermediate product (N0), the main reason for the absence of O–Ti–N linkages in sample N9 can be ascribed to the fact that the crystal structure of TiO2 remained unchanged before and after adding N-source since the crystallization process occurred earlier than N incorporating. The formation mechanisms of the two samples are illustrated and compared in Scheme 1.16
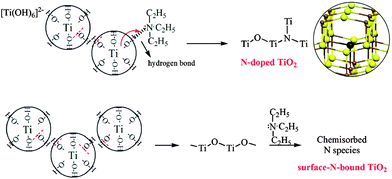 | ||
| Scheme 1 Formation mechanisms of O–Ti–N linkages and chemisorbed N2 species in samples N-doped anatase TiO2 and surface-N-bound TiO2. The partial structure of the model for substitutional N-doping in an anatase matrix is given (Ti = brown, O = yellow, N = black).16 | ||
Fig. 4d shows the high resolution XPS spectra of Ti 2p3/2 and Ti 2p1/2 regions of samples. Two peaks for sample N2 are observed at 458.7 and 464.3 eV. In contrast, the peaks for sample N9 are located at 458.8 and 464.5 eV and can be attributed to the BE of Ti 2p3/2 and Ti 2p1/2, in good agreement with the presence of Ti(IV) in pure TiO2.41 It should be noted a noticeable shift in the BE of Ti(IV) towards lower binding energy region. This indicates that the overall charge of the Ti4+ ion is slightly reduced due to the doping of N atom in the TiO2 lattice.37,38 A similar observation in N-doped TiO2 by N+ ion bombardment has been reported by Nambu et al.42 Similarly, the high resolution XPS spectra of O 1s region indicates that the BE value of O 1s are 530.1 and 530.4 eV for sample N2 and N9, respectively (Fig. 4e), suggesting the slight shift of Ti–O bonding energy in TiO2 crystal lattice after N-doping.
UV-vis diffuse reflectance spectra
The optical property of the N-doped TiO2 product is displayed in Fig. 5 along with the spectrum of non-doped TiO2 obtained from a similar process to illustrate the light absorption threshold. The band edge in the non-doped TiO2 is observed at around 390 nm, which is consistent with the bandgap of anatase. Compared to non-doped TiO2, the synthesized N-doped TiO2 exhibits strong visible-light absorption in the range of 400–500 nm, therefore it can absorb higher fraction of photons from the visible region. A lively discussion on the visible-light photoactivity of N-doped TiO2 has appeared in the literatures. Asahi et al. proposed that mixing of O 2p states with N 2p states narrowed the bandgap of TiO2 so as to cause the shift of the absorption edge to a lower energy.8 Another suggestion from Ihara et al. is that oxygen-deficient sites (below CB) are responsible for the visible-light response.43 Nakamura et al. explained that the increased light sensitivity originated from the N-induced mid-gap level, which located slightly above the top of the O 2p valence band.44 Jang and Kun et al. reported that there were two gaps in N-doped TiO2 systems.45,46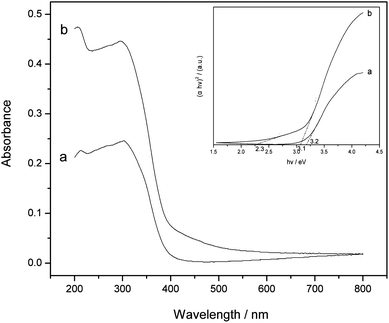 | ||
| Fig. 5 UV-vis diffuse reflectance spectra of non-doped TiO2 (a) and N-doped TiO2 (b). Inset show the Tauc plots of the corresponding samples. | ||
To explain the increased visible-light response in our system, the Tauc plots for the non-doped and N-doped TiO2 samples are displayed as the inset of Fig. 5. Band-gap estimations are carried out using this plot, which yields the values of bandgap energy (Eg) in two samples without significant difference (3.2 eV for non-doped TiO2 and 3.1 eV for N-doped TiO2). The absorption coefficient does not rise as abruptly at initial excitation energy (2.3 eV) as it does at Eg = 3.1 eV. It suggests that the light absorption in the 400–500 nm interval is not a band-to-band transition but rather is due to excitation of electrons from localized states in the bandgap to unoccupied states in the CB.16,47 That is, the formation of localized occupied states in the gap accounts for the visible light response, implying the substitution of lattice oxygen by nitrogen during the low-temperature direct nitridization process. On the other hand, a great increase of the absorption coefficient after N doping is observed, suggesting more efficient light harvesting and subsequent exploitation of e−–h+ pairs in N-doped TiO2. The largely absorbed photons in the near-surface layers will ensure the charge carriers to effectively reach the catalyst surface and participate in the photocatalytic reaction.48 Therefore, the extension of light response range as well as the increase of absorption coefficient will benefit the photogeneration of e− and h+ species, which is of great importance for the application of TiO2-based materials as they can readily be activated by visible-light or sunlight.
Evaluation of photocatalytic activity under UV-/visible-irradiation
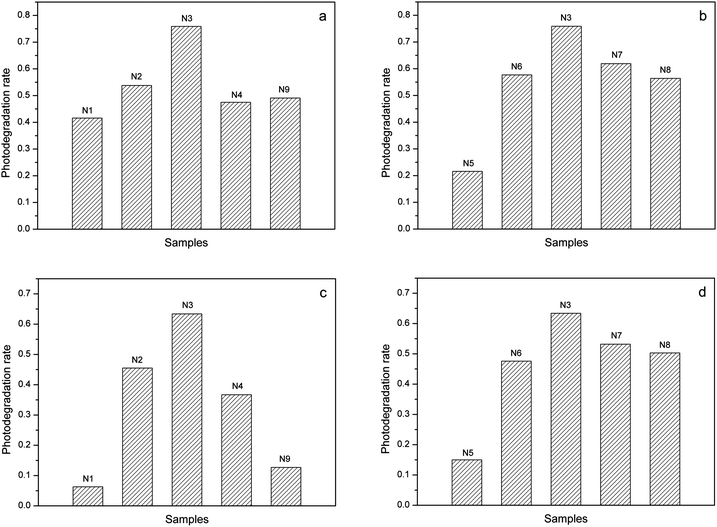
The improvement of photocatalytic activity by N doping was investigated by degrading MB dye under UV-light as well as visible-light. As shown in Fig. 6a, the photoreaction rate of N-doped TiO2 is higher than that of non-doped TiO2 under UV irradiation because of the larger absorption coefficient.48 Besides, the impregnated nitrogen atoms can inhibit the recombination of the photoinduced e−–h+ pairs and thus increase the quantum efficiency of photocatalysts. As expected, the anatase/rutile hybrid products generally exhibit better activity than pure anatase TiO2 (N2) except for the rutile-dominant sample (N4) and the weakly crystallized sample (N5) (Fig. 6a and b). On the other hand, the MB decomposition in non-doped and surface-N-bound systems (N1 and N9) is negligible under visible-light, whereas that obtained with the N-doped TiO2 materials are much higher (Fig. 6c). It reveals that the N doping in the TiO2 lattice dramatically increases the visible-light photocatalytic activity. Meanwhile, the anatase/rutile hybrid products generally exhibits better activity than pure anatase (N2) except for the rutile-dominant sample (N4) and the weakly crystallized sample (N5) (Fig. 6c and d). To mention that the sample (N3) containing 63.1% anatase possesses the highest photodegradation rate under both UV- and visible-light in our experiments. This result indicates the existence of an efficient synergistic effect in an appropriate proportion of anatase/rutile mixed phase.28,49 In general opinion, rutile is not so good a photocatalytic phase as anatase. The charge separation over the hybrid products mainly depends on the excited electrons of anatase transferring to rutile, which has slightly lower CB energy. In a hybrid where anatase holds an overwhelming majority, the rutile crystals may be surrounded with too many anatase crystals, and thus the charge transfer between these two phase is restricted. On the contrary, in a rutile-dominant system, rutile would absorb more light inhibiting the photoexcitation of anatase. Actually, the effect of N doping on the overall efficiency of anatase/rutile hybrid system is complicated, which is dependent not only on a capability of light response, but also other factors, such as the phase composition, degree of crystallinity, the number of active sites and so on.50 Therefore, the high photoactivity in a wide light range (from UV to visible) is crucial for the industrial application of the photocatalytic technology of TiO2-based materials.Conclusions
In summary, N-doped TiO2 photocatalyst has been prepared by a low-temperature process, which consists of the direct nitridization during hydrolysis of titanate and the subsequent acidic peptization. The N-doped samples with different phase composition are obtained through adjusting the acid concentration and peptization time. The as-sythesized N–TiO2 particles show good dispersibility with the size of 3–6 nm because the presence of triethylamine can prevent the TiO2 grains from aggregating in the preparation. XPS results indicate the status of N to be anion-like (N−) species and the chemical environment is N–Ti–O linkage in the TiO2 lattice with N uptaking amount of 6.0%. By comparing with the surface-N-bound sample, we confirm that the nitridization process before crystallization is crucial to the formation of N–Ti–O. The light absorption onset of N-doped sample has extended to the visible region, suggesting the bandgap narrowing of TiO2 crystals. The highest photocatalytic activity for the decomposition of MB dye is achieved with the N-doped hybrid containing 63.1% anatase in a broad range (from UV to visible light), which is of great importance for the industrial application of the photocatalytic technology.Acknowledgements
The authors thank the National Natural Science Foundation of China (no. 21001037 and 21075094), the Science Fund for Creative Research Groups (no. 20921062) for financial support, and the Special Fund of Harbin Technological Innovation talent (2013RFLXJ011).Notes and references
- H. H. Chen, C. E. Nanayakkara and V. H. Grassia, Chem. Rev., 2012, 112, 5919 CrossRef CAS PubMed.
- T. L. Thompson and J. T. Yates, Chem. Rev., 2006, 106, 4428 CrossRef CAS PubMed.
- T. Kawahara, Y. Konishi, H. Tada, N. Tohge, J. Nishii and S. Ito, Angew. Chem., Int. Ed., 2002, 41, 2811 CrossRef CAS.
- T. Kawahara, T. Ozawa, M. Iwasaki, H. Tada and S. Ito, J. Colloid Interface Sci., 2003, 267, 377 CrossRef CAS.
- S. Watson, D. Beydoun, J. Scott and R. R. Amal, J. Nanopart. Res., 2004, 6, 193 CrossRef CAS.
- D. Gumy, C. Morais, P. Bowen, C. Pulgarin, S. Giraldo, R. Hajdu and J. Kiwi, Appl. Catal., B, 2006, 63, 76 CrossRef CAS PubMed.
- D. Jiang, S. Zhang and H. Zhao, Environ. Sci. Technol., 2007, 41, 303 CrossRef CAS.
- R. Asahi, T. Morikawa, T. Ohwaki, K. Aoki and Y. Taga, Science, 2001, 293, 269 CrossRef CAS PubMed.
- S. In, A. Orlov, R. Berg, F. Garcia, S. Pedrosa-Jimenez, M. S. Tikhov, D. S. Wright and R. M. Lambert, J. Am. Chem. Soc., 2007, 129, 13790 CrossRef CAS PubMed.
- C. Di Valentin and G. Pacchioni, Catal. Today, 2013, 206, 12 CrossRef CAS PubMed.
- H. Ming, X. W. Li, L. L. Su, M. M. Liu, L. L. Jin, L. J. Bu, Z. H. Kang and J. W. Zheng, RSC Adv., 2013, 3, 3836 RSC.
- R. Y. Zheng, Y. Guo, C. Jin, J. L. Xie, Y. X. Zhu and Y. C. Xie, J. Mol. Catal. A: Chem., 2010, 319, 46 CrossRef CAS PubMed.
- X. W. Cheng, H. L. Liu, Q. H. Chen, J. J. Li and P. Wang, Electrochim. Acta, 2013, 103, 134 CrossRef CAS PubMed.
- W. Wang, C. H. Lu, Y. R. Ni, M. X. Su and Z. Z. Xu, Appl. Catal., B, 2012, 127, 28 CrossRef CAS PubMed.
- Z. Z. Zhang, Z. S. Luo, Z. P. Yang, S. Y. Zhang, Y. Zhang, Y. G. Zhou, X. X. Wang and X. Z. Fu, RSC Adv., 2013, 3, 7215 RSC.
- C. Di Valentin, G. Pacchioni, A. Selloni, S. Livraghi and E. Giamello, J. Phys. Chem. B, 2005, 109, 11414 CrossRef CAS PubMed.
- G. R. Torres, T. Lindgren, J. Lu, C. G. Granqvist and S. E. Lindquist, J. Phys. Chem. B, 2004, 108, 5995 CrossRef CAS.
- V. Etacheri, M. K. Seery, S. J. Hinder and S. C. Pillai, Chem. Mater., 2010, 22, 3843 CrossRef CAS.
- R. Rattanakam and S. Supothina, Res. Chem. Intermed., 2009, 35, 263 CrossRef CAS.
- A. Ghicov, J. M. Macak, H. Tsuchiya, J. Kunze, V. Haeublein, L. Frey and P. Schmuki, Nano Lett., 2006, 6, 1080 CrossRef CAS.
- H. Irien, Y. Watanabe and K. Hashimoto, J. Phys. Chem. B, 2003, 107, 5483 CrossRef.
- K. Kobayakawa, Y. Murakami and Y. Sato, J. Photochem. Photobiol., A, 2005, 170, 177 CrossRef CAS PubMed.
- C. Burda, Y. Lou, X. Chen, A. C. S. Samia, J. Stout and J. L. Gole, Nano Lett., 2003, 3, 1049 CrossRef CAS.
- W. Han, P. Liu, R. S. Yuan, J. C. Wang, Z. H. Li, J. D. Zhuang and X. Z. Fu, J. Mater. Chem., 2009, 19, 6888 RSC.
- J. L. Gole, J. D. Stout, C. Burda, Y. B. Lou and X. B. Chen, J. Phys. Chem. B, 2004, 108, 1230 CrossRef CAS.
- J. Y. Wang, X. J. Han, W. Zhang, Z. K. He, C. Wang, R. X. Cai and Z. H. Liu, CrystEngComm, 2009, 11, 564 RSC.
- J. Y. Wang, X. J. Han, C. Liu, W. Zhang, R. X. Cai and Z. H. Liu, Cryst. Growth Des., 2010, 10, 2185 CAS.
- M. C. Yan, F. Chen, J. L. Zhang and M. Anpo, J. Phys. Chem. B, 2005, 109, 8673 CrossRef CAS PubMed.
- J. P. Jolivet, Metal Oxide Chemistry and Synthesis: From Solution to Solid State, Wiley, West Sussex, UK, 2000, p. 83 Search PubMed.
- R. L. Penn and J. F. Banfield, Am. Mineral., 1999, 84, 871 CAS.
- Y. Li, T. J. White and S. H. Lim, J. Solid State Chem., 2004, 177, 1372 CrossRef CAS PubMed.
- C. J. Barbe, F. Arendse, P. Comte, M. Jirousek, F. Lenzmann, V. Shklover and M. Gratzel, J. Am. Ceram. Soc., 1997, 80, 3157 CrossRef CAS.
- M. G. Reichmann and A. T. Bell, Langmuir, 1987, 3, 111 CrossRef CAS.
- W. Z. Zhong, G. Z. Liu, E. W. Shi, S. K. Hua, D. Y. Tang and Q. L. Zhao, Sci. China, Ser. B: Chem., Life Sci., Earth Sci., 1994, 37, 1288 CAS.
- H. Cheng, J. Ma, Z. Zhao and L. Qi, Chem. Mater., 1995, 7, 663 CrossRef CAS.
- J. X. Yu, J. Y. Wang, J. Zhang, Z. K. He and Z. H. Liu, Mater. Lett., 2007, 61, 4984 CrossRef CAS PubMed.
- M. Sathish, B. Viswanathan and R. P. Viswanath, Appl. Catal., B, 2007, 74, 307 CrossRef CAS PubMed.
- M. Sathish, B. Viswanathan, R. P. Viswanath and C. S. Gopinath, Chem. Mater., 2005, 17, 6349 CrossRef CAS.
- B. Chi, L. Zhao and T. Jin, J. Phys. Chem. B, 2007, 111, 6189 CrossRef CAS PubMed.
- S. Sakthivel, M. Janczarek and H. Kisch, J. Phys. Chem. B, 2004, 108, 19384 CrossRef CAS.
- W. Zhao, W. H. Ma, C. C. Chen, J. C. Zhao and Z. G. Shuai, J. Am. Chem. Soc., 2004, 126, 4782 CrossRef CAS PubMed.
- A. Nambu, J. Graciani, J. A. Rodriguez, Q. Wu, E. Fujita and J. F. Sanz, J. Chem. Phys., 2006, 094706 CrossRef CAS PubMed.
- T. Ihara, M. Miyoshi, Y. Iriyama, O. Matsumoto and S. Sugihara, Appl. Catal., B, 2003, 42, 403 CrossRef CAS.
- R. Nakamura, T. Tanaka and Y. Nakato, J. Phys. Chem. B, 2004, 108, 10617 CrossRef CAS.
- J. S. Jang, H. G. Kim, S. M. Ji, S. W. Bae, J. H. Jung, B. H. Shon and J. S. Lee, J. Solid State Chem., 2006, 179, 1067 CrossRef CAS PubMed.
- R. Kun, S. Tarjan, A. Oszko, T. Seemann, V. Zollmer, M. Busse and I. Dekany, J. Solid State Chem., 2009, 182, 3076 CrossRef CAS PubMed.
- J. M. Mwabora, T. Lindgren, E. Avendano, T. F. Jaramillo, J. Lu, S.-E. Lindquist and C.-G. Granqvist, J. Phys. Chem. B, 2004, 108, 20193 CrossRef CAS.
- A. Gasparotto, D. Barreca, D. Bekermann, A. Devi, R. A. Fischer, P. Fornasiero, V. Gombac, O. I. Lebedev, C. Maccato, T. Montini, G. V. Tendeloo and E. Tondello, J. Am. Chem. Soc., 2011, 133, 19362 CrossRef CAS PubMed.
- R. J. Bickley, T. Gonzalez-Carreno, J. S. Lees, L. Palmisano and R. D. Tilley, J. Solid State Chem., 1991, 92, 178 CrossRef CAS.
- G. H. Tian, Y. J. Chen, K. Pan, D. J. Wang, W. Zhou, Z. Y. Ren and H. G. Fu, Appl. Surf. Sci., 2010, 256, 3740 CrossRef CAS PubMed.
| This journal is © The Royal Society of Chemistry 2014 |

