DOI:
10.1039/C3RA44248A
(Paper)
RSC Adv., 2014,
4, 22-31
Revised electronic structure, Raman and IR studies of AB2H2 and ABCH (A = Sr, Ba; B = Al, Ga; C = Si, Ge) phases†
Received
8th August 2013
, Accepted 22nd October 2013
First published on 29th October 2013
Abstract
Modern density functional theory (DFT) provides an extremely valuable tool for predicting structures and energetics of new materials for both finite and periodic systems. In the present work the electronic structure, chemical bonding, and spectroscopic properties of AB2H2, and ABCH (A = Sr, Ba; B = Al, Ga; C = Si, Ge) phases have been studied by state-of-the-art density-functional calculations. In contrast with the previous theoretical studies, present electronic structures calculation using hybrid B3LYP reveal that AB2H2, phases are indirect bandgap semiconductors with estimated bandgap vary from 0.324 to 0.495 eV. In general, B3LYP gives a reasonable description of the electronic structure of semiconductors, semi-ionic oxides, sulfides, transition metal oxides and the ionic oxide. Similar to the AB2H2 phases ABCH phases are also indirect bandgap semiconductors and the magnitude is much higher than for the AB2H2 phases. We have also simulated the Raman and IR spectra, and calculated the NMR related parameters such as isotropic chemical shielding, quadrupolar coupling constant, and quadrupolar asymmetry for the AB2H2, and ABCH phases.
Introduction
The current interest in the development of novel metal hydride systems are due to their potential use as a reversible hydrogen storage application at low and medium temperatures. Various aluminum based hydrides such as catalyzed sodium alanate have been recently studied for this purpose. The studies of hydrides have so far been focused on the acceleration of kinetics for the hydrogenation/dehydrogenation processes at moderate temperatures and on the increase of the weight percentage of hydrogen. So those hydrides characterized by relatively slow kinetics for hydrogenation/dehydrogenation processes and high decomposition temperature are not interesting for hydrogen economy. However, these hydrides have recently been suggested to find unique exciting applications in optoelectronics.1 But the proposed applications depend on their stability with respect to doping, solubility of shallow donors and acceptors, and electrical as well as optical properties. Furthermore, the hydrides are widely available in powder form, which is required for hydrogen storage/economy, but is not preferable for electronic device technology. For the latter applications crystalline or amorphous hydrides are more preferable. It should be noted that single crystals of SrAlSi are transformed into identically shaped crystals of the hydrogenated SrAlSiH product and they can be exposed to air and moisture without any decomposition.2
In 2000 Gingl et al. reported the synthesis and structural characterization of the novel compound SrAl2H2.3 Contrary to the alanates AmAenAloHm+2n+3o (A, Ae = alkali and alkaline-earth metal, respectively), this aluminum hydride is not fully hydrogenated and was described as a “Zintl phase hydride”. It features a two-dimensional [Al2H2]2− polyanion in which the Al atoms are arranged as a puckered graphitic layer with three nearest neighbors.3 The vacant coordination site is taken by hydrogen and the compound appears to be charge-balanced. The hydrogen content of this hydride is comparably low, and thus they may not be appropriate as hydrogen storage materials. However, if physical properties inherent to saline metal hydrides and Zintl phases can be combined in polyanionic hydride, unexpected prospects are opened and the hydride materials research is then extended beyond the traditional quest for hydrogen storage materials.2 The structure of SrAlSiH is very similar to that of SrAl2H2, half of the Al–H entities in the 2D polyanionic layer of SrAl2H2 are replaced by isoelectronic Si.2 It is important to note that superconducting AlB2-type silicides CaAlSi, SrAlSi, and BaAlSi absorb hydrogen and form semiconducting monohydrides where hydrogen is exclusively attached to Al. Similarly SrAlGe, BaAlGe, BaGaSi, and BaGaGe are also stabilized in AlB2-type structure.4,5 In general, Zintl phases are a subgroup of brittle, high melting point intermetallic compounds which are diamagnetic or exhibit temperature-independent para-magnetism, and are poor conductors or semiconductors.6 According to the electronic structure calculations SrAl2H2 and SrAlSiH have metallic and semiconducting behavior respectively.2 On the other hand present electronic structure calculations predict that SrAl2H2 is a narrow bandgap semiconductor. An essential issue in developing semiconductor devices for photovoltaics and thermoelectrics is to design materials with appropriate band gaps and with the dopant levels properly positioned with respect to the bands. Local density (LDA) and generalized gradient approximation (GGA) density functionals generally underestimate band gaps for semiconductors and sometimes incorrectly predict a metal. Hybrid functionals that include some exact Hartree–Fock exchange are known to be better, in particular B3LYP have been used successfully to describe many properties of a large variety of systems.7–9 There is therefore an interest in applying hybrid functionals to the study of the present systems. The purpose of this article is to better elucidate the electronic structure, bonding nature, Raman and IR studies of these AB2H2 and ABCH (A = Sr, Ba; B = Al, Ga; C = Si, Ge) phases in detail.
Computational details
We employed DFT based methods, in particular, CASTEP,10 as implemented in MATERIALS STUDIO 6.0 to optimize ionic positions and lattice parameters of all the compounds reported in the present article. For structural optimisation, Vanderbilt pseudopotentials11 were utilized for all atoms together with a fine mesh of k points, with the energy conversion threshold of 0.01 eV per atom, maximum displacement of 0.001 Å and maximum force of 0.03 eV Å−1, yielding high accurate energy and atomic displacements. The plane-wave cutoff energy of 600 eV is employed throughout the structural optimization calculation. The Perdew–Burke–Ernzerhof and the generalized gradient form (GGA-PBE)12 of the exchange-correlation functional were applied. The electronic properties were computed by using the hybrid B3LYP13 on the structures optimized at PBE level. Density functional perturbation theory (DFPT)14 as implemented in CASTEP10 was used for phonon calculations. For the band structure and phonon calculation we have used norm-conserving pseudopotentials with 850 eV energy cut-off for all atoms together with a 14 × 14 × 12 mesh of k points, with the energy conversion threshold of 0.01 meV per atom. The reference configurations of valence electrons for the elements were Sr: 4s2, 4p6, 5s2; Ba: 5s2, 5p6, 6s2; Al: 3s2, 3p1; Ga: 4s2, 3d10, 4s2, 4p1; Si: 3s2, 3p2, Ge: 4s2, 4p2.
Structural details
Among the AB2H2 series only SrAl2H2, BaGa2H2, and SrGa2H2 phases are known experimentally. BaAl2H2, have not been observed experimentally, as all the synthesis attempts have proven so far to be unsuccessful.15 In the present study we assume that BaAl2H2 also stabilize in a similar structure as the other iso-electronic compounds in the AB2H2 series. SrAl2H2, BaGa2H2, and SrGa2H2 are stabilizing in a hexagonal structure with space group P![[3 with combining macron]](https://www.rsc.org/images/entities/char_0033_0304.gif) m1, as shown in Fig. 1. The B atoms are arranged as puckered graphitic layers where they have three nearest A neighbors, and the vacant coordination is taken by hydrogen. Thus, hydrogen appears to act as a pair of scissors cutting covalent B–B bonds and subsequently terminating them (Fig. 1c and d). The AB2H2 hydrides are electron precise Zintl phases. This retains a (two-dimensional) polyanionic structure [B2H2]2− in the hydride with both B–B and B–H bonds and is remarkable against the alanate structures which consist of tetrahedral [AlH4] or octahedral [AlH6] entities. In AB2H2 hydrides three crystallographic sites are occupied; A in 1a, B in 2d and one H atom located on another 2d site. The unit cell contains only one formula unit, i.e., AB2H2. Each B atom is surrounded by one H atom and three B atoms at the equilibrium volume. The B atoms are making a network (6 rings) along the ac plane and this structure can be considered as a layered structure as shown in Fig. 1c. Due to the H–H repulsive interaction of the negatively charged H ions, the networks are well separated. The A atoms are located in a sandwich-like manner in the space between these nets. Each A atom is surrounded by six H atoms.
m1, as shown in Fig. 1. The B atoms are arranged as puckered graphitic layers where they have three nearest A neighbors, and the vacant coordination is taken by hydrogen. Thus, hydrogen appears to act as a pair of scissors cutting covalent B–B bonds and subsequently terminating them (Fig. 1c and d). The AB2H2 hydrides are electron precise Zintl phases. This retains a (two-dimensional) polyanionic structure [B2H2]2− in the hydride with both B–B and B–H bonds and is remarkable against the alanate structures which consist of tetrahedral [AlH4] or octahedral [AlH6] entities. In AB2H2 hydrides three crystallographic sites are occupied; A in 1a, B in 2d and one H atom located on another 2d site. The unit cell contains only one formula unit, i.e., AB2H2. Each B atom is surrounded by one H atom and three B atoms at the equilibrium volume. The B atoms are making a network (6 rings) along the ac plane and this structure can be considered as a layered structure as shown in Fig. 1c. Due to the H–H repulsive interaction of the negatively charged H ions, the networks are well separated. The A atoms are located in a sandwich-like manner in the space between these nets. Each A atom is surrounded by six H atoms.
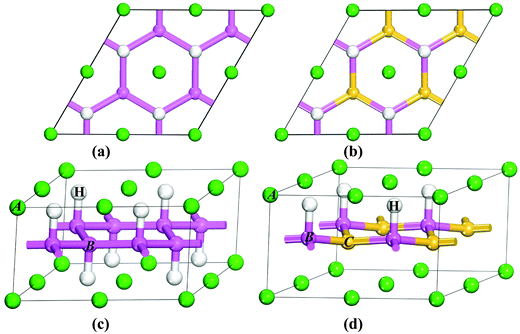 |
| | Fig. 1 Crystal structures of trigonal AB2H2 (a and c) and ABCH (b and d) (A = Sr, Ba; B = Al, Ga; C = Si, Ge): viewed along [001] (a and b) and [110] (c and d). The atomic label for the different kinds of atoms is given in the illustration. | |
The structure of ABCH (for example SrAlSiH) is very similar to that of AB2H2 series (see Fig. 1b and d) half of the B–H entities in the 2D polyanionic layer of AB2H2 are replaced by C atoms. This replacement occurs in a completely ordered way, that is, each C atom is surrounded by three B–H entities and vice versa. The center of inversion present in AB2H2 is lost in ABCH and the space-group symmetry is reduced to P3m1. The most conspicuous difference between the two structures is that the A atom in ABCH is only coordinated by three H atoms. Both compounds possess electron-precise polyanions [B2H2]2− and [BCH]2− with structures in accordance with the Zintl concept.
Results and discussion
In our theoretical simulation, we have relaxed the atomic positions and c/a globally using force-minimization technique fixed to experimental volume. Then the theoretical equilibrium volume is determined by varying the cell volume within ±10% of experimental volume. For the BaAl2H2 phase we have used the BaGa2H2 structural details are as an input and the forces as well as stress are relaxed globally. Finally the calculated energy versus volume data are fitted into the universal-equation-of-state fit and the equilibrium cell parameters are extracted. The theoretically obtained structural parameters and the positional parameters are presented along with experimental data in Table 1 and Table 2 (complete optimized structures are given in Table S1 and S2†) for AB2H2 and ABCH, respectively. From these tables it is clear that the equilibrium structural parameters obtained from our theoretical calculations are in very good agreement with the corresponding experimental findings. The calculated cell parameters are differing within 1.5% with the experimental values. Our computed Al–H distances in the SrAl2H2 is 1.72 Å, while the experimentally determined nearest-neighbor Al–H distances is 1.71 Å.3 The calculated Al–H distances in AB2H2 phases vary from 1.70 (in BaAl2H2) to 1.72 (in SrAl2H2) Å. Similarly, the calculated Ga–H distances in AGaCH compounds range from 1.74 (in BaGaGeH) to 1.77 Å (in SrGaSiH) are good agreement with the experimental values (see Table S3 in the ESI†). The results presented in the rest of the manuscript are based on the theoretical equilibrium lattice parameters.
Table 1 The calculated equilibrium structural parameters (a and c are in Å) and bandgap values for the AB2H2 (A = Sr, Ba; B = Al, Ga) phases
| Compound |
Cell parameters (Å) |
Position (z) |
Bandgap (Eg) |
|
B
|
H |
|
Hypothetical phase; experimentally not yet identified. Optimised atomic coordinates of all these phases are given in Table S1 in the ESI.
From ref. 3.
From ref. 32.
|
| SrAl2H2 |
a = 4.5471 (4.5253)a, c = 4.7102 (4.7214)b |
0.4598 (0.4589)b |
0.0955 (0.0976)b |
0.324 |
| SrGa2H2 |
a = 4.4479 (4.3932)c, c = 4.7057 (4.6990)b |
0.4628 (0.4656)c |
0.1013 (0.1067)c |
0.495 |
| BaAl2H2a |
a = 4.6904, c = 4.9190 |
0.4616 |
0.1157 |
0.356 |
| BaGa2H2 |
a = 4.5695 (4.5286)c, c = 4.9089 (4.8991)c |
0.4688 (0.4680)c |
0.1230 (0.1232)c |
0.404 |
Table 2 The calculated equilibrium structural parameters (a and c are in Å) and bandgap values for the ABCH (A = Sr, Ba; B = Al, Ga; C = Si, Ge) phases. The corresponding experimental values are given in parenthesisa
| Compound |
Cell parameters (Å) |
Position (z) |
Bandgap (Eg) |
|
B
|
C
|
H |
|
Optimised atomic coordinates of all these phases are given in Table S2 in the ESI.
From ref. 2.
From ref. 32.
From ref. 4.
From ref. 33.
|
| SrAlSiH |
a = 4.2971 (4.2202)b, c = 4.8902 (4.9662)b |
0.5383, (0.5403)b |
0.4465, (0.4451)b |
0.8970, (0.8916)b |
1.58 |
| SrAlGeH |
a = 4.2683 (4.2421)c, c = 4.9131 (4.9691)c |
0.5450, (0.5363)c |
0.4368, (0.4481)c |
0.8929, (0.8864)c |
1.86 |
| SrGaSiH |
a = 4.1943 (4.1881)e, c = 4.9483 (5.0025)e |
0.5422, (0.5494)e |
0.4391, (0.4444)d |
0.9000, (0.9031)d |
1.43 |
| SrGaGeH |
a = 4.2722 (4.2221)d, c = 4.9425 (4.9691)d |
0.5495, (0.5585)d |
0.4257, (0.4402)e |
0.9052, (0.9056)e |
1.40 |
| BaAlSiH |
a = 4.4004 (4.3416)e, c = 5.1958 (5.2929)e |
0.5373, (0.5346)e |
0.4568, (0.4582)e |
0.8637, (0.8643)e |
1.66 |
| BaAlGeH |
a = 4.3901 (4.3444)c, c = 5.1942 (5.2115)c |
0.5370, (0.5395)c |
0.4512, (0.4551)c |
0.8708, (0.8703)c |
1.63 |
| BaGaSiH |
a = 4.3218 (4.3015)d, c = 5.1903 (5.2703)d |
0.5375, (0.5423)d |
0.4485, (0.4555)d |
0.8744, (0.8759)d |
1.37 |
| BaGaGeH |
a = 4.4040 (4.3344)d, c = 5.1557 (5.1895)d |
0.5424, (0.5432)d |
0.4380, (0.4437)d |
0.8799, (0.8730)d |
1.06 |
Electronic structure
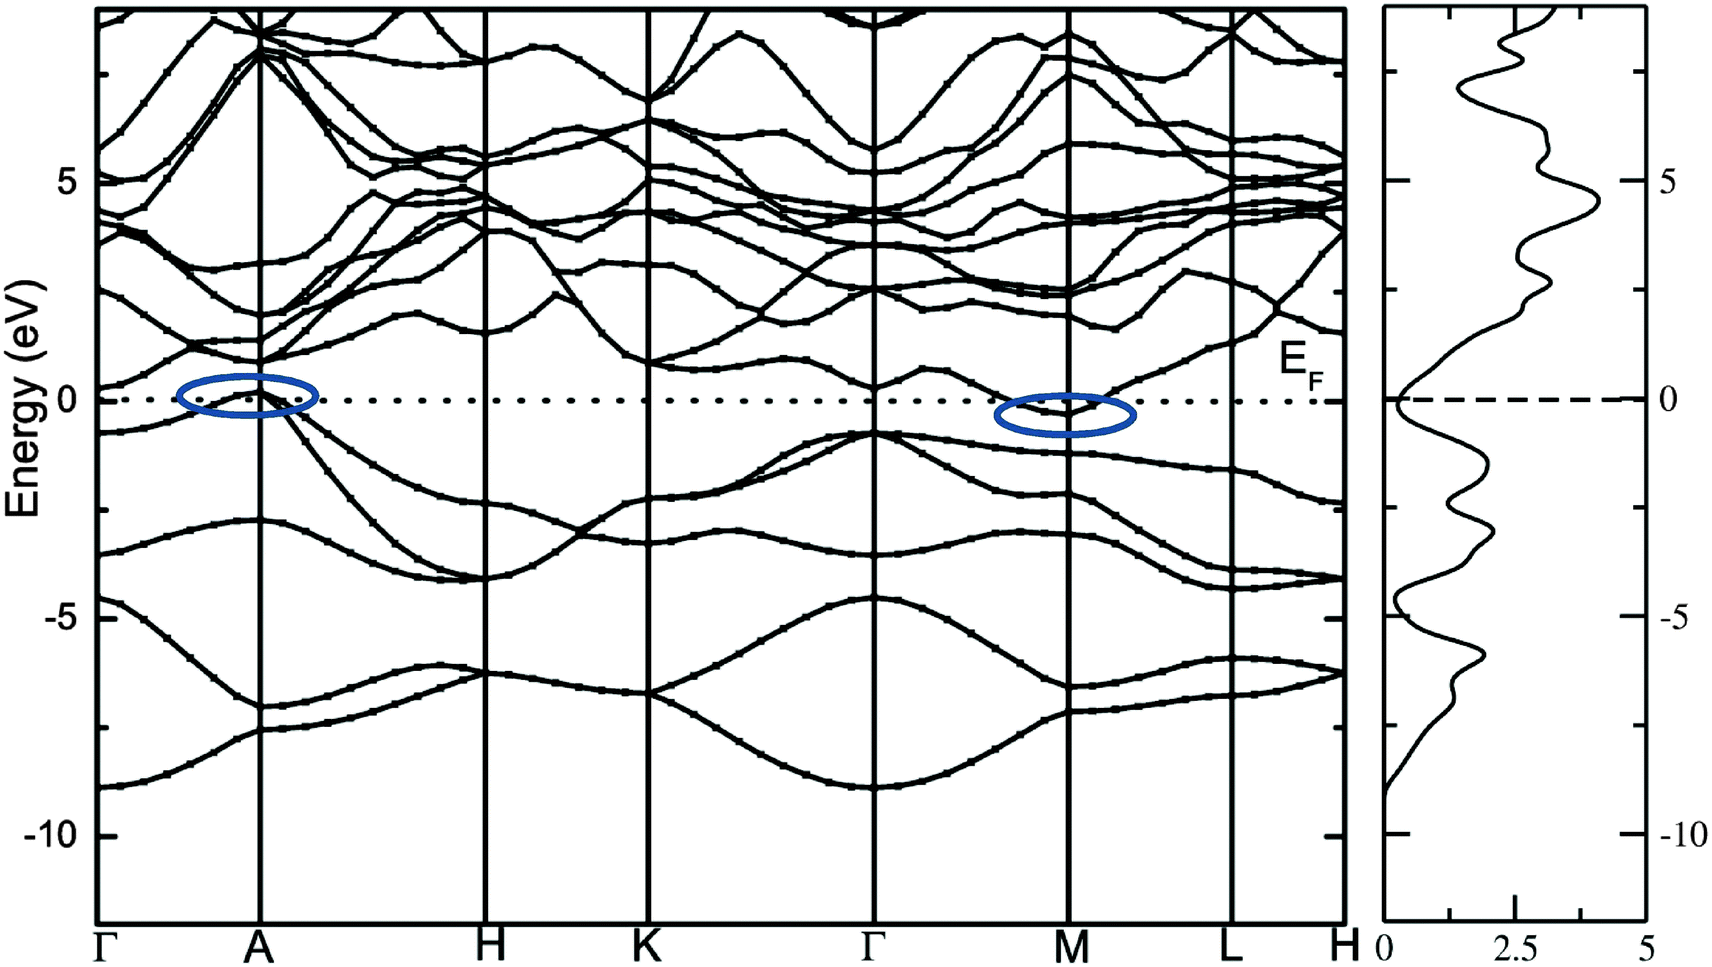
The calculated total density of states and band structure for the SrAl2H2 with GGA-PBE level is given in Fig. 2. Our calculated total DOS and band structure for the SrAl2H2 are similar to previous theoretical findings. Near the Fermi energy, there are two bands of Al-p character that stay mostly below the Fermi level, but cross along Γ–A, leading to metallic character (see Fig. 2). In particular these two bands lead to hole in the Fermi surfaces around A, which are compensated by an electron pocket around M. It is well known that the bandgap (Eg) values of solids obtained from usual DFT calculations are systematically underestimated due to discontinuity in the exchange correlation potential. Thus the calculated Eg values are commonly 30–50% smaller than those measured experimentally.16 It is commonly recognized that the theoretically calculated e.g. for semiconductors and insulators are strongly dependent on the approximations used and in particular on the exchange and correlation terms of the potential. It should be noted that in the AB2H2 compounds there is neither crossover nor nesting in between the valance band (VB) and conduction band (CB; see Fig. 2). This finding clearly indicates that the VB and CB are separated; but, due to the limitation in the computed GGA-PBE functional the Eg between the VB and CB is disappear/underestimated. On the other hand when we used hybrid B3LYP functional the obtained total DOS and band structure are almost similar to that of the GGA-PBE level but the VB and CB are separated by 0.324 eV (in SrAl2H2). In general, hybrid B3LYP functional gave more realistic bandgap value for wide range of materials. For example, CuInSe2 has a band gap of 1.04 eV, but ordinary PBE and PW91 GGA predicts e.g. = 0.01 eV (LDA yield zero band gap)17 while B3LYP gives17 0.95 eV that is very close to the experimental value.18 Furthermore for La2CuO4 B3LYP exactly reproduces the experimental bandgap value 2.0 eV.19 Theoretical and experimental studies of hydrides are mainly focused on acceleration of kinetics hydrogenation/dehydrogenation processes at moderate temperatures and on increase of the weight percentage of hydrogen. Since band gap of the compound is not the key parameter influencing on the above material properties, experimental measurements and hybrid DFT estimations of the parameter is limited and for most of the hydrides is not available. Heyd–Scuseria–Ernzerhof (HSE)20 is another hybrid functional that has been used to estimate the band gap. It should be noted that the measured optical band gap value for α-MgH2 is 5.6 eV21 which is in good agreement with B3LYP (5.38 eV22) calculation, and not far from the corresponding value calculated by HSE06 (4.58 eV).23 Similarly for the α-AlH3 phase (no experimental value is available for comparison) the calculated band gap value at GW, HSE06, and B3LYP level are 3.54,24 3.38,25 and 3.2622 respectively, thus indicating that both HSE and B3LYP functionals give similar band gap value for AlH3. Hence, we expect that the performance of the HSE functional in reproducing the band gap value for these AB2H2 and ABCH phases does not differ significantly from the B3LYP. Similarly, the other compounds in the AB2H2 series are also having non-metallic character (see Fig. 3 and Table 1). It should be noted that the calculated band structure using GGA-PBE and hybrid B3LYP functional yield almost a similar band structure except the splitting of the VB and CB (i.e., B3LYP functional just pushed away VB and CB with respect to each other). The magnitude of the Eg and band positions suggests that the AB2H2 compounds are in-direct narrow bandgap semiconductors. It is worthy to note that a similar type of isoelectronic compound CaB2H2 has also having non-metallic character.26 It is important to recall that these AB2H2 hydrides might be synthesized by first making the intermetallics followed by hydrogenation. The intermetallics can be made by arc melting although it is a little challenging since many of the components are quite volatile at high temperature. Even if these compounds are made with special techniques, it is hard to avoid the formation of impurities and secondary phases. This is the reason why the optical measurements on such type of materials are limited.
 |
| | Fig. 2 Calculated electronic band structure and total DOS of SrAl2H2 with GGA and PW91 functional. The bands crossover at the top of the valence band and bottom of the conduction band at the Fermi level is highlighted as oval shape. | |
 |
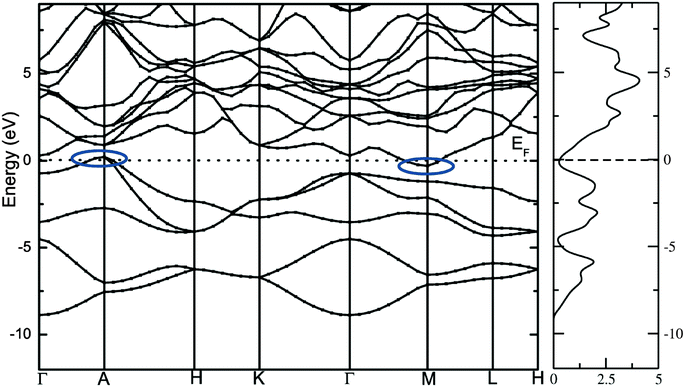
| | Fig. 3 Calculated electronic band structure of (a) SrAl2H2, (b) SrGa2H2, (c) BaAl2H2, and (d) BaGa2H2. The Fermi level is set to zero. | |
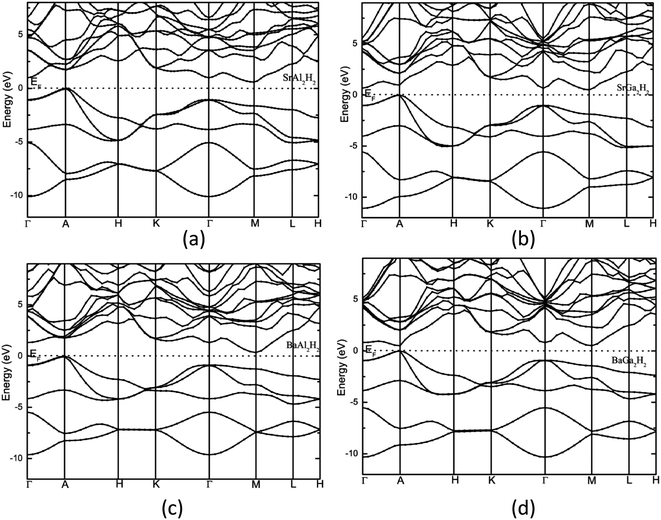
Owing to close similarity between the partial DOS (PDOS; computed using hybrid B3LYP functional) for the different members of the AB2H2 series (Fig. 4), we have documented only the findings for SrAl2H2. As seen from Fig. 4, the PDOS for Sr show very small contributions from s and p states in the VB. This demonstrates that the valence electrons are transferred from the Sr sites to the Al and H sites. The partial DOS for Al shows that the s and p states of SrAl2H2 are well separated. The energetic separation of the Al-p and H-s facilitates the ionic bonding between Al and H, an inference that is further substantiated by the charge–density and charge transfer analysis. It should be important to note that in complex hydrides the interaction between the Al–H is mixed ionic and covalent bonding. Similar to the AB2H2 series, the calculated Eg of ABCH series are indirect and ranges between 1.06 and 1.86 eV. In general, aluminium hydrides seem to yield the largest Eg for polyanionic hydrides ABCH, the ones calculated for gallium hydrides. Again our calculated Eg value with hybrid B3LYP functional for the ABCH phases is much higher than the literature value. It should be noted that the experimentally observed Eg value for the SrAlSiH phase is 0.63 eV that is ∼0.9 eV smaller than the present theoretical value. The possible reason is either the adopted theoretical approach is overestimating the bandgap value or the measured sample might have considerable impurities. As we noted in the previous para ordinary PBE always underestimate the bandgap. On the other hand, for the SrAlSiH compound the calculated Eg using ordinary PBE yields a value of 0.65 eV (for the PBE and B3LYP calculations a similar structural parameters was used), that is little higher than the experimentally observed one. In addition, the measured room-temperature resistivity of SrAlSiH is about 110 Ω cm,2 which is much higher than the intrinsic room-temperature resistivity of Ge (46 Ω cm; bandgap of 0.73 eV). Hence, one can expect higher bandgap value in SrAlSiH. In order to compare/validate our results independent optical measurements are required on these phases.
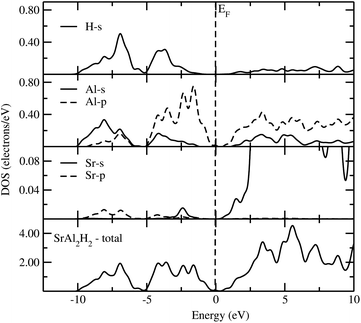 |
| | Fig. 4 Calculated total and partial DOS of SrAl2H2 using B3LYP functional. The Fermi level is set at zero energy and marked by the vertical dotted line. | |
Spectroscopic studies
In general, the prepared samples from various methods often contain more than one phase (mixed phases), impurities, etc., and in such situations we can use the theoretically simulated spectra such as Raman and IR to distinguish different phases within the sample. So, the theoretical studies on spectroscopic properties of materials will be complementary to experimental studies to characterize contaminated or multiphase samples. In connection with that we have simulated the Raman and IR spectra and NMR related parameters like isotropic chemical shielding (σiso), quadrupolar coupling constant (CQ), and quadrupolar asymmetry parameter (ηQ) for AB2H2 and ABCH phases. Due to the symmetry changes both AB2H2 and ABCH phases have considerably different Raman and IR spectra. According to the symmetry analysis (crystal point group) the optical modes at the Γ point can be classified into the following symmetry species for AB2H2 (Pm1) and ABCH (P3m1):
| ΓAB2H2 = 2A1g(R) + 2Eg(R) + 3A2u(I) + 3Eu(I) |
| ΓABCH = 4A1(R) + 4E(R) + 4A1(I) + 4E(I) |
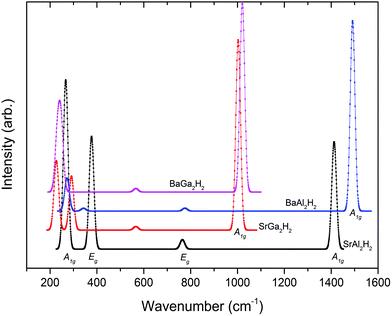
where the notations of R and I mean Raman active mode and IR active mode, respectively. The letter A and E denotes the main displacements along z (stretching) and in-plane xy (bending), respectively. According to the symmetry analysis there are 4 Raman and 6 IR active modes for space group Pm1, among them, only 4 IR modes are visible (higher intensity) for the AB2H2 phases. Similarly for the space group P3m1 there are 8 Raman and 8 IR modes are active among them 6 Raman and 6 IR modes are visible (higher intensity) for the ABCH phases. Theoretically simulated Raman and IR spectra for AB2H2 are shown in Fig. 5 and Fig. 6 respectively. The frequencies at the Γ point for the AB2H2 and ABCH phases are summarized in Table 3. One can download the simulated Raman and IR spectrum (both frequency and intensity) for these phases from our DFTBD web site.22 The calculated Raman and IR spectra of AB2H2 and ABCH phases consist of three well separated regions; internal [Al–H/Ga–H] stretching (region1: frequency from 875 to 1500 cm−1 in both Raman and IR spectra) and bending (region2: 550 to 800 cm−1 in Raman; 350 to 850 cm−1 in IR) modes are clearly separated from external lattice modes (region3: bellow 300 cm−1 in both IR and Raman spectra). It may be noted that similar type of theoretical finding using direct method shows that for NaAlH4 the calculated Raman frequencies are in good agreement with the experimental values within 5% error.27,28 In general the calculated Raman active phonon frequency values are underestimated compared with corresponding experimental frequencies. In the simulated IR spectra (see Fig. 6) we have not identified any imaginary frequency for the AB2H2 and ABCH phases, thus indicating that all the studied phases are ground-state structures for these systems, or at least they are dynamically stable.29 In particular according to our calculations, the BaAl2H2 phase, that has been not yet identified experimentally, might be stabilize in Pm1. Hence, we need experimental verification to confirm our prediction.
 |
| | Fig. 5 Theoretically simulated Raman spectra for the AB2H2 phases at ambient conditions. | |
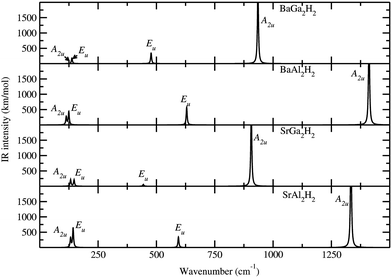 |
| | Fig. 6 Theoretically simulated IR spectra for the AB2H2 phases at ambient conditions. The corresponding modes are marked in the IR peak. | |
Table 3 The calculated Raman and IR frequency (in cm−1) for the modes at the Γ point of the Brillouin zone for AB2H2 and ABCH (A = Sr, Ba; B = Al, Ga; C = Si, Ge) phases
| Compound |
Raman active modes |
IR active modes |
|
From ref. 34.
From ref. 35.
From ref. 36.
|
| SrAl2H2 |
A
1g: 267, 1412. Eg: 377, 765 |
A
2u: 132, 1333. Eu: 143, 593 |
| SrGa2H2 |
A
1g: 223, 1003. Eg: 291, 564 |
A
2u: 161, 898. Eu: 176, 351 |
| BaAl2H2 |
A
1g: 272, 1491. Eg: 343, 776 |
A
2u: 108, 1406. Eu: 124, 623 |
| BaGa2H2 |
A
1g: 231, 1020. Eg: 246, 566 |
A
2u: 168, 934. Eu: 141, 410 |
| SrAlSiH |
A
1: 154, 231, 1233. E: 150, 422, 819 |
A
1: 154, 231, 1233 (1211a, 1220b). E: 150, 422, 819 (870a) |
| SrAlGeH |
A
1: 112, 216, 928. E: 122, 351, 557 |
A
1: 112, 216, 918. E: 122, 351, 557 |
| SrGaSiH |
A
1: 134, 191, 786. E: 123, 342, 582 |
A
1: 134, 191, 786. E: 123, 342, 582 |
| SrGaGeH |
A
1: 110, 147, 809. E: 111, 244, 547 |
A
1: 110, 147, 809. E: 111, 244, 547 |
| BaAlSiH |
A
1: 130, 224, 1278. E: 129, 378, 818 |
A
1: 130, 224, 1278 (1220c). E: 129, 378, 818 |
| BaAlGeH |
A
1: 100, 199, 1306. E: 110, 321, 809 |
A
1: 100, 199, 1306 (1240b). E: 110, 321, 809 |
| BaGaSiH |
A
1: 122, 170, 1119. E: 110, 317, 840 |
A
1: 122, 170, 1119. E: 110, 317, 840 |
| BaGaGeH |
A
1: 96, 127, 1152. E: 97, 226, 789 |
A
1: 96, 127, 1152. E: 97, 226, 789 |
The computation method for the NMR related parameters are well described in our previous article.28 The calculated values of σiso, CQ, and ηQ for both AB2H2 and ABCH phases are displayed in Table 4. The calculated σiso value for Sr atom scatters between 2725 and 4912 ppm, for the Ba atom scatters between 4823 and 5185 ppm, for Al atom scatters from 298 to 463, for Ga atom scatters from 803 to 1136, for Si atom scatters from 387 to 544 and for Ge atom scatters from 763 to 1808 ppm. It should be noted that the calculated σiso values cannot be compared directly to the experimental values, because, the calculated values correspond to absolute chemical shielding, whereas, most experimental σiso values are usually reported with shifts relative to a known standard. However, the direct comparison between experiment and theory can be made on comparative shifts between the different peaks. Similarly, the CQ and ηQ values are also scattered in wide range (see Table 4) and these values are directly comparable with experimental values. From Table 4 it is evident that the calculated and experimentally observed CQ value for Al in the SrAlSiH phase is in good agreement with each other. In general, the theoretically predicted values are always lower than the experimental values for the CQ and ηQ. It should be noted that present type of approach is not suitable for metallic systems (for more details, see ref. 30). In general, the NMR parameters are strongly related to the atomic environment (near neighbors) and quadrupolar coupling constants are directly related to the bond strength and the anisotropy in the charge density distribution around the probe nuclei. For example, due to the local environment change the calculated CQ value for Al in the SrAlSiH is higher than that in the SrAl2H2. We believe that the present study can motivate experimentalists to perform NMR measurements for the AB2H2 and the ABCH phases.
Table 4 Computed NMR parameters such as isotropic chemical shielding (σiso; in ppm), quadrupolar coupling constant (CQ; in MHz), and quadrupolar asymmetry (ηQ) parameters for AB2H2 and ABCH (A = Sr, Ba; B = Al, Ga; C = Si, Ge) phases
| Compound |
NMR |
|
σ
iso (ppm) |
CQ (MHz) |
|
From ref. 2.
|
| SrAl2H2 |
Sr: 2894, Al: 463 |
Sr: 9.6, Al: 6.9 |
| SrGa2H2 |
Sr: 4912, Ga: 803 |
Sr: 1.8, Ga: 9.5 |
| BaAl2H2 |
Ba: 5185, Al: 407 |
Ba: 23.5, Al: 6.7 |
| BaGa2H2 |
Ba: 4823, Ga: 834 |
Ba: 23.7, Ga: 8.8 |
| SrAlSiH |
Sr: 2766, Al: 363, Si: 544 |
Sr: 18.6, Al: 7.2 (7.5a), Si: 22.2 |
| SrAlGeH |
Sr: 2773, Al: 344, Ge: 1808 |
Sr: 17.7, Al: 7.7, Ge: 9.9 |
| SrGaSiH |
Sr: 2725, Ga: 1136, Si: 391 |
Sr: 24.3, Ga: 13.4, Si: 65.7 |
| SrGaGeH |
Sr: 2759, Ga: 852, Ge: 763 |
Sr: 22.8, Ga: 9.4, Ge: 26.4 |
| BaAlSiH |
Ba: 5036, Al: 313, Si: 418 |
Ba: 20.8, Al: 7.2, 31.7 |
| BaAlGeH |
Ba: 5062, Al: 289, Ge: 1458 |
Ba: 21.5, Al: 7.5, Ge: 14.9 |
| BaGaSiH |
Ba: 4980, Ga: 943, Si: 387 |
Ba: 25.3, Ga: 8.0, Si: 79 |
| BaGaGeH |
Ba: 4978, Ga: 892, Ge: 252 |
Ba: 27.6, Ga: 8.4, Ge: 33.2 |
Chemical bonding
The AB2H2 and the ABCH phases exhibit similar features and therefore we only document the charge density and the charge transfer plots (charge density difference between the crystalline – superposed atomic charge density) for SrAl2H2 and SrAlSiH. Fig. 7a–d shows the charge-density distribution at the Sr, Al, Si and H sites, from which it is evident that the highest charge density resides in the immediate vicinity of the nuclei. Further, the spherical charge distribution shows that the bonding interactions between Sr–H and Sr–Al have predominantly ionic character. On the other hand, the interactions between Al–H, Al–Al and Al–Si are rather directional. The substantial difference in the electro-negativity between Sr and Al/H suggests the presence of strong ionic character (i.e., the Sr valence electrons transferred to the H/Al sites) and the small difference in the electronegativity between Al and H suggests the presence of strong covalent character. The polar character of both compounds is revealed in the charge transfer map, which clearly shows the charge depletion around Sr and accumulation between the Al–Al/Si–Al and H atoms. Concerning the Al–H bond, charge transfer plot (Fig. 7e–h) suggests substantial charge accumulation around the position of the H.
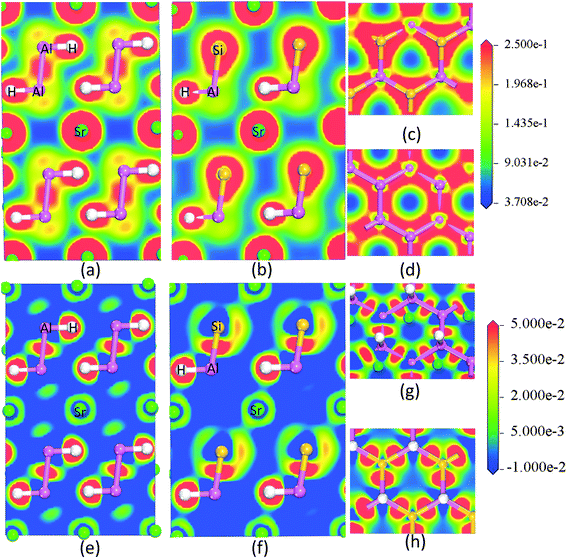 |
| | Fig. 7 The calculated valence electron charge density distribution (a, b, c and d) and charge transfer plot (e, f, g and h) for the SrAl2H2 and SrAlSiH phase in [111] plane. | |
In order to quantify the bonding and estimate the amount of electrons on and between the participating atoms we have made Mulliken-population analysis. Although there is no unique definition to identify how many electrons are associated with an atom in a molecule or an atomic grouping in a solid, it has nevertheless proved useful in many cases to perform population analyses.31 However, the method is more qualitative than quantitative, providing results that are sensitive to the atomic basis. The calculated Mulliken charges are reported in Table 5 for AB2H2 and ABCH phases. For the studied AB2H2 and ABCH phases the Mulliken effective charge (MEC) value for the A site is around +1e, B site is around −0.2e, and H is around −0.3e. This finding is consistent with the charge density analyzes and the magnitude of the MEC shows that A does not completely donate its two valence electrons to the B/C and H atoms, which is much smaller than that in a pure ionic picture.
Table 5 Mulliken-population charge density analysis and bond overlap population (BOP) for AB2H2 and ABCH (A = Sr, Ba; B = Al, Ga; C = Si, Ge) phases. The Mulliken-effective charges (MEC) are given in terms of e
| Compound |
MEC |
BOP |
| SrAl2H2 |
Sr: 1.17, Al: −0.26, H: −0.32 |
2.2 (Al–Al), 0.62 (Al–H), 0.11 (Sr–H) |
| SrGa2H2 |
Sr: 1.01, Ga: −0.22, H: −0.29 |
1.36 (Ga–Ga), 0.49 (Ga–H), 0.22 (Sr–H) |
| BaAl2H2 |
Ba: 1.19, Al: −0.25, H: −0.34 |
2.17 (Al–Al), 0.61 (Al–H), 0.04 (Ba–H) |
| BaGa2H2 |
Ba: 1.05, Ga: −0.22, H: −0.30 |
1.10 (Ga–Ga), 0.40 (Al–H), 0.23 (Ba–H) |
| SrAlSiH |
Sr: 1.05, Si: −0.74, Al: 0.06, H: −0.37 |
2.34 (Al–Si), 0.6 (Al–H), 0.1 (Sr–H) |
| SrAlGeH |
Sr: 0.91, Al: 0.08, Ge: −0.6, H: –0.37 |
1.99 (Al–Ge), 0.53 (Al–H), 0.12 (Sr–H) |
| SrGaSiH |
Sr: 0.96, Ga: 0.16, Si: −0.49, H: −0.31 |
2.11 (Si–Ga), 0.48 (Ga–H), 0.13 (Sr–H) |
| SrGaGeH |
Sr: 0.94, Ga: −0.19, Ge: −0.43, H: −0.31 |
1.93 (Ga–Ge), 0.26 (Ga–H), 0.15 (Sr–H) |
| BaAlSiH |
Ba: 1.02, Al: 0.07, Si: −0.71, H: −0.37 |
2.34 (Si–Al), 0.52 (Al–H), 0.02 (Ba–H) |
| BaAlGeH |
Ba: 0.88, Al: 0.07, Ge: −0.56, H: −0.38 |
2.04 (Ge–Al), 0.58 (Al–H), 0.15 (Ba–H) |
| BaGaSiH |
Ba: 0.93, Ga: −0.12, Si: −0.49, H: −0.32 |
2.15 (Ga–Si), 0.34 (Ga–H), 0.20 (Ba–H) |
| BaGaGeH |
Ba: 0.93, Ga: −0.21, Ge: −0.40, H: −0.32 |
1.10 (Ga–Ge), 0.21 (Ga–H), 0.18 (Ba–H) |
To understand the bond strength between the constituents the bond overlap population (BOP) values are calculated on the basis of Mulliken population analysis. The BOP values can provide useful information about the bonding property between atoms. A high BOP value indicates a strong covalent bond, while a low BOP value indicates an ionic interaction. The calculated BOP values for the AB2H2, ABCH phases are displayed in Table 5 and the corresponding interatomic distances are given in Table S3.† In the AB2H2 and the ABCH phases the BOP associated with the A–H bonds vary from 0.02 to 0.23 (minimum in BaAlSiH and maximum in BaGa2H2). Similarly, the calculated BOP varies for the B–H bonds from 0.21 to 0.62 (minimum in BaGaGeH and maximum in SrAl2H2), and for the B–B bonds from 1.1 to 2.2 (minimum in BaGa2H2 and maximum in SrAl2H2), and for the B–C bonds from 1.10 to 2.34 (minimum in BaGaGeH and maximum in both SrAlSiH and BaAlSiH). These findings clearly demonstrates that the atomic size place an important role (i.e., when the atomic-size/bond-length is increased the BOP value become degrease) and one can change/tune the covalent character by introducing Si/Ga or Ge in the SrAl2H2 matrix. Our BOP study clearly indicates that the directional bonding interaction is reduced when we move from Al to Ga based phases. The possible reason is that the outermost electrons in Ga are more diffuse in nature than that in Al. In general, the bonding interaction is completely changed when we move from top to the bottom of the Periodic table; for example: the electronic structure of IVa group elements (C, Si, Ga, Sn and Pb) of the Periodic table changes from insulator-to-semiconductor-to-metal (the outermost electrons in C are less diffuse in nature than that in the Pb case). In this AB2H2 and ABCH phases, the A–H bonds have dominant ionic character, whereas the B–H, and B–B/B–C interactions have noticeable covalent character. This finding is again consistent with our charge transfer and electronegativity difference analysis. When we compare the BOP values for the different bonding interaction between atoms in AB2H2 and ABCH phases, the B–B/B–C bonding interactions are overall much stronger.
Conclusion
The electronic structure, chemical bonding, and spectroscopic properties of AB2H2, and ABCH (A = Sr, Ba; B = Al, Ga; C = Si, Ge) phases have been studied by state-of-the-art density-functional calculations. Electronic structures calculations using B3LYP reveal that the AB2H2 phases are indirect narrow-bandgap semiconductors with estimated bandgap value varying between 0.324 and 0.495 eV. Similar to the AB2H2 series, the calculated bandgap value of ABCH series are indirect and have a size between 1.06 and 1.86 eV, i.e. much higher than the AB2H2 phases. The calculated IR and NMR parameters agree very-well with the available experimental values for the SrSiAlH phase. For further experimental investigations, we have simulated the Raman and IR spectra, and calculated the NMR related parameters (isotropic chemical shielding, quadrupolar coupling constant, and quadrupolar asymmetry) for the rest of the compounds. The chemical bonding character of these phases is analysed using DOS, charge density, charge transfer, and Mulliken population and found that the interactions between B–B/B–C and B–H have dominant covalent character and while interaction between A–H is dominantly ionic.
Acknowledgements
The authors gratefully acknowledge the Research Council of Norway (Grant no: 143408) for financial support. PV acknowledges the Research Council of Norway for providing the computer time at the Norwegian supercomputer facilities (Abel.uio.no) and Dr. M. F. Iozzi for fruitful discussions.
References
- S. Z. Karazhanov, A. G. Ulyashin, P. Ravindran and P. Vajeeston, Europhys. Lett., 2008, 82, 17006 CrossRef.
- T. Bjorling, D. Noreus, K. Jansson, M. Andersson, E. Leonova, M. Eden, U. Halenius and U. Haussermann, Angew. Chem., Int. Ed., 2005, 44, 7269–7273 CrossRef PubMed.
- F. Gingl, T. Vogt and E. Akiba, J. Alloys Compd., 2000, 306, 127–132 CrossRef CAS.
- M. J. Evans, G. P. Holland, F. J. Garcia-Garcia and U. Haeussermann, J. Am. Chem. Soc., 2008, 130, 12139–12147 CrossRef CAS PubMed.
- M. J. Evans, Y. Wu, V. F. Kranak, N. Newman, A. Reller, F. J. Garcia-Garcia and U. Häussermann, Phys. Rev. B: Condens. Matter Mater. Phys., 2009, 80, 064514 CrossRef.
-
S. C. Sevov, Zintl Phases in Intermetallic Compounds, Principles and Practice: Progress, John Wiley & Sons. Ltd., Chichester, England, 2002, pp. 113–132 Search PubMed.
- S. Kümmel and L. Kronik, Rev. Mod. Phys., 2008, 80, 3–60 CrossRef.
- M. Marsman, J. Paier, A. Stroppa and G. Kresse, J. Phys.: Condens. Matter, 2008, 20, 064201 CrossRef CAS PubMed.
- J. Paier, M. Marsman and G. Kresse, J. Chem. Phys., 2007, 127, 024103 CrossRef PubMed.
- S. J. Clark, M. D. Segall, C. J. Pickard, P. J. Hasnip, M. I. J. Probert, K. Refson and M. C. Payne, Z. Kristallogr., 2005, 220, 567–570 CrossRef CAS.
- D. Vanderbilt, Phys. Rev. B: Condens. Matter, 1990, 41, 7892–7895 CrossRef.
- J. P. Perdew, K. Burke and M. Ernzerhof, Phys. Rev. Lett., 1996, 77, 3865–3868 CrossRef CAS.
- A. D. Becke, J. Chem. Phys., 1993, 98, 5648–5652 CrossRef CAS PubMed.
- K. Refsen, S. J. Clark and P. R. Tulip, Phys. Rev. B: Condens. Matter Mater. Phys., 2006, 73, 155114 CrossRef.
- D. Moser, U. Häussermann, T. Utsumi, T. Björling and D. Noréus, J. Alloys Compd., 2010, 505, 1–5 CrossRef CAS PubMed.
-
Theory of the Inhomogeneous Electron Gas, ed. S. Lundqvist and N. H. March, Springer, Plenum, New York, 1983 Search PubMed.
- H. Xiao, J. Tahir-Kheli and W. A. Goddard, J. Phys. Chem. Lett., 2011, 2, 212–217 CrossRef CAS.
- J. L. Shay, B. Tell, H. M. Kasper and L. M. Schiavone, Phys. Rev. B: Solid State, 1973, 7, 4485–4490 CrossRef CAS.
- J. K. Perry, J. Tahir-Kheli and W. A. Goddard, Phys. Rev. B: Condens. Matter, 2001, 63, 144510 CrossRef.
- J. Heyd, G. E. Scuseria and M. Ernzerhof, J. Chem. Phys., 2003, 118, 8207–8215 CrossRef CAS PubMed.
- J. Isidorsson, I. A. M. E. Giebels, H. Arwin and R. Griessen, Phys. Rev. B: Condens. Matter, 2003, 68, 115112 CrossRef.
-
P. Vajeeston and H. Fjellvåg, Density Functional Theory Based Database (DFTBD), http://folk.uio.no/ponniahv/Database, University of Oslo, Norway, 2013 Search PubMed.
- T. Adit Maark, T. Hussain and R. Ahuja, Int. J. Hydrogen Energy, 2012, 37, 9112–9122 CrossRef CAS PubMed.
- M. J. van Setten, V. A. Popa, G. A. de Wijs and G. Brocks, Phys. Rev. B: Condens. Matter Mater. Phys., 2007, 75, 035204 CrossRef.
- L. Ismer, A. Janotti and C. G. Van de Walle, J. Alloys Compd., 2011, 509, S658–S661 CrossRef CAS PubMed , Supplement 2.
- P. Vajeeston, P. Ravindran, B. C. Hauback and H. Fjellvåg, Int. J. Hydrogen Energy, 2011, 36, 10149–10158 CrossRef CAS PubMed.
- X. Ke, A. Kuwabara and I. Tanaka, Phys. Rev. B: Condens. Matter Mater. Phys., 2005, 71, 184107 CrossRef.
- P. Vajeeston, P. Ravindran and H. Fjellvåg, J. Phys. Chem. A, 2011, 115, 10708–10719 CrossRef CAS PubMed.
- P. Souvatzis, O. Eriksson, M. I. Katsnelson and S. P. Rudin, Phys. Rev. Lett., 2008, 100, 095901 CrossRef CAS.
- C. J. Pickard and F. Mauri, Phys. Rev. B: Condens. Matter, 2001, 63, 245101 CrossRef.
- R. S. Mulliken, J. Chem. Phys., 1955, 23, 1833 CrossRef CAS PubMed.
- V. F. Kranak, M. J. Evans, L. L. Daemen, T. Proffen, H. M. Lee, O. F. Sankey and U. Haeussermann, Solid State Sci., 2009, 11, 1847–1853 CrossRef CAS PubMed.
- M. H. Lee, M. J. Evans, L. L. Daemen, O. F. Sankey and U. Haeussermann, Inorg. Chem., 2008, 47, 1496–1501 CrossRef CAS PubMed.
- M. H. Lee, O. F. Sankey, T. Bjorling, D. Moser, D. Noreus, S. F. Parker and U. Haussermann, Inorg. Chem., 2007, 46, 6987–6991 CrossRef CAS PubMed.
- V. F. Kranak, M. J. Evans, L. L. Daemen, T. Proffen, M. H. Lee, O. F. Sankey and U. Häussermann, Solid State Sci., 2009, 11, 1847–1853 CrossRef CAS PubMed.
- L. M. H. T. Bjoerling, B. C. Hauback, T. Utsumi, D. Moser, D. Bull, D. Noreus, O. F. Sankey and U. Haeussermann, Phys. Rev. B: Condens. Matter Mater. Phys., 2008, 78, 195209 CrossRef.
Footnote |
| † Electronic supplementary information (ESI) available. See DOI: 10.1039/c3ra44248a |
|
| This journal is © The Royal Society of Chemistry 2014 |
Click here to see how this site uses Cookies. View our privacy policy here.  Open Access Article
 This Open Access Article is licensed under a