A microfluidic device for multiplex single-nucleotide polymorphism genotyping

Jing Zhua, Chunmei Qiub, Mirkó Pallaab, ThaiHuu Nguyena, James J. Russob, Jingyue Jub and Qiao Lin*a
aDepartment of Mechanical Engineering, Columbia University, New York, NY 10027, USA. E-mail: qlin@columbia.edu; Tel: +1-212-854-1906
bDepartment of Chemical Engineering, Columbia University, New York, NY, USA 10027

Received 3rd May 2013 , Accepted 6th November 2013

First published on 7th November 2013


Abstract

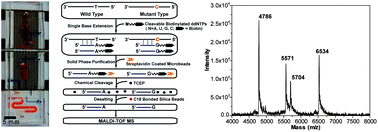
Single-nucleotide polymorphisms (SNPs) are the most abundant type of genetic variations; they provide the genetic fingerprint of individuals and are essential for genetic biomarker discoveries. Accurate detection of SNPs is of great significance for disease prevention, diagnosis and prognosis, and for prediction of drug response and clinical outcomes in patients. Nevertheless, conventional SNP genotyping methods are still limited by insufficient accuracy or labor-, time-, and resource-intensive procedures. Microfluidics has been increasingly utilized to improve efficiency; however, the currently available microfluidic genotyping systems still have shortcomings in accuracy, sensitivity, throughput and multiplexing capability. To address these challenges, we developed a multi-step SNP genotyping microfluidic device, which performs single-base extension of SNP specific primers and solid-phase purification of the extension products on a temperature-controlled chip. The products are ready for immediate detection by matrix-assisted laser desorption/ionization time-of-flight mass spectrometry (MALDI-TOF MS), providing identification of the alleles at the target loci. The integrated device enables efficient and automated operation, while maintaining the high accuracy and sensitivity provided by MS. The multiplex genotyping capability was validated by performing rapid, accurate and simultaneous detection of 4 loci on a synthetic template. The microfluidic device has the potential to perform automatic, accurate, quantitative and high-throughput assays covering a broad spectrum of applications in biological and clinical research, drug development and forensics.


1. Introduction

The successful sequencing of the human genome has offered opportunities for the interrogation of subtle genetic variations to elucidate the genetic bases of biological functions and diseases. Single-nucleotide polymorphisms (SNPs) are the most abundant type of genetic variations, with more than 10 million SNPs in public databases, occurring approximately once every 100 to 300 bases in the human genome.1 SNPs provide the genetic fingerprint of an individual, which is essential for genome-wide association studies and genetic biomarker discovery. Moreover, some SNPs are often associated with a phenotypic change or may directly contribute to disease development. For example, a somatic point mutation at codon 600 of the v-raf murine sarcoma viral oncogene homolog B1 (BRAF) gene results in an amino acid change from valine to glutamate. This mutation activates the BRAF kinase and has been associated with a variety of tumor types, particularly melanomas.2,3 In addition, it provides a cancer therapy target and has been used in patient screening to identify responsive groups to BRAF kinase inhibitors, such as vemurafenib.4 Thus, the accurate detection of SNPs is of great importance for disease prevention, diagnosis, prognosis, and prediction of drug responsiveness, and has become an indispensable tool in personalized medicine. With the increasing demand for SNP detection, there are more and more samples needed to be handled in a cost- and time-effective manner. While it is challenging, the capability to accurately process multiple different samples in parallel is becoming essential in biological applications.

A variety of biological methods have been developed for SNP genotyping, including the polymerase chain reaction-restriction fragment length polymorphism (PCR-RFLP),5 DNA hybridization,6 TaqMan,7 allele-specific ligation8 and allele-specific single-base extension (SBE),9 using detection schemes such as fluorescence detection and mass spectrometry (MS). The introduction of micro- and nanotechnology has revolutionized biological analysis, as the miniaturization of assays facilitates integration, improves speed, efficiency and accuracy, reduces labor, and provides the potential for high-throughput and point-of-care applications. Furthermore, the use of smaller sample volumes lowers reagent consumption and energy requirements, and shortens reaction cycles.10,11 Integrated with micro- and nanotechnology, a variety of genotyping microdevices have been explored. For example, the allele-specific hybridization and ligation protocols with fluorescent detection have been incorporated into a microchip for the determination of influenza virus subtypes,12 and for the discrimination of single-nucleotide mismatches.13,14 The RFLP-based microchip combined with a capillary electrophoresis separation device has also been developed to identify SNPs in the thiopurine S-methyltransferase gene.15 In addition, the TaqMan genotyping assay has been integrated into nanofluidic circuits and commercialized by Fluidigm Corporation with significant advantages over the conventional thermal cycling process.16,17 Nevertheless, optical detection has its intrinsic limitations, as optical signals for the use of detecting ultra-low abundance nucleotide variations tend to generate false-positive results, causing insufficient accuracy and sensitivity. Mass spectrometric detection is advantageous over optical detection in terms of sensitivity and accuracy, which are especially critical for detecting low frequency mutations, such as somatic mutations in tumors and mitochondrial mutations.18,19 However, the only commercially available mass spectrometric genotyping platform, the Sequenom MassARRAY®, is not integrated into an automated system, which requires substantial manual labor prior to mass spectrometric analysis, such as traditional thermocycling and manual resin purification. The manual handling of each step would not only contribute to errors, but also limit the throughput. Moreover, its multiplexing capability is also limited, as unextended primers remain in the final product and potentially overlap with extended primers targeting different polymorphic sites.20 This limitation can be overcome by introducing solid-phase purification (SPP), in which only extended primers are captured for mass spectrometric analysis, eliminating interference from the excess primers.21 Therefore, it is highly desirable to integrate SBE and SPP required for uniplex or multiplex SNP genotyping in a single microfluidic device, so that samples can be processed automatically while maintaining the high accuracy and sensitivity of MS.

To achieve this goal, we previously reported a mass spectrometric SNP genotyping method using microfluidic bead-based SBE.22 This paper further presents the development and testing of a multi-step SNP genotyping microfluidic device that additionally includes a two-step solid-phase purification scheme for solution-based SBE product, making multiplexing practically attainable. All required steps of the SNP genotyping reactions are integrated in the device, which is coupled to external instrumentation for matrix-assisted laser desorption/ionization time-of-flight mass spectrometry (MALDI-TOF MS). Experiments with uniplex and 4-plex SNP detection have demonstrated that the device is capable of accurate, rapid and automated analysis with reduced consumption of samples and reagents, and can potentially be used in high-throughput and multiplex SNP genotyping.

2. Principle, device design and fabrication

This section describes the principle, design and fabrication of our microfluidic device. We first describe the microfluidic SBE-SPP based SNP genotyping approach, and then present the device design and fabrication.

2.1. Principle of microfluidic SNP genotyping

The principle of our microfluidic SNP genotyping assay is as follows. In the SBE reaction, a locus specific primer hybridizes to the template DNA strand with its 3′ end immediately adjacent to the polymorphic site. Then, it is extended with a single dideoxyribonucleotide, bearing a biotin moiety attached via a chemically cleavable linker, complementary to the polymorphic site (Fig. 1A). Next, the extended primer is extracted by streptavidin beads packed in a microchamber (Fig. 1B). The captured primer extension product is then released from the solid phase via chemical cleavage using tris(2-carboxyethyl)phosphine (TCEP) (Fig. 1C). Finally, the released product is desalted using octadecyl carbon chain (C18) bonded silica beads in a microchannel (Fig. 1D) and detected by MALDI-TOF MS (Fig. 1E). The nucleotide at the SNP site is identified according to the mass difference between the resulting product and the original target primer.
image file: c3ra44091e-f1.tif
Fig. 1 Principle of SNP genotyping by SBE-SPP. (A) SNP specific primer is extended by a single base using ddNTPs-N3-biotin. (B) SNP specific extended primer is extracted by streptavidin coated microbeads. (C) Captured extended primer is chemically cleaved from the microbead surface. (D) The released extended primer is desalted using C18 bonded silica beads. (E) The desalted SNP specific primer is identified by MALDI-TOF MS.

2.2. Device design and fabrication

The SNP genotyping microfluidic device consists of two microchambers situated on a temperature controlled chip for SBE and SPP respectively, a microchannel for desalting, and four pressure-driven microvalves for fluidic control (Fig. 2A). The inner surfaces of the SBE microchamber (400 μm in height with an approximate 10 μL volume) are coated with Parylene C to prevent evaporative loss of reactants.23 The SPP microchamber (200 μm in height with an approximate 4 μL volume) contains dam-like structures called weirs (20 μm in height) at both ends to retain streptavidin coated microbeads (50–80 μm in diameter). The desalting microchannel (1 mm in width, 24 mm in length, and 200 μm in height with an approximate 5 μL volume) also contains weirs (20 μm in height) to retain C18 bonded silica beads (45–60 μm in diameter). The microchamber and microchannel are fully packed with streptavidin beads and C18 bonded silica microspheres, respectively. The weirs have semi-circular profiles and can be completely sealed by underlying elastomeric microvalves actuated by the oil-filled channels underneath (20 μm in height), driven by nitrogen gas. Two groups of temperature control units are integrated on the chip, each containing a serpentine-shaped thin-film temperature sensor (linewidth: 25 μm) and a resistive heater (linewidth: 300 μm) beneath the center of the SBE or SPP microchambers. Therefore, the chamber temperatures can be precisely controlled in separate closed loops using the corresponding integrated temperature sensors and heaters.
image file: c3ra44091e-f2.tif
Fig. 2 The microfluidic SBE-SPP device for SNP genotyping. (A) Planar schematic. (B) Cross-sectional schematic along line a–a′. (C) Photograph of a fabricated device. Multiple microchambers and microfluidic channels are colored in orange, and oil-filled channels that impinge upon elastomeric valves are shown in blue.

The microfluidic genotyping device is fabricated using standard MEMS technology. Briefly, metal (Cr and Au) thin films are deposited, patterned and passivated to form the micro heaters and temperature sensors on a glass chip. Next, the polydimethylsiloxane (PDMS) (Sylgard 184, Dow Corning Inc., Midland, MI) sheet bearing microfluidic features is fabricated via soft lithography, and then bonded to a thin PDMS membrane that is spin-coated onto another silicon mold defining oil-filled channels for microvalve actuation. The resulting PDMS stack is bonded to the temperature control chip, and the inner surfaces of the SBE microchamber are coated with Parylene C. Finally, streptavidin beads and C18 bonded silica microspheres are packed in the SPP chamber and desalting channel, respectively (Fig. 2B). An image of a fabricated device is shown in Fig. 2C. The detailed microfabrication procedure is shown in ESI (Fig. S1).

3. Experimental

3.1. Materials

All chemicals were purchased from Sigma-Aldrich (St. Louis, MO) unless otherwise indicated. Streptavidin beads (Pierce Streptavidin Plus UltraLink Resin) were obtained from Thermo Fisher Scientific (Rockford, IL). Deionized (DI) water was purchased from Life Technologies (Grand Island, NY). Dideoxyribonucleotide triphosphates (ddNTPs) were purchased from Jena Bioscience (Jena, Germany). Primers were synthesized by Integrated DNA Technologies (Coralville, IA). The chemically cleavable biotinylated dideoxyribonucleotide set, ddNTPs-N3-biotins (ddATP-N3-biotin, ddGTP-N3-biotin, ddCTP-N3-biotin and ddUTP-N3-biotin), was synthesized in-house as described previously,24 and their molecular weights and chemical structures are shown in ESI (Table S1 and Fig. S2). Thermo Sequenase™ was purchased from GE Healthcare (Piscataway, NJ). C18 modified reversed-phase silica microspheres were obtained from Sorbent Technologies (Norcross, GA).

3.2. Experimental setup and procedure

Closed-loop temperature control of both SBE and SPP microchambers is achieved using two separate temperature control units with a proportional-integral-derivative (PID) algorithm implemented in LabVIEW (National Instruments, TX) and a fan positioned under the temperature control chip. Each temperature control unit contains a serpentine-shaped, gold resistive temperature sensor and heater. The resistance of the two temperature sensors is measured by a digital multimeter (34410A, Agilent Technologies, CA) and a digital micro-ohmmeter (34420A, Agilent Technologies, CA), respectively. The two heaters and the fan are connected to DC power supplies (E3631, Agilent Technologies, CA) respectively (Fig. 3).
image file: c3ra44091e-f3.tif
Fig. 3 Experimental setup for microfluidic SNP genotyping by SBE-SPP.

Fluid control is achieved using microfabricated pressure-driven valves.25 Four oil-filled channels, each controlled by an air control valve (6464K16, McMaster-Carr, NJ), are connected to a nitrogen gas tank (Tech Air, NY) via a pressure regulator (CONCOA North America, VA). The microfluidic device inlets are connected to a set of five syringes that contain 50% acetonitrile (ACN), 0.1 M triethylammonium acetate buffer (TEAA), binding and washing (B&W) buffer (5 mM Tris–HCl, 0.5 mM EDTA, 1 M NaCl, and 0.01% Tween 20, pH 7.5), 100 mM TCEP (pH 9.0, adjusted with ammonium hydroxide) and DI water respectively; and the fluidic flow is regulated by syringe pumps (KD210P, KD Scientific, MA, and NE-1000, New Era Pump System, NY). The outlet is connected to a microcentrifuge tube to collect the final genotyping product for MALDI-TOF MS analysis (Fig. 3).

To conduct the microfluidic SNP genotyping, the C18 silica microspheres and streptavidin beads are first rinsed to provide an optimal binding condition. Then, the sample with target template and SBE reagent is introduced into the SBE chamber and goes through 30 thermal cycles of 94 °C for 15 s, 40 °C for 60 s and 69 °C for 30 s. Next, the SBE product is transferred into the SPP chamber and extracted under continuous flow conditions. Then, the primer extension product is released from streptavidin beads by cleaving the linker with 100 mM TCEP (pH 9.0). Finally, the cleaved and purified primer extension product is transferred to the desalting channel, where it is desalted and eluted with 2 μL of 50% ACN, and finally characterized with a Voyager DE™ MALDI-TOF mass spectrometer (Applied Biosystems®, Life Technologies, Grand Island, NY). This experimental procedure is described in detail in ESI (Fig. S3 & S4).

4. Results and discussion

This section presents and analyzes experimental results from the microfluidic SNP genotyping device. We first characterize the temperature-controlled chip and evaluate the localized heating and temporal accuracy of the temperature field in the chambers (ESI, Fig. S5). Then, characterization of SBE, and optimization of SPP, chemical cleavage and desalting are performed to investigate factors that influence the assay efficiency. Finally, the integrated uniplex and multiplex “SNP” genotyping is carried out to demonstrate the feasibility of the microfluidic device.

4.1. Characterization of single-base extension

To characterize the feasibility and efficiency of on-chip SBE reaction, a synthetic template (5′-GAAGGAGACACGCGGCCAGAGAGGGTCCTGTCCGTGTTTGTGCGTGGAGTTCGACAAGGCAGGGTCATCTAA[T with combining low line][G with combining low line][G with combining low line][T with combining low line][G with combining low line][A with combining low line][T with combining low line][G with combining low line][A with combining low line][G with combining low line][T with combining low line][C with combining low line][C with combining low line][T with combining low line][A with combining low line][T with combining low line][C with combining low line]CTTTTCTCTTCGTTCTCCGT-3′) was prepared. A primer (5′-GATAGGACTCATCACCA-3′, 5163 Da) targeting the template (annealing site underlined and italicized) was extended by a single base (ddUTP-N3-biotin) in the SBE chamber. The SBE reaction solution contained 10 pmol (334 ng) of synthetic DNA template, 40 pmol of primer, 60 pmol of ddUTP-N3-biotin (1192 Da), 1× Thermo Sequenase™ reaction buffer and 4 units of Thermo Sequenase™ in a total volume of 10 μL. After introduction to the SBE chamber, the solution was subjected to 5 thermal cycles of 94 °C for 15 s, 40 °C for 60 s and 69 °C for 30 s. Theoretically, the mass of extended primer can be calculated according to the equation me = mr + mnmb, where me is the mass of extended primer, mr is the mass of unextended primer, mn is the mass of corresponding ddNTP-N3-biotin, and mb is the mass loss upon phosphodiester bond formation (175 Da). Thus, the expected mass of the primer extension product after the SBE extension was calculated to be 6180 Da (5163 + 1192 − 175). As shown in Fig. 4, the appearance of the ddUTP-N3-biotin extension product peak at 6180 m/z and the disappearance of the primer peak at 5163 m/z indicated an efficient enzyme incorporation reaction. The use of on-chip thermal cycling also reduces the operation time. For example, 30 on-chip thermal cycles require only 60 min, as compared to 85 min for a traditional thermal cycler (Eppendorf Mastercycler® Personal). With further optimization of the microfluidic device, the number of cycles and the time for each step (denaturation, annealing and extension) can be additionally dramatically reduced. With optimal surface-to-volume ratio design, one can achieve more efficient temperature equilibration in the microchamber to enable rapid thermal response.
image file: c3ra44091e-f4.tif
Fig. 4 MALDI-TOF mass spectrum of SBE product (the peak marked with an asterisk is presumably due to the impurities in the commercial synthetic primer).

4.2. Optimization of solid-phase purification and chemical cleavage

To optimize the SPP process, various concentrations of biotinylated single-stranded DNA (ssDNA, 5163_biotin: 5′-biotin-GATAGGACTCATCACCA-3′) in 5 μL of 1× Thermo Sequenase™ reaction buffer were introduced into a streptavidin bead packed SPP microchamber at different flow rates. After capture, the beads with the biotinylated ssDNA were washed with DI water at a flow rate of 10 μL min−1 for 5 min. Waste was collected, vacuum dried and then dissolved in 5 μL of DI water. For both input and output ssDNA solutions, the UV absorbance at 260 nm were measured on a NanoDrop 2000c instrument (Thermo Fisher Scientific, Rockford, IL) using 1× Thermo Sequenase™ reaction buffer as the reference and the concentration was calculated according to the Beer–Lambert law. Approximately 30 pmol, 65 pmol and 170 pmol of ssDNA 5163_biotin in 5 μL 1× Thermo Sequenase™ reaction buffer were introduced into the SPP microchamber with streptavidin beads at 1 μL min−1, which were then washed with DI water. After SPP, the total amounts of biotinylated ssDNA not captured by the beads were all below 2 pmol (Fig. 5A). These results indicate that the binding capacity of the streptavidin beads packed in the SPP microchamber is at least 160 pmol under a constant flow rate of 1 μL min−1.
image file: c3ra44091e-f5.tif
Fig. 5 (A) Total amounts (pmol) of biotinylated ssDNA (5163_biotin) inflow and outflow from the SPP chamber at a flow rate of 1 μL min−1. (B) Total amount (pmol) of biotinylated ssDNA (5163_biotin) introduced into and obtained from the SPP chamber at different flow rates. (C) Total amount (pmol) of ssDNA (5163) inflow and outflow from the SPP channel at a flow rate of 1 μL min−1. (D) MALDI-TOF mass spectrum of released extension products from solid phase after TCEP cleavage. The average values were calculated from at least three repeated experiments, with error bars representing the standard deviation.

In another optimization experiment, we evaluated the effect of flow rate on SPP efficiency. Approximately 170 pmol biotinylated ssDNA in 5 μL 1× Thermo Sequenase™ reaction buffer was introduced into the SPP microchambers at varying flow rates of 0.2 μL min−1, 1 μL min−1, 5 μL min−1, and 20 μL min−1 respectively, followed by DI water wash. After SPP, the total amounts of biotinylated ssDNA not captured by the beads for both flow rates of 0.2 μL min−1 and 1 μL min−1 were below 2 pmol (Fig. 5B). However, at flow rates of 5 μL min−1 and 20 μL min−1, the amounts of uncaptured biotinylated ssDNA fragments increased to about 5 pmol and 13 pmol (Fig. 5B), respectively. These results imply the binding capacity of streptavidin beads packed in the SPP microchamber decreases as the flow rate increases, since the reaction time between biotin and streptavidin is reduced. Nevertheless, taking into account the operation time, 5 μL min−1 with 5 pmol loss in a total of 170 pmol is still considered an efficient binding condition.

Finally, in order to evaluate the binding specificity of streptavidin to the biotinylated DNA products, approximately 140 pmol of unbiotinylated ssDNA (5163: 5′-GATAGGACTCATCACCA-3′) in 5 μL 1× Thermo Sequenase™ reaction buffer was flowed into the SPP microchamber packed with streptavidin beads at 1 μL min−1, followed by the same DI water wash (Fig. 5C). The amount of ssDNA collected was about 126 pmol, which indicated a negligible non-specific binding of unbiotinylated ssDNA to the streptavidin beads. At faster flow rates, the non-specific binding would be even less. Given these results, we conclude that performing SPP at 5 μL min−1 is both binding- and time-efficient. At this rate, the extraction of 10 μL reaction solution could be simply achieved within 2 min, as compared to in-tube reaction, which requires constant mixing and longer reaction time.26 The microfluidic SPP device also improves sample recovery, as the physical entrapment of the beads allows extensive washing and provides a more efficient SPP process.

To characterize DNA recovery from the solid phase, the same SBE reactions were performed as described in Section 4.2 using a commercial thermal cycler (Eppendorf Mastercycler® Personal). Similarly to our previous experiments, the SBE extension products (6180 Da) were purified by streptavidin microbeads packed in the SPP microchamber. Then, 10 μL of 100 mM TCEP solution (pH 9.0) was introduced and incubated at 65 °C for 10 min. Incubation of the extension products in TCEP solution resulted in the cleavage of the linker tethering the biotin to the dideoxyribonucleotides. Theoretically, the mass of cleaved product can be calculated by the equation mp = memc, where mp is the mass of cleaved product, me is the mass of extended primer and mc is the mass change upon cleavage (476 Da). As shown in Fig. 5D, the mass peak for the extension product completely disappeared, whereas the single peak corresponding to the cleavage product appeared at 5704 m/z (6180 − 476) indicating efficient cleavage.

4.3. Optimization of desalting

It is necessary to remove salts from the cleavage solution while concentrating and purifying enough samples for mass spectrometric analysis.27 Traditionally, for small sample amounts, C18 bonded resin packed pipette tips are used, and it requires extensive manual pipetting. In contrast, a C18 bonded microspheres packed microfluidic desalting channel essentially eliminates the manual procedures and provides great potential to expand this microfluidic method for high-throughput applications using multi-channels.

To optimize the desalting process, various concentrations of ssDNA (4207: 5′-CTCTCTGGCCGCGT-3′) in 5 μL of 100 mM TCEP (pH 9.0) were introduced into the desalting channel at different flow rates, followed by a DI water wash at a flow rate of 20 μL min−1 for 10 min. Waste was collected, vacuum dried and dissolved in 5 μL of DI water. The concentrations of both input and output ssDNA solutions were measured with a NanoDrop instrument based on UV absorption using 100 mM TCEP (pH 9.0) as the reference. Approximately 20 pmol, 45 pmol and 100 pmol of ssDNA were introduced into the desalting channel at 1 μL min−1, which was then washed with DI water. After desalting, the total amounts of ssDNA not adsorbed by the C18 resin were about 1 pmole, 5 pmol and 40 pmol (Fig. 6A). These results indicate that the binding capacity of the C18 microspheres packed in the desalting channel is approximately 55 pmol under a constant flow rate of 1 μL min−1. This amount of DNA is far higher than the detection limit of MS.28 Theoretically, the binding capacity and recovery efficiency increases with a larger binding interface at a constant flow rate, which could be achieved by a larger number of C18 particles in the fixed stationary phase.29 However, this would build up back pressure due to the requirement for a longer microfluidic channel.30 On the other hand, the size of C18 microspheres is inversely proportional to the binding capacity and recovery efficiency.27 The use of larger particles would result in a lower surface-to-volume ratio due to the geometrical restriction of the microchannel. But, smaller particles also significantly contribute to the accumulation of back pressure.30 Therefore, the trade-off between channel length/particle size and binding capacity/recovery efficiency is an important design consideration.


image file: c3ra44091e-f6.tif
Fig. 6 (A) Total amount (pmol) of ssDNA (4207) introduced into and obtained from the desalting channel at flow rate of 1 μL min−1, followed by DI water wash. (B) Total amount (pmol) of ssDNA (4207) inflow and outflow from the desalting channel at different flow rates, followed by DI water wash. The average values were calculated from at least three repeated experiments, with error bars representing the standard deviation.

In addition, we evaluated the effect of flow rate on desalting efficiency. Approximately 45 pmol of ssDNA in 5 μL of 100 mM TCEP (pH 9.0) was flowed into the desalting channel at 0.2 μL min−1, 1 μL min−1, or 5 μL min−1, followed by DI water wash. After desalting, the total amounts of ssDNA not adsorbed by the C18 beads were 1 pmole, 5 pmol and 14 pmol (Fig. 6B) respectively. These results imply that the binding capacity and recovery efficiency of the C18 microspheres packed in the desalting channel decreases as the flow rate increases, since the interaction time between the analyte and stationary phase (microspheres) is reduced.29 However, lower flow rates result in longer operation time, significantly decreasing the assay efficiency. Therefore, the optimal selection of flow rate is another essential design consideration.

4.4. Uniplex and multiplex assays

Having demonstrated each functional unit of the microfluidic device, we performed the entire “genotyping” microfluidic operation (SBE, SPP, TCEP cleavage and desalting) within the fully integrated device using the same primer and template as described in Section 4.2. The mass of final product can be calculated according to the equation
 
mp = mr + mnmbmc (1)
where mp is the mass of product, mr is the mass of unextended primer, mn is the mass of corresponding ddNTP-N3-biotin, mb is the mass loss upon phosphodiester bond formation (175 Da), and mc is the mass change upon cleavage (476 Da). The nucleotide at the query “SNP” position was identified correctly as the molecular weight of the primer is 5163 Da and therefore the peak at 5704 m/z (5163 + 1192 − 175 − 476) corresponds to an extension product with ddUTP-N3-biotin after cleavage (Fig. 7A). This result demonstrates that the device is able to perform a fully integrated SNP detection as designed.

image file: c3ra44091e-f7.tif
Fig. 7 MS results for uniplex and multiplex assays: (A) MALDI-TOF mass spectrum of uniplex “SNP” genotyping product with all operations integrated. (B) MALDI-TOF mass spectrum of 4-plex “SNP” genotyping products using the microfluidic device. (C) SBE primer annealing sites and query positions. The letters highlighted in bold and yellow indicate the query positions, mimicking SNPs in a SNP genotyping assay; and the red arrow indicates the direction of primer extension. The template sequence is displayed on three lines.

To validate the multiplex genotyping capability, we used a synthetic template with 4 known positions as the query loci to mimic multiplex SNP genotyping. The SBE reaction contained 40 pmol each of the 4 SBE primers in a total volume of 10 μL. The final product masses can be calculated according to eqn (1). The primer sequences, molecular weights of primer and their potential final genotyping products are listed in Table 1, while their annealing sites are shown in Fig. 7C. As shown in Fig. 7B, nucleotides at these four sites were unambiguously identified. These results demonstrate the feasibility of using this microfluidic device for integrated and miniaturized SNP multiplex genotyping with high accuracy and sensitivity, having the potential for high-throughput and fully automated nucleotide variant detection. In addition, compared with SBE based genotyping on conventional platforms, the device employs on-chip temperature control, which allows for efficient temperature equilibration in the microchamber, significantly shortening thermal cycling times during amplification. This capability, as well as the ability to accommodate DNA fragments of multiple sizes, also provides the promise for microfluidic mini-MS sequencing, in which the fragments generated from Sanger dideoxyribonucleotide reactions are identified via MS at single nucleotide resolution, rather than by traditional gel electrophoresis and fluorescence detection.24 With the accuracy and sensitivity of MS, the device has great potential for accurate sequencing of small but highly polymorphic regions.24

Table 1 Masses of SBE primer sequences and corresponding extension productsa
Query Site (“SNPs”) Primer Sequence (5′–3′) Primer mass (Da) Mass of final genotyping product (Da)
ddATP-N3-biotin ddGTP-N3-biotin ddCTP-N3-biotin ddUTP-N3-biotin
a Note: the masses of genotyping products shown in bold and italic type refer to the expected extension products using the above template shown in Fig. 7.
a TCTCTGGCCGCGTGTCT 5144 5594 5723 5571 5685
b CTCTCTGGCCGCGT 4207 4657 4786 4634 4748
c TAGATGACCCTGCCTTGTCG 6084 6534 6663 6511 6625
d GATAGGACTCATCACCA 5163 5613 5742 5590 5704


5. Conclusion

The ability to accurately detect SNPs is critical for disease prevention, diagnosis and prognosis, and for prediction of drug response and clinical outcomes of patients. To demonstrate the critical step towards a potential high-throughput microfluidic genotyping array, this paper presents a microfluidic device that automatically performs all the required biochemical steps for multiplex SNP genotyping based on the combined SBE-SPP approach.

The device consists of two microchambers situated on a temperature control chip for respectively carrying out SBE and SPP reactions, as well as a microchannel for desalting. These functional components are connected in series by microchannels with semi-circular cross sections and can be controlled by microfabricated elastomeric valves actuated by the underlying oil-filled channels driven by pressure. Moreover, integrated temperature sensors and heaters beneath the SBE and SPP microchambers allow independent, closed-loop control of chamber temperatures. The surfaces of the SBE microchamber are coated with Parylene C to prevent sample loss during thermal cycling. Streptavidin coated microbeads and C18 bonded silica microspheres are fully packed in the SPP chamber and desalting channel respectively to extract SBE products and remove salt in preparation for MS. Due to the serial design, array-based high throughput integration can be simply achieved by parallel control of the above described individual functional units using microvalves. Hence, each of the units can carry out multiplex SNP genotyping of a single sample, and multiple samples can be processed in parallel using the array-based configuration.

The temperature control units were characterized experimentally to ensure localized and efficient heating, as well as temporal accuracy of the temperature field. We demonstrated 100% extension of primer with cleavable mass-tagged ddNTPs and efficient chemical release of purified SBE products, with shortened temperature cycling time due to higher heat transfer efficiency of on-chip temperature control, leading to improved single-base resolution and ease of product extraction. The device's capability of SPP and desalting was tested at different flow rates. The efficiency of both SPP and desalting were shown to be flow rate dependent. Although lower flow rate leads to higher capture efficiency, it also dramatically increases the total operation time for the microfluidic genotyping. Therefore, the tradeoff between the efficiency of SPP/desalting and that of the full assay is an essential design consideration. Finally, uniplex and 4-plex assays on a mock synthetic template, which mimic the SNP detection process, were carried out within the fully integrated device. The accurate detection of these “SNPs” demonstrates the feasibility of using the microfluidic device for rapid, automated, integrated and miniaturized multiplex SNP genotyping with high accuracy and sensitivity. Potentially, it can also be used for high-throughput and fully automated nucleotide variant detection and accurate indel mini-sequencing. In addition, due to the serial design, arrays of this microfluidic device can be simply achieved on single chips by concerted control of the individual functional units arrayed in parallel to allow analysis of samples from many different patients. Such array-based devices can be created essentially by the same process used to fabricate a single device unit.

Acknowledgements

We gratefully acknowledge financial support from the National Science Foundation (Award no. CBET-0854030 and NSF-CHE-11-11398) and the National Institutes of Health (Award no. RR025816-02, CA147925-01, R01NS060762 and R01HG004774).

References

  1. R. Sachidanandam, D. Weissman, S. C. Schmidt, J. M. Kakol, L. D. Stein, G. Marth, S. Sherry, J. C. Mullikin, B. J. Mortimore, D. L. Willey, S. E. Hunt, C. G. Cole, P. C. Coggill, C. M. Rice, Z. Ning, J. Rogers, D. R. Bentley, P. Y. Kwok, E. R. Mardis, R. T. Yeh, B. Schultz, L. Cook, R. Davenport, M. Dante, L. Fulton, L. Hillier, R. H. Waterston, J. D. McPherson, B. Gilman, S. Schaffner, W. J. Van Etten, D. Reich, J. Higgins, M. J. Daly, B. Blumenstiel, J. Baldwin, N. Stange-Thomann, M. C. Zody, L. Linton, E. S. Lander and D. Altshuler, Nature, 2001, 409, 928–933 CrossRef CAS PubMed .
  2. G. Bollag, P. Hirth, J. Tsai, J. Zhang, P. N. Ibrahim, H. Cho, W. Spevak, C. Zhang, Y. Zhang, G. Habets, E. A. Burton, B. Wong, G. Tsang, B. L. West, B. Powell, R. Shellooe, A. Marimuthu, H. Nguyen, K. Y. Zhang, D. R. Artis, J. Schlessinger, F. Su, B. Higgins, R. Iyer, K. D'Andrea, A. Koehler, M. Stumm, P. S. Lin, R. J. Lee, J. Grippo, I. Puzanov, K. B. Kim, A. Ribas, G. A. McArthur, J. A. Sosman, P. B. Chapman, K. T. Flaherty, X. Xu, K. L. Nathanson and K. Nolop, Nature, 2010, 467, 596–599 CrossRef CAS PubMed .
  3. P. T. C. Wan, M. J. Garnett, S. M. Roe, S. Lee, D. Niculescu-Duvaz, V. M. Good, C. G. Project, C. M. Jones, C. J. Marshall, C. J. Springer, D. Barford and R. Marais, Cell, 2004, 116, 855–867 CrossRef CAS .
  4. R. Kudchadkar, K. H. Paraiso and K. S. Smalley, Cancer J., 2012, 18, 124–131 CrossRef CAS PubMed .
  5. M. Ota, H. Fukushima, J. K. Kulski and H. Inoko, Nat. Protoc., 2007, 2, 2857–2864 CrossRef CAS PubMed .
  6. G. H. McGall and F. C. Christians, Adv. Biochem. Eng./Biotechnol., 2002, 77, 21–42 CrossRef CAS .
  7. D. Schleinitz, J. K. Distefano and P. Kovacs, Methods Mol. Biol., 2011, 700, 77–87 CAS .
  8. U. Landegren, R. Kaiser, J. Sanders and L. Hood, Science, 1988, 241, 1077–1080 CAS .
  9. R. Palacios, D. Comas, J. Elorza and P. Villoslada, J. Neuroimmunol., 2008, 203, 108–115 CrossRef CAS PubMed .
  10. Y. Zhang and P. Ozdemir, Anal. Chim. Acta, 2009, 638, 115–125 CrossRef CAS PubMed .
  11. N. Beyor, L. Yi, T. S. Seo and R. A. Mathies, Anal. Chem., 2009, 81, 3523–3528 CrossRef CAS PubMed .
  12. R. H. Liu, M. J. Lodes, T. Nguyen, T. Siuda, M. Slota, H. S. Fuji and A. McShea, Anal. Chem., 2006, 78, 4184–4193 CrossRef CAS PubMed .
  13. J. K. K. Ng, H. H. Feng and W. T. Liu, Anal. Chim. Acta, 2007, 582, 295–303 CrossRef CAS PubMed .
  14. R. D. Sochol, B. P. Casavant, M. E. Dueck, L. P. Lee and L. Lin, J. Micromech. Microeng., 2011, 21, 054019 CrossRef .
  15. J. Chowdhury, G. V. Kagiala, S. Pushpakom, J. Lauzon, A. Makin, A. Atrazhev, A. Stickel, W. G. Newman, C. J. Backhouse and L. M. Pilarski, J. Mol. Diagn., 2007, 9, 521–529 CrossRef CAS PubMed .
  16. J. Wang, M. Lin, A. Crenshaw, A. Hutchinson, B. Hicks, M. Yeager, S. Berndt, W. Y. Huang, R. B. Hayes, S. J. Chanock, R. C. Jones and R. Ramakrishnan, BMC Genomics, 2009, 10, 561 CrossRef PubMed .
  17. M. Chan, M. W. Chan, T. W. Loh, H. Y. Law, C. S. Yoon, S. S. Than, J. M. Chua, C. Y. Wong, W. S. Yong, Y. S. Yap, G. H. Ho, P. Ang and A. S. Lee, J. Mol. Diagn., 2011, 13, 305–312 CrossRef CAS PubMed .
  18. Y. He, J. Wu, D. C. Dressman, C. Iacobuzio-Donahue, S. D. Markowitz, V. E. Velculescu, L. A. Diaz, Jr, K. W. Kinzler, B. Vogelstein and N. Papadopoulos, Nature, 2010, 464, 610–614 CrossRef CAS PubMed .
  19. M. Gundry and J. Vijg, Mutat. Res., 2012, 729, 1–15 CrossRef CAS PubMed .
  20. S. Gabriel, L. Ziaugra and D. Tabbaa, Curr Protoc Hum Genet, 2009, ch. 2, unit 2 12 Search PubMed .
  21. S. Kim, H. D. Ruparel, T. C. Gilliam and J. Ju, Nat. Rev. Genet., 2003, 4, 1001–1008 CrossRef CAS PubMed .
  22. J. Zhu, M. Palla, S. Ronca, R. Wapner, J. Ju and Q. Lin, Sens. Actuators, A, 2013, 195, 175–182 CrossRef CAS PubMed .
  23. Y. S. Shin, K. Cho, S. H. Lim, S. Chung, S. J. Park, C. Chung, D. C. Han and J. K. Chang, J. Micromech. Microeng., 2003, 13, 768–774 CrossRef CAS .
  24. C. Qiu, S. Kumar, J. Guo, L. Yu, W. Guo, S. Shi, J. J. Russo and J. Ju, Anal. Biochem., 2012, 427, 193–201 CrossRef CAS PubMed .
  25. M. A. Unger, H. P. Chou, T. Thorsen, A. Scherer and S. R. Quake, Science, 2000, 288, 113–116 CrossRef CAS .
  26. C. Qiu, S. Kumar, J. Guo, J. Lu, S. Shi, S. M. Kalachikov, J. J. Russo, A. B. Naini, E. A. Schon and J. Ju, Anal. Biochem., 2012, 427, 202–210 CrossRef CAS PubMed .
  27. M. G. Pluskal, Nat. Biotechnol., 2000, 18, 104–105 CrossRef CAS PubMed .
  28. C. E. C. A. Hop and R. Bakhtiar, Biospectroscopy, 1997, 3, 259–280 CrossRef CAS .
  29. J. White, Model. Simulat. Eng, 2012, 2012, 651434 Search PubMed .
  30. T. Nguyen, R. Pei, M. Stojanovic and Q. Lin, Microfluid. Nanofluid., 2009, 6, 479–487 CrossRef CAS .

Footnotes

Electronic supplementary information (ESI) available. See DOI: 10.1039/c3ra44091e
These authors contributed equally to this paper.

This journal is © The Royal Society of Chemistry 2014