Controlling the electronic energy levels of ZnO quantum dots using mixed capping ligands
Supriya
Saha
and
Pranab
Sarkar
*
Department of Chemistry, Visva-Bharati University, Santiniketan, 731235, India. E-mail: pranab.sarkar@visva-bharati.ac.in
First published on 14th October 2013
Abstract
The surface passivation of nanocrystals with mixed ligands is an important way to enhance the performance of quantum dot based optoelectronic devices through tuning the electronic energy levels. By attaching two or three different ligands on the surface of a single nanoparticle, one can induce electric fields large enough to significantly alter the electronic and optoelectronic properties of the nanocrystals. By using the self-consistent-charge density-functional tight-binding (SCC-DFTB) method we demonstrate the tuning of the electronic energy levels of ZnO quantum dots (QDs) through exchanging the surface capping ligands. The tuning of the energy levels is largely dependent on the surface linking groups as well as on the ratio of the different passivated molecules attached on to the surface of the QDs.
1 Introduction
Semiconductor nanoparticles are attractive materials due to their wide range of applications in different fields such as optoelectronics,1,2 photo-catalysis and biological labelling. The performance of such devices can be enhanced through proper alignment of the energy levels in the nanocrystals. Since the performance of different optoelectronic devices is controlled by the band edge alignment of the nanocrystals, the detailed theoretical understanding of the electronic structure as a function of shape, size and composition is of crucial importance because it allows one to investigate both the fundamental physics and to tune the band edge alignment. Because of the high surface to volume ratio, the nanocrystal surface has a great effect on its electronic properties. Nanoparticles are capped with a surfactant layer that is necessary for their solution-based synthesis and is also pertinent to their chemical processability and stability, which is a key advantage in device production. Utilization of inorganic nanoparticles in device applications requires appropriate manipulation of their surrounding capping layer. The electronic and optical properties of these nanocrystals can be controlled by using different organic surface capping ligands as well as by controlling their shape and size.3–6 Very recently, quite a number of experimental studies have confirmed that the position of the electronic energy levels can be tuned by changing the surface linking groups or introducing two different ligands on a particular nanocrystal. The shifting of the energy levels is dependent on the dipole created between the ligand's anchor group and the surface of the nanocrystals.3,7–9 Harari et al. explored the tuning of the electronic energy level positions with respect to the vacuum level in colloidal InAs nanocrystals using surface ligand exchange.3 Gross et al., in their article showed how the efficiency of CdSe nanocrystal based solar cells can be increased through exchanging the surface passivated ligands.7 Comparelli et al.9 have shown that the optical properties of CdS QDs can be improved through ligand exchange.Among different semiconductor nanomaterials, zinc oxide (ZnO) is a promising and extensively studied material due to its interesting applications in different fields such as photo catalysts, gas sensors, piezoelectric transducers, solar cells, electroluminescent devices and ultraviolet laser diodes. Due to a wide band gap (3.37 eV) and large exciton binding energy (60 meV), ZnO has been recognized as a valuable optical material in the blue-UV region.10 There are extensive experimental as well as theoretical studies on grafting of organic molecules on two-dimensional (2D) ZnO nanoparticle surfaces as well as on ZnO QDs.11–17 However, to the best of our knowledge, theoretical studies addressing the issue of the effect of mixed capping ligands on the electronic structure of QDs are not available in the literature.
Following our previous work18 where we have shown that the electronic structure of ZnO quantum dots (QDs) can be tuned by using different surface capping ligands (–NH2, –OH and –SH), we here present results of our study on the effect of mixed capping ligands on the electronic energy levels of a particular size of ZnO QD (Zn96O96). The passivation with two ligands differing only by the anchor group (either –OH, SH or –NH2), leads to an inhomogeneous surface distribution of the ligand-induced dipole. The potential of the ligands, induces a large internal electric field, known as the quantum confinement stark effect (QCSE).7 This ligand-induced internal electric field or QCSE pulls electron and hole wave functions to different parts within the nanocrystal’s volume and hence the positions of the electronic energy levels are modified leading to a red shift or blue shift of the optical band gap depending on the nature of the ligands exchanged on the surface of the QD. In this paper we have investigated in detail the effect of mixed capping ligands on the electronic energy level positions and the electronic properties of a ZnO QD.
2 Computational details
In the present work, the tuning of the electronic structure of a particular ZnO QD via ligand exchange capping was studied by employing the self-consistent charge density-functional tight-binding (SCC-DFTB) method. The details of the method have been described elsewhere.19–24 The SCC-DFTB method being semi-empirical in nature can handle a large number of atoms and has been demonstrated to be a good compromise between accuracy and computational efficiency. In this method, the single-particle Kohn–Sham eigen functions ψi(r) are expanded in a set of localized atom-centered basis functions ϕm, with m, a compound index that takes care of the radial and angular dependence of the function. These functions are determined by self-consistent density-functional calculations on isolated atoms employing a large set of Slater-type basis functions. In this method, only two center Hamiltonian matrix elements are considered. The total energy in the SCC-DFTB method (EDFTBtot) can be expressed as a second order expansion of the DFT Kohn–Sham total energy with respect to charge density fluctuations. We thus have | (1) |
The first term of the right hand side in eqn (1) represents the sum of the energies of all occupied eigen states Ψk of the effective Kohn–Sham Hamiltonian Ĥ0. In the DFTB method, the Hamiltonian, Ĥ0 is derived by assuming that the initial electronic density of the many-atom system is the superposition of the corresponding neutral atomic charge densities (n0). The second term arises from the second-order expansion of the exchange-correlation functional with respect to charge density fluctuations21δn (the first-order terms in this expansion vanish for any arbitrary (n0)), approximated as atomic point like charges (Δq) together with an analytical interpolating function γαβ. This term is important for the present systems studied here as there are electronegativity differences among the constituent atoms of our system of study. Finally, the third term, Erep is the energy of repulsion between two atoms. Since the method outlined is a parametrized one, we performed the test of transferability to infinite periodic systems of ZnO. The detailed results of the parametrization can be found elsewhere.25 We have considered a Zn96O96 QD and have modeled these particular sized QD by cutting a spherical part of the wurtzite bulk crystal. We have chosen this particular QD because of its symmetric structure and high stability.18 We here considered three different kinds of ligands such as tri-octyl phosphine oxide (TOPO), thiol and amine-containing molecules. As the most important interaction with nanocrystals occurs through the –OH group for TOPO, –SH group for thiol and –NH2 for amine containing ligands, we considered only the –OH, –SH and –NH2 groups as passivating agents for computational reasons. We initially passivated all the surface Zn atoms (which are under co-ordinated) by either –SH, –OH or –NH2 groups, and the O atoms by H atoms and then optimized all of the passivated structures. We chose the exchanged sites of many different random substitutions and identified the energetically most favourable configuration from those. Here we only present the results of the most stable one. We have considered all probable combinations between these passivated ligands (–SH by –OH, –NH2 by –OH and –SH by –NH2). All calculations have been performed with the DFTB+ package. For geometry optimization we used the conjugate gradient algorithm until the force on each atom in all cases reduced to less than 0.001 eV Å−1.
3 Results and discussion
As the bonding interactions among a QD's surface atoms and passivating ligands are of different kinds, the stability of a passivated QD very much depends on the type of ligands. To understand how the stability of the mixed ligand capped QD is influenced by the percentage of different ligands we plotted the binding energies per atom as a function of the percentage of two different ligands in Fig. 1. The binding energies per atom of the mixed ligand capped QD is defined as the energy difference between the sum of the total atomic energies of the constituent atoms and the energy of the passivated QD divided by the total number of atoms. The figure clearly shows when the –NH2 and –SH ligands of –NH2 and –SH passivated QDs, respectively, are exchanged by –OH ligands the binding energy increases with increasing –OH concentration. The exchange of the –SH ligands of the –SH passivated ZnO QD by –NH2, increases the binding energy of the QD with increasing concentration of –NH2 ligands. Thus the exchange of a ligand containing a less electronegative element by one with a more electronegative one imparts more stability to the QD because of the obvious strong electrostatic bonding between the Zn and the passivated atoms. In this context we would like to mention that Noei et al.14 in a very recent study confirmed the co-existence of –OH, –NH2 and –NH3 groups on the ZnO surface.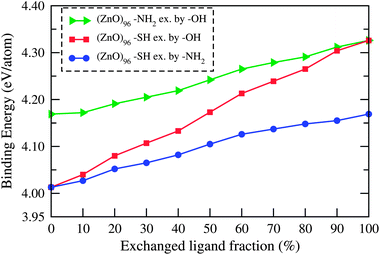 | ||
| Fig. 1 Variation in binding energy per atom of different passivated (ZnO)96 QDs as a function of the fraction (%) of different exchanged ligands. | ||
From our previous study we have seen that the passivated ZnO QDs show a clear blue shift in the absorption spectra as compared to bare QDs and the maximum blue shift occurs in –OH passivated QDs followed by –NH2 and –SH passivated QDs.18 For example, the band gap values of –OH, –NH2 and –SH passivated Zn96O96 QDs are 4.10 eV, 2.893 eV and 2.789 eV respectively. Now to see the effect of mixed capping ligands on the band gap of a ZnO QD in Fig. 2 we have shown the variation of the band gap of the ZnO QD (Zn96O96) as a function of the percentage of different surface capping ligands. From the figure we observed that when surface passivated –SH molecules are replaced by –NH2 molecules then there is a bowing effect in the band gap; first there is a increase in the gap when the fractions of exchanged –NH2 ligands are small as compared to –SH, but with an increasing percentage of –NH2 (>40%), the band gap decreases and the optical gap of the –NH2 passivated QD recovers. Thus, for the –SH passivated ZnO QD, the replacement by –NH2 initially results in a blue shift in the absorption spectra but with increasing –NH2 concentration, a red shift in absorption spectra takes place. Conversely if one replaces the –NH2 ligand by –SH, the absorption spectra initially show a red shift but with increasing –SH concentration blue shift occurs. These results indicate that, initially the mixed capping layer around the QD may create an inhomogeneous electric field inside the QD that separates the hole and electron wave functions and therefore decreases or increases the first exciton energy (red shift or blue shift). When the ligand exchange continues, the capping layer becomes more and more homogeneous. As a result the ligand induced internal electric field decreases. This decreases the internal electric field back to its original value. Our theoretical results are in good agreement with the recent experimental observation of Gross et al.7 on CdSe QDs. These authors have shown that the peak wave length passes through a minimum following the addition of a thiol (–SH) containing ligand to the amine (–NH2) capped CdSe nanocrystals. For –NH2 and –SH passivated ZnO QDs, when passivated atoms are replaced by –OH ligands a gradual blue shift occurs in the band gap. The figure also suggests that if we gradually replace the –OH ligands of –OH passivated ZnO QDs by either –NH2 or –SH ligands the band gap will be red shifted. So, our study reveals that one can tune the band gap of ZnO QDs by proper choice of mixed ligands.
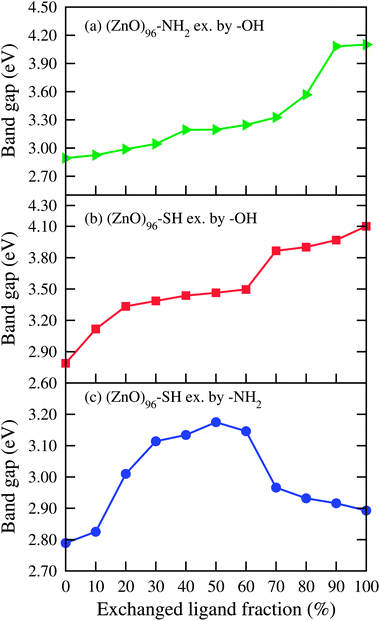 | ||
| Fig. 2 Variation in band gap of different passivated (ZnO)96 QDs as a fraction (%) of different exchanged ligands. | ||
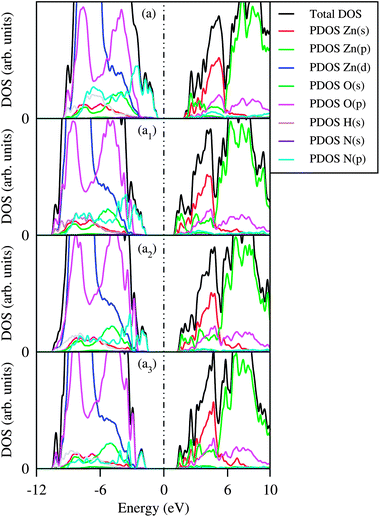
Fig. 3 represents the projected density of states (PDOS) along with the total density of states (DOS) of –NH2 passivated Zn96O96 QD and mixed ligand capped QDs passivated with different proportions of –OH and –NH2 ligands. The general feature of the DOS for the –OH and –SH combinations are more or less similar to those of the –OH and –NH2 combinations and are not shown here. From the detail inspection of PDOS one can obtain further insight into the effect of mixed capping ligands on the variation of the optical gap of the ZnO QDs. The band gap of a bare QD is always lower than that of a passivated one due to the presence of surface states in the band gap region. These surface states arise because of unsaturated dangling bonds. The saturation of surface dangling bonds by passivated atoms removes the surface states arising out of the band gap region and increases the band gap. In an earlier study18 we have seen that passivation with –OH removes the surface states in the valance band region completely and leads to a higher band gap followed by –NH2 and –SH passivated QDs. From the PDOS as presented here we found that for each of the cases the major contribution of the conduction band comes from Zn (s and p orbitals) and the passivated ligands contribute to the valence band region (mainly p orbitals of S/O/N from –SH/–OH/–NH2). When –OH ligands are replaced by –NH2 or –SH then some new states arise due to the contribution of the p orbitals of N or S atoms in the valence band region and as a result the band gap decreases gradually with the increasing percentage of exchanged ligands. The presence of trap states in the band gap region because of the passivating ligands is in conformity with other studies.26–29 When –NH2 or –SH passivated ligands are replaced by –OH ligands, then surface states that arise in the valence band region are gradually removed and shifted downward, as a result the band gap increases. So, it is expected that the photo-luminescence efficiency can be considerably enhanced by exchanging –NH2 or –SH ligands by –OH. Our theoretical result is in good agreement with the experimental observation of Comparelli et al.9 on CdS QDs. For –NH2 and –SH combinations the band gap of the QD passes through a maximum. Thus, when the percentage of –NH2 ligands is small the band gap increases reaching a maximum at a nearly 50% ratio and then decreases with increasing –NH2 concentration.
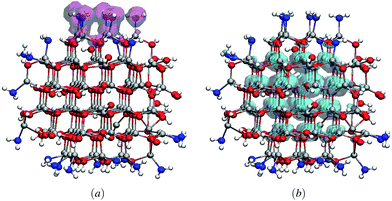
Fig. 4 represents the spatial distribution of band edge wave functions corresponding to the highest occupied and lowest unoccupied Kohn–Sham states (VBM and CBM) of one representative mixed capping Zn96O96 QD. From the figure it is evident that the VBM is concentrated on a few surface passivated atoms whereas the CBM is delocalized on the core Zn atoms. This spatial distribution of the VBM and CBM wave functions supports the nature of PDOS discussed earlier.
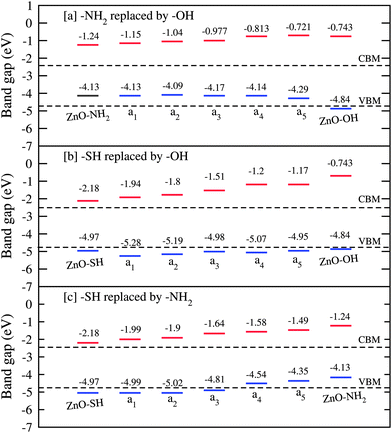
Since the relative position of the VBM and CBM of the QDs has a great impact on the characteristic properties of the final device, tuning of these energy levels through the proper choice of ligand or combination of ligands is necessary. For QD based devices, surface modification through organic capping ligands plays a significant role in the tuning of band energy alignment. In the following passages we would like to investigate the role of a mixed capping ligand in tuning the band energy alignment. In Fig. 5 we have shown the position of the VBM and CBM of different ligand passivated ZnO QDs with varying percentages, along with the VBM and CBM of a bare QD. The figure clearly reflects the fact that the replacement of one passivated ligand by another modifies the band alignments. The figure shows that the exchange of –NH2 ligands with –OH ligands in ZnO QDs shifts the CBM to higher energies with respect to the VBM and CBM energies of pure –NH2 passivated ZnO QD and also bare QD. However, the VBM energies remain almost the same with a slight decrease for QDs with a higher percentage of –OH ligands. When the –SH ligands are exchanged by –OH ligands, with an increasing concentration of –OH ligands the energies of the CBM increases sharply while those of the VBM increases slightly. The result is a sharp increase in the band gap with increasing concentration of –OH ligands. When the –SH ligands of –SH passivated ZnO QDs are exchanged by –NH2 ligands the shift of the VBM and CBM energies very much depends on the concentrations of –NH2. When the concentration of –NH2 is low the VBM appears almost at the same energy as that of the –SH passivated QD but the CBM shifts to higher energies resulting in an increase in the band gap. But after a certain –NH2 concentration both the VBM and CBM shift to higher energies but the magnitude of the shift in VBM energies is larger than that of the CBM energies and accordingly the band gap starts to decrease after that concentration. So, by controlling the concentration of two different ligands one can properly tune the position of the VBM and CBM of QDs. Our theoretical results of shifting the band edge energies corresponding to VBM and CBM are in good agreement with the experimental results of Harari et al.3 by using differential pulse voltammetry these authors have shown that VBM and CBM levels can be shifted by up to 0.3 eV for InAs QDs through ligand exchange capping.
Finally we gain some understanding of the effect of mixed passivation with three different ligands from Fig. 6 in which we have shown the variation of the band gap with varying the proportions of different ligands. The figure interestingly shows that for a fixed –SH concentration, the band gap increases with increasing –OH concentrations and decreasing –NH2 concentrations. It also reveals that for a fixed –OH concentration the band gap increases with increasing –SH concentrations and decreasing –NH2 concentrations. So, by a proper choice of the concentration of the three different ligands one can achieve more flexibility in the tunability of the band gap and accordingly the band energy alignment.
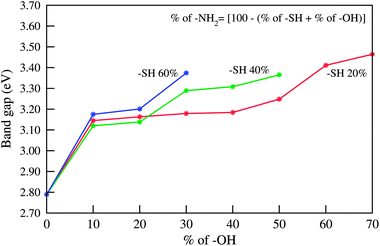 | ||
| Fig. 6 Variation in band gap of (ZnO)96 QDs for passivation with three ligands on the surface at a time. | ||
4 Conclusion
In summary, we have studied the influence of mixed capping ligands on the electronic structure of ZnO QD of a particular size and envisaged the ways for engineering the position of the energy levels. The passivation of QDs with mixed ligands generates inhomogeneous internal electric fields induced by the different dipoles associated with the different anchor groups. This induced separation between electron and hole wave functions can be harnessed to enhance the performance of nanocrystal based devices. Here we explored the variation of the band gap, projected density of states (PDOS) along with total density of states (DOS) and the relative positions of VBM and CBM of a particular size of ZnO QD with different combinations of ligands viz. –OH, –SH and –NH2. We found that the variation of band gap values is very much dependent on the ratio of two (three) ligands and can be red or blue shifted according to the ratio of these components in the capping layer. The study of PDOS, indicates that the major contribution to the surface states comes from Zn (s or p orbitals) atoms in the conduction band region and the energy levels at the valance band region are mainly guided by the exchanged ligand. From the band-alignment, we found that the position of the VBM and CBM is controlled by the nature of both initial passivated and exchanged ligands along with the ratio of these ligands. In a nutshell, our study on engineering the energy level alignment of a chosen QD by proper choice of mixed capping ligands would allow better tunability of the electronic structure of QD based devices.Acknowledgements
One of the authors S. Saha is grateful to CSIR, New Delhi for the award of Senior Research Fellowship (SRF).References
- J. M. Luther, Nano Lett., 2008, 8, 3488–3492 CrossRef CAS PubMed.
- N. Tessler, V. Medvedev, M. Kazes, S. H. Khan and U. Banin, Science, 2002, 295, 1506–1508 CrossRef PubMed.
- M. S. Harari, N. Y. Gross, D. Steiner, A. Aharoni, U. Banin, O. Millo and N. Tessler, Nano Lett., 2008, 8, 678–684 CrossRef PubMed.
- C. Bullen and P. Mulvaney, Langmuir, 2006, 22, 3007–3013 CrossRef CAS PubMed.
- D. S. Ginger and N. C. Greenham, J. Appl. Phys., 2000, 87, 1361 CrossRef CAS.
- D. V. Talapin, A. L. Rogach, A. Kornowski, M. Haase and H. Weller, Nano Lett., 2001, 1, 207–211 CrossRef CAS.
- N. Y. Gross, M. S. Harari, M. Zimin, M. Kababya and A. Schmidt, Nat. Mater., 2011, 10, 974 CrossRef PubMed.
- R. Koole, P. Schapotschnikow, C. M. Donega, T. J. H. Vlugt and A. Meijerink, ACS Nano, 2008, 2, 1703–1714 CrossRef CAS PubMed.
- R. Comparelli, F. Zezza, M. Striccoli, M. L. Curri, R. Tommasi and A. Agostiano, Mater. Sci. Eng., C, 2003, 23, 1083–1086 CrossRef PubMed.
- D. C. Look and B. Claflin, Phys. Status Solidi B, 2004, 241, 624–630 CrossRef CAS.
- J. A. Rodriguez and A. Maiti, J. Phys. Chem. B, 2000, 104, 3630–3638 CrossRef CAS.
- B. Meyer and D. Marx, Phys. Rev. B: Condens. Matter, 2003, 67, 035403 CrossRef.
- B. Meyer, D. Marx, O. Dulub, U. Diebold, M. Kunat, D. Langenberg and C. Wöll, Angew. Chem., Int. Ed., 2004, 43, 6642–6645 CrossRef PubMed.
- H. Noei, F. Gallino, L. Jin, J. Zhao, C. D. Valentin and Y. Wang, Angew. Chem., Int. Ed., 2013, 52, 1977–1981 CrossRef CAS PubMed.
- D. J. Cooke, A. Marmier and S. C. Parker, J. Phys. Chem. B, 2006, 110, 7985–7991 CrossRef CAS PubMed.
- N. H. Moreira, G. Dolgonos, B. Aradi, A. L. da Rosa and Th. Frauenheim, J. Chem. Theory Comput., 2009, 5, 605–614 CrossRef CAS.
- S. Nénon, R. Méreau, S. Salman, F. Castet, T. V. Regemorter, S. Clima, D. Beljonne and J. Cornil, J. Phys. Chem. Lett., 2012, 3, 58–63 CrossRef.
- S. Saha, S. Sarkar, S. Pal and P. Sarkar, RSC Adv., 2013, 3, 532–539 RSC.
- D. Porezag, Th. Frauenheim, Th. Köhler, G. Seifert and R. Kaschner, Phys. Rev. B: Condens. Matter, 1995, 51, 12947–12957 CrossRef CAS.
- G. Seifert, D. Porezag and Th. Frauenheim, Int. J. Quantum Chem., 1996, 58, 185–192 CrossRef CAS.
- Th. Niehaus, S. Suhai, F. DellaSala, P. Lugli, M. Elstner, G. Seifert and Th. Frauenheim, Phys. Rev. B: Condens. Matter, 2001, 63, 085108 CrossRef.
- G. Seifert, J. Phys. Chem. A, 2007, 111, 5609–5013 CrossRef CAS PubMed.
- M. Elstner, D. Porezag, G. Jungnickel, J. Elsner, M. Haugk, Th. Fraunheim, S. Suhai and G. Seifert, Phys. Rev. B: Condens. Matter, 1998, 58, 7260–7268 CrossRef CAS.
- G. Dolgonos, B. Aradi, N. H. Moreira and Th. Frauenheim, J. Chem. Theory Comput., 2010, 6, 266–278 CrossRef CAS.
- S. Saha, S. Pal, P. Sarkar, A. L. Rosa and Th. Frauenheim, J. Comput. Chem., 2012, 33, 1165–1178 CAS.
- L. Zhang, L. Yin, C. Wang, N. Lun, Y. Qi and D. Xiang, J. Phys. Chem. C, 2010, 114, 9651–9658 CAS.
- A. Puzder, A. J. Williamson, J. C. Grossman and G. Galli, J. Am. Chem. Soc., 2003, 125, 2786–2791 CrossRef CAS PubMed.
- Y.-S. Fu, X.-W. Du, S. A. Kulinich, J.-S. Qiu, W.-J. Qin, R. Li, J. Sun and J. Liu, J. Am. Chem. Soc., 2007, 129, 16029–16033 CrossRef CAS PubMed.
- R. Wang, X. Pi and D. Yang, Phys. Chem. Chem. Phys., 2013, 15, 1815–1820 RSC.
| This journal is © The Royal Society of Chemistry 2014 |

