Morphological and structural evolution from akaganeite to hematite of nanorods monitored by ex situ synchrotron X-ray powder diffraction

Allan Moreira Xavier, Fabio Furlan Ferreira and Flavio Leandro Souza*
Centro de Ciências Naturais e Humanas (CCNH), Universidade Federal do ABC (UFABC), Av. dos Estados, 5001, 09210-580, Santo André, SP, Brazil. E-mail: fleandro.ufabc@gmail.com; flavio.souza@ufabc.edu.br; Tel: +55 11 4996-8353

Received 4th June 2013 , Accepted 1st April 2014

First published on 3rd April 2014


Abstract

Hematite (α-Fe2O3) is one of the most abundant minerals in nature and a thermodynamically-stable phase of iron oxide. One-dimensional (1D) hematite nanostructures have attracted, due to their fundamental characteristics such as excellent chemical stability in aqueous environments and low cost, considerable interest for a series of technical applications (as sensors, catalysis, lithium ion batteries and solar energy production and storage). Our study describes the phase evolution of iron oxide nanorods, from β-FeOOH to α-Fe2O3, with increasing temperatures of thermal treatment monitored by ex situ synchrotron X-ray powder diffraction data. These data used in conjunction with the Rietveld method allowed us to infer the phase concentration, elucidate the influence of temperature on the unit cell parameters and preferred growth orientation of the nanorods. Only the use of synchrotron radiation allowed us to precisely identify and quantify the presence of a minor Fe2O3 phase, which has never before been reported for those systems. Moreover, the formation of one-dimensional nanorods was accompanied by using scanning and transmission electron microscopies (SEM and TEM). At the highest temperatures of thermal treatments the hematite nanorods exhibited changes that varied from a quasi-perfect crystal up to polycrystalline rods (>500 °C). These findings were used for discussing and explaining recent results using this kind of nanostructure synthesized under hydrothermal conditions. Changes in the preferred orientation of the crystal faces of the rods could be responsible for a low photocatalytic performance reported by this strategy.

Introduction

The most common allotropic crystallographic arrangement of iron oxide found in Earth is α-Fe2O3 or hematite. This material in nanoscale has attracted the attention of the scientific community mainly due to its low toxicity, great abundance, magnetic, optical and electronic properties as well as its vital role in different biological1 and medical processes.2 In addition, during the last decade the use of hematite in nanoscale as a photoanode to efficiently convert solar energy into chemical energy has become one of the most intriguing technological and academic challenges.3–7 The crystallographic configuration of hematite has the Fe3+ ions occupying two-thirds of the octahedral interstices in the (001) basal planes, being two of them filled followed by one vacant, while the tetrahedral sites are unoccupied. What is more, the packing of O2− (anion) is arranged along the [001] direction as a hexagonal closed packed (hcp) structure. The atoms in hematite are arranged in a corundum-like configuration with rhombohedral symmetry and space group (R[3 with combining macron]c), first determined by Pauling and Hendricks in 1925.8

Recently, we have reported that a very promising vertically-oriented iron oxide film prepared under hydrothermal conditions for 6 hours and additional sintering at 390 °C for 1 hour (ref. 9 and 10) could be obtained. A good photoelectrochemical response was observed making this photoanode a potential candidate to be applied in photoelectrochemical (PEC) cells. However, the efficiency to convert solar energy into chemical energy using our and other produced materials by means of different methods are very far from the best theoretical value of efficiency offered for pure hematite, e.g., the best conversion value reported up to now was around 4% (ref. 11–13) very far away from the 13% maximum possible for this material.14 The performance of the photoanodes are intimately related to the presence of pure hematite phase (photoactive in this phase), the preferred orientation of the basal plane (001) and the availability of an active surface to allow the efficient liquid–solid reaction.15 Indeed, these points are strictly dependent on the synthetic route used. Nowadays, on the basis of these critical factors lots of efforts are directed to comprehend the fundamental properties of pure hematite in nanoscale produced by different routes in order to improve the photoelectrochemical performance.

For instance, the photoelectrochemical performance of hematite films is seriously affected due to the thermal treatment used during the fabrication procedure. In fact, the structural changes, concentration of defects, or the presence of mixture of phases could compromise the efficiency of the films produced.10,16 The best results for pure and doped hematite reported in the literature are found when high temperatures of thermal treatments, around 800 °C, are employed.6,16–19 As a consequence of the abovementioned scenario, some light has to be shed on the real role of high temperature of thermal treatment on the hematite surface activation to produce an efficient device to directly convert solar energy into chemical energy.

In order to comprehend the influence of the thermal treatment used during the hematite fabrication process, the present work describes the structural and morphological evolution of nanorods synthesized under hydrothermal conditions and heat treated at different temperatures. It is worth mentioning the synthesis used herein favours simultaneously the production of films and powders with morphologies composed by nanorods. As aforementioned, the thermal treatment of hematite has been considered one of the most crucial parameters to be controlled and understood in order to obtain remarkable performance during photoelectrochemical application test. The structural evolution was monitored by X-ray powder diffraction using the facilities of the Brazilian Synchrotron Light Laboratory (LNLS, Campinas-SP). The morphology was discussed by means of FE-SEM and TEM images confirming the nanorod shape of the as-prepared and sintered samples at different temperatures.

Experimental section

Synthesis

The strategy presented herein proposes a synthetic route to prepare iron oxide nanorods on a controlled aqueous solution under hydrothermal conditions. Following a typical procedure,9,10,20 95 ml of aqueous solution (deionized water with resistivity greater than 15 MΩ cm) containing 0.15 mol L−1 of ferric chloride (FeCl3·6H2O, Mallinckrodt, 97%) and 1 mol L−1 of sodium nitrate (NaNO3, Merck, 99.5%) at pH 1.5 (set by addition of HCl, Nuclear, 36.5–40%) were mixed together. This solution was poured into a bottle with an autoclavable screw cap (see the Scheme of synthetic route illustrated in Fig. S1). The closed bottle was then placed in an oven and subjected to a constant temperature (100 °C) for 6 hours. After the hydrothermal process, the resulting powder was cold washed with ethanol–distilled water, to remove any residual salts, and dried in air. Samples of iron oxide powders previously synthesized underwent additional heat treatments in air at different temperatures (390, 450, 550, and 800 °C) for one hour in order to study the structural phase evolution.

Characterizations

The crystalline phases of iron oxide powders (before and after heat treatments) were identified by means of high-throughput synchrotron X-ray powder diffraction measurements performed at the X-ray powder diffraction beamline (D10B-XPD)21 of the Brazilian Synchrotron Light Laboratory (LNLS, Campinas, SP, Brazil) in the 2θ range from 10° to 100°, using a wavelength of λ = 1.24028 Å in reflection geometry. The morphology of the powdered samples was characterized by field emission gun scanning electron microscopy (FEG-SEM, Inspect F50 – FEI) and transmission electron microscopy (TEM, Tecnai F20 – FEI microscope operating at 200 keV). In order to obtain TEM images the nanoparticles were dispersed in ethanol and dripped on a carbon-coated copper grid.

Results and discussion

The growth of one-dimensional iron oxide nanoparticles under hydrothermal conditions is feasible using a solution with adequate quantities of (a) a soluble iron salt as precursor, often iron(III) chloride, (b) a strong electrolyte in high concentration, for effective control of the ionic medium strength, and (c) an acid for pH adjustment. This solution, under hydrothermal conditions, enables the interaction of Fe3+ ions with OH, producing iron oxide nuclei, as described by eqn (1).
 
Fe3+(aq) + 3OH(aq) → β-FeOOH(s) + H2O(l) (1)

Commonly, iron oxide nanoparticles synthesized under hydrothermal conditions have been reported as forming nanorods in the akaganeite phase (β-FeOOH). Several authors13,19,22 using the aforementioned conditions with different reagents and environments reported the obtained iron oxides with nanorod morphology (hydrated phase) were similar to the ones presented herein. For instance, the forced hydrolysis of aqueous FeCl3/HCl solution in the presence of dopamine as chemical shape-control agent has been found to form an anisotropic morphology in the hydrated phase. Herein, we show the formation of iron oxide nanoparticles with nanorod morphology was achieved only controlling the quantities of reagents without any chemical-control agent.

The morphology of the as-prepared and thermally-treated samples obtained under hydrothermal conditions was monitored by FEG-SEM images illustrated in Fig. 1. SEM image of the as-prepared sample (Fig. 1a) enabled one to identify a typical anisotropic-like nanoparticle formation.


image file: c3ra42753f-f1.tif
Fig. 1 FEG-SEM images of iron oxide nanoparticles: (a) as-prepared samples; and as-prepared samples after additional thermal treatments at (b) 450 °C and (c) 550 °C, respectively.

The effect of different temperatures on thermal treatment did not affect the morphology of iron oxide nanoparticles, as can be seen in Fig. 1b and c. However, as expected, the dimensions (lengths) of the nanorods increased with higher temperatures of thermal treatment when compared to the as-prepared sample. The nanorod length was estimated as having approximately 1.1 and 2.0 μm for the as-prepared and thermally treated samples at temperatures higher than 500 °C respectively, as summarized in Table 1.

Table 1 Structural evolution and dimensional parameter (nanorod length) for all samples studied herein
Sample Phase Nanorod length (μm)
As-prepared Akaganeite 1.1
Heat treated at 390 °C Akaganeite/hematite 1.1
Heat treated at 450 °C Akaganeite/hematite 1.7
Heat treated at 550 °C Hematite 2.0
Heat treated at 800 °C Hematite 2.0
Guo, P. et al.23 Hematite 1–2


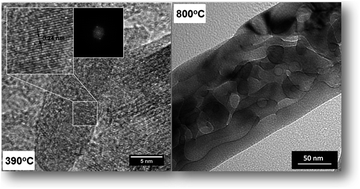
In addition, an important effect caused by the increase of temperature of thermal treatment in the as-prepared sample is the appearance of defects and aggregates. Comparing the SEM images (Fig. 1) of the as-prepared sample with samples treated at 450 °C and 550 °C we clearly observed the nanorod aggregation and an increase in the number of defects. In order to investigate and confirm the defects caused by thermal treatment, the as-prepared and thermally-treated samples at low and high temperatures (390 °C and 800 °C) were analyzed using the high resolution transmission electron microscopy (HRTEM) technique (Fig. 2). Low magnification HRTEM image of the as-prepared sample clearly represents a quasi-perfect crystal free of defects, as can be seen Fig. 2a. When the as-prepared sample was thermally treated at low temperature (390 °C) the morphology (shape) and integrity of the nanorod were kept without defects, as depicted in Fig. 2b. In addition, analyzing the high magnification HRTEM images of the as-prepared and the heat treated sample at 390 °C (Fig. 2d and e, respectively) the formation of quasi-perfect crystals is clearly confirmed and a reduction of interatomic distances from 0.5 nm to 0.25 nm was identified. The observed reduction in the interatomic distance is caused by structural water elimination during thermal treatment related to the gradual phase transformation from β-FeOOH (akaganeite) to α-Fe2O3 (hematite), which will be discussed in more details later on. The water elimination and phase transformation start during thermal treatment at the lowest temperature of the as-prepared sample and can be described by eqn (2):

 
2β-FeOOH(s) → α-Fe2O3(s) + H2O(l) (2)


image file: c3ra42753f-f2.tif
Fig. 2 TEM images of 1D iron oxide nanoparticles; (a) as-prepared sample; after additional treatments at (b) 390 °C; (c) 800 °C (low magnification bright field TEM image); (d) and (e) represent the low magnification HRTEM images of selected areas (white boxes) of samples illustrated in (a) and (b), respectively. The insets in (d) and (e) images were simulated considering the FFT analysis on different rods, oriented along the [110] zone axis; (f) high magnification bright field TEM image of the as-prepared sample heat treated at 800 °C.

This equation linked to water losses aid us to explain the occurrence of defects observed (Fig. 2c and f) in the as-prepared sample thermally treated at temperatures higher than 450 °C. For instance, low magnification bright field TEM (BF-TEM) image illustrated in Fig. 2c of the as-prepared sample thermally treated at 800 °C shows in great details the presence of a high concentration of defects. The different contrast (bright and dark regions) observed in BF-TEM image (Fig. 2c) indicates the different crystallographic orientation, which means that a quasi-crystal sample becomes polycrystalline after thermal treatment at high temperature. The presence of this diffraction contrast, which represents different crystallographic orientations, can be better observed in Fig. 2f as indicated by a white arrow (analyzing the high magnification BF-TEM images).

The presence of defects observed at high temperature of heat treatment can be related to the water losses during (mass transport) phase transformation from a hydrated iron oxide phase to a pure iron oxide one (eqn (2)). This means that the phase transition is not a simple topotactic phase transformation. In fact, in the present study the phase transformation involves diffusion and mass transport, which could be responsible to make a quasi-crystal material becomes a polycrystal. From TEM images depicted in Fig. 2a–c it is possible to manipulate using adequate temperatures of thermal treatment the presence of defects on the hematite nanorod morphology. For instance, this control could imply the enhancement of the electronic charge transfer trough hematite nanorods at low concentration of defects, otherwise acting as a trap of electrons or as recombination sites due to the presence of defects.16,24,25 On the other hand, the polycrystalline hematite nanorod (Fig. 2c and f) illustrates a weak ferromagnetic behavior important for medical applications, while quasi-crystal hematite nanorod (Fig. 2b and e) presents no ferromagnetic behavior. In this case, the presence of high concentration of defects facilitates the spin-domain mobility.26,27 In order to confirm the ferromagnetic behavior of the hematite nanorods synthesized herein, curves of magnetization as function of magnetic field (H) were investigated using the VSM mode of a Physical Properties Measurement System (PPMS, Evercool – Quantum Design) equipment. Hysteresis loops (M vs. H) for all samples synthesized here are shown in Fig. S1 and a weak ferromagnetic response at 25 °C is observed for samples thermally treated from 450 to 800 °C. As expected the sample thermally treated at 390 °C does not display any ferromagnetic behavior (see black line in Fig. S2). As aforementioned, this result shows good agreement with the discussion in which the preferred orientation of the nanorod crystal changes from (110) to (104) direction, and the ferromagnetic behavior starts to be significant compared to the photocatalytic properties. This concept will be addressed again later.

In order to monitor the structural evolution of iron oxide nanoparticles that underwent thermal treatments, the samples were characterized by synchrotron X-ray powder diffraction, and the diffractograms are illustrated in Fig. 3.


image file: c3ra42753f-f3.tif
Fig. 3 XRPD diffractograms, obtained at the D10B-XPD beamline21 of LNLS, using X-rays of λ = 1.24028 Å. Ex situ heat treatments clearly indicate the evolution of phase transformation from β-FeOOH to α-Fe2O3. As-prepared sample and after additional thermal treatments at 390 °C, 450 °C, 550 °C and 800 °C (from bottom to top). The inset displays the (104) and (110) reflections of Fe2O3.

Fig. 3 illustrates the diffractograms for the as-prepared as well as heat treated samples. From bottom to top, the room temperature (as-prepared) sample was indexed as an iron oxy-hydroxide phase (akaganeite, β-FeOOH) using JCPDS 34-1266 card. The diffractograms of the as-prepared sample after thermal treatments illustrate the evident phase transformation from β-FeOOH to α-Fe2O3 phase. The characteristic peaks (104) and (110) related to the hematite phase were indexed using JCPDS 33-0664 card, which are represented by the dashed box in Fig. 3, respectively. It can be seen that the intensity of the (104) reflection gradually increases when compared to the (110) one with higher temperatures of thermal treatments (inset in Fig. 3). This change in the reflection intensity has a very important implication that compromises the application of hematite materials prepared herein as photoanode in photoelectrochemical cells (discussed later on).

For a better understanding on the effect of additional thermal treatments in the crystal structure of the samples, we have performed Rietveld refinements28,29 using the software program Topas-Academic v. 5 (ref. 30). First, unit cell and sample displacement parameters were refined. The background was fitted using a 10-term Chebyshev polynomial. The peak profiles were modelled by the Double-Voigt approach19 with anisotropic peak profiles adjusted using 8-term spherical harmonics20 as well as preferred orientation of the crystals. Isotropic atomic displacements (Biso) were refined without constraints. The as-prepared sample, ascribed to β-FeOOH in fact presents some unindexed peaks related to a minor water-containing Fe2O3 phase.31 Fig. 4 shows the final Rietveld refinement including both the β-FeOOH as well as a water-containing Fe2O3 phase. For the sake of clarity, on the other hand, the inset in Fig. 4 illustrates a Rietveld refinement without taking into account the water-containing Fe2O3 phase, which evidences the presence of some unindexed peaks. The goodness of fit indicator, χ2, as well as R-factors,32 Rwp, Rexp and RBragg were, respectively: χ2 = 2.486, Rwp = 0.08855, Rexp = 0.03554, RBragg_β-FeOOH = 0.02083 and RBragg_Fe2O3_wc = 0.04453. The refined unit cell parameters and mass fractions were: a = 1.05387(4) nm, c = 0.30336(1) nm and 98.91(7) wt% for β-FeOOH and a = 0.50374(19) nm, c = 1.37673(68) nm and 1.09(7) wt% for water-containing Fe2O3. Only the use of synchrotron radiation allowed us to precisely identify and quantify the presence of a minor Fe2O3 phase, which has never before been reported for those systems.


image file: c3ra42753f-f4.tif
Fig. 4 Rietveld refinement of the as-prepared sample taking into account both β-FeOOH and a water-containing Fe2O3 phases. Black crosses illustrate the observed profile, the red line indicates the calculated profile and vertical bars at the bottom of figure display the Bragg peak positions of both phases (olive: β-FeOOH; wine: water-containing Fe2O3). The difference between the observed and calculate profile is indicated by the blue line. The inset shows some unindexed peaks when only the β-FeOOH phase is taking into account. The phase quantification resulted in 98.91(7) wt% of β-FeOOH and 1.09(7) wt% of water-containing Fe2O3.

When, the temperature of thermal treatment is increased to 390 and 450 °C the gradual phase transformation from β-FeOOH to α-Fe2O3 starts taking place. The background of those diffractogram, from ∼20° to 30° (2θ), presents a hump, which may indicate a partial disorder of the system when transforming from β-FeOOH to α-Fe2O3. As aforementioned the sample treated at temperatures higher than 500 °C evidenced the complete transformation to Fe2O3. The Rietveld refinement of the sample treated at 800 °C is displayed in Fig. 5. The goodness of fit indicator as well as R-factors were, respectively: χ2 = 1.636, Rwp = 0.06544, Rexp = 0.03999, RBragg = 0.00551, with refined unit cell parameters: a = 0.503450(3) nm, c = 1.37489(1) nm.


image file: c3ra42753f-f5.tif
Fig. 5 Rietveld refinement of the sample thermally treated at 800 °C taking into only the α-Fe2O3 phase. Black crosses illustrate the observed profile, the red line indicates the calculated profile and vertical bars at the bottom of figure display the Bragg peak positions of the α-Fe2O3 phase. The difference between the observed and calculate profile is indicated by the blue line.

These results are in agreement with investigations reported in the literature33–35 where it was shown the transformation of hematite from an iron ferrihydrate phase occurs only at elevated temperatures.33,34 Many authors using the same or similar synthetic routes to produce hematite electrodes did not report the presence of additional phases for samples heat treated at 390 °C measured in conventional diffractometers possibly due to the radiation used – CuKα – which produces fluorescence thus not allowing for a correct identification/quantification of different iron oxide phases.9,10,19,20 Therefore, in the present study the X-ray measurements were performed using synchrotron radiation with a wavelength selected just below the iron absorption edge. Then, it was possible to identify the presence of an additional phase up to 500 °C and pure hematite, as expected, only at higher temperatures,33,34 as can be seen in Fig. 3. Moreover, the complete phase transformation found in the literature is mainly due to changes in crystallite size, e.g., when crystallite size increases due to thermal treatments (Table 1) the surface becomes more unstable thus leading to a more stable crystallographic arrangement minimizing the surface energy.22,36,37 Particularly in this case the transformation occurs from β-FeOOH to α-Fe2O3, since this phase is thermodynamically more stable.

It can be seen from the X-ray diffraction patterns and Rietveld refinement of the as-prepared (β-FeOOH + water-containing Fe2O3) sample, a pure hematite system only takes place above 500 °C of thermal treatment. This condition seems to be the ideal temperature for producing photoactive electrodes for PEC cells. However, in a recent study Ferraz and co-workers10 showed the hematite electrode (produced following the same synthetic route presented herein) displayed its photoeletrochemical performance drastically reduced with increasing temperatures.10 Additionally, the best performance reached for a hematite electrode using this synthetic route was obtained only after a relatively lower temperature of thermal treatment (390 °C) was employed. In fact, this was a surprising result especially when compared to the best pure hematite electrodes reported in the literature,6,18,19 where the thermal treatment used ranged from 700 to 800 °C.

On the basis of the present study, one plausible explanation for the indistinguishable photoelectrochemical performance between dark and illuminated conditions obtained by Ferraz and co-workers for the hematite electrodes treated from 450 to 800 °C could be attributed to changes in the crystallographic preferred orientation observed with increasing temperatures of thermal treatment (Fig. 3). According to the literature25,37 the highest conductivity in hematite is observed when, despite the effect of preferred orientation of the crystallites, the integrated intensity of the (110) plane is the most intense, referring to good candidates for applications in photoelectrochemical cells. For instance, the tendency of the crystallites to be oriented in the (110) plane is desirable for hematite films e.g., meaning they are vertically aligned to the substrate thus reaching conductivities up to four orders of magnitude higher than when the crystallites are oriented in the orthogonal plane.25,36–38 Consequently, this structural configuration can be expected to more efficiently convert solar energy into chemical energy.

In order to confirm this hypothesis films were prepared following the same synthetic route and additional heat treatment at 390, 450, and 550 °C for powder production. Actually, the iron oxide powders and films in hydrated phase are obtained simultaneously when a transparent glass conductor substrate is immersed in an aqueous solution and maintained at 100 °C in a conventional oven for 6 hours (Scheme of Fig. S1). After that time the flask containing a hydrated iron oxide powder (precipitated at the bottom of the flask) and a film deposited onto the glass substrate, is immersed in an ice bath for freezing the chemical reaction and both products are washed several times (see photography of the powder and films produced in Fig. S1). More details describing the production of films can be found in elsewhere.9,10 Films were characterized by X-ray diffraction and their performances under dark and illuminated conditions were followed by linear voltammetry (Fig. S3 and S4). As aforementioned, experiments performed at conventional diffractometers have not allowed us to correctly identify/quantify different iron oxide phases. However, the main focus is to show that the preferred orientation (hematite) can have a fundamental role on magnetic and photocatalytic behaviors of the hematite samples. Then, for all films the characteristic peaks (104) and (110) related to the hematite phase were indexed using JCPDS 33-0664 card, and additional peaks identified with asterisk are referred to the SnO2 phase (cassiterite phase) present in the conductor glass substrate layer, as can be seen in Fig. S3a and S4a. For the purpose of our discussion the focus will be the preferred direction of iron oxide nanorods grown onto the transparent conductor substrate. Iron oxide films thermally treated at 390 °C show the rods grow on the substrate preferentially at (110) direction (see Fig. S3a), while the iron oxide films treated at 450 and 500 °C presented the (104) peak the preferred direction of growth (Fig. S4a). The performance of the iron oxide films were carried out in the application environment to confirm our hypothesis and the study reported by Ferraz and co-workers. Fig. S3b and S4b illustrate the current density as a function of potential (reference electrode of Ag/AgCl) under dark and illuminated conditions. As expected, although pure hematite was achieved after 550 °C suggesting a photoactive electrode, the reduction or indistinguishable photoelectrochemical performance measured in the absence and presence of sunlight (see Fig. S4b) coincided with a drastic drop in intensity of the (110) peak with increasing temperatures (Fig. S4a).

As aforementioned, it is desired the crystal orientation of hematite materials becomes more intense along the (110) direction on the conductive substrate since the hematite has a strong conductivity due to its anisotropy in this direction (Fig. S3). The present results helped us to show that a synthetic route proposed to produce in single step vertically-oriented nanorods on the conductor substrate under hydrothermal conditions needs to be revisited in order to understand and find an effective procedure to fabricate more efficient hematite nanostructures (electrodes).

Conclusions

In summary, this work describes the structural and morphological evolution of hematite nanostructures synthesized under hydrothermal conditions and thermally-treated at different temperatures. Also, the impact of this study was discussed around the application of the hematite nanostructures as photoanodes in PEC cells, since this synthetic route is extensively used. From SEM and TEM images it was monitored the impact of temperature of thermal treatments on the morphology of the nanorods. At higher temperatures the length of nanorods increases from 1 to 2 microns and their shapes remain unchanged except for the presence of defects clearly observed in TEM images (800 °C). The as-prepared and thermally-treated sample at low temperature seems to be a quasi-single crystal, while at elevated temperature the rods showed the presence of defects, constituting mainly a polycrystalline material. The increase in the crystal size (nanorod dimensions) in nanometric scale is generally accepted as an evidence of occurrence of phase transition. From synchrotron X-ray diffraction data we clearly observed that transformation from β-FeOOH to α-Fe2O3 starts at low temperature and achieved the complete transition at higher temperature of thermal treatment (500 °C).

Acknowledgements

We acknowledge the financial support from the Brazilian agencies FAPESP (proc. nr. 2012/19926-8, 2011/19924-2 and 2008/10537-3), CNPq (proc. nr. 305186/2012-4, 477296/2011-4 and 473669/2012-9), CAPES, the LNLS for beamtime, CEM-UFABC, INCTMN and NANOBIOMED CAPES network, Prof. Edson R. Leite and Bruno H. Lima for the TEM and SEM images obtained at the Nanocharacterization Laboratory, UFSCar.

Notes and references

  1. M. Vargas, K. Kashefi, E. Blunt-Harris and D. R. Lovley, Nature, 1998, 395, 65–67 CrossRef CAS PubMed.
  2. V. Karagkiozaki, E. Vavoulidis, P. G. Karagiannidis, M. Gioti, D. G. Fatouros, I. S. Vizirianakis and S. Logothetidis, Int. J. Nanomed., 2012, 7, 5327–5338 CAS.
  3. D. K. Bora, A. Braun and E. C. Constable, Energy Environ. Sci., 2013, 6, 407–425 CAS.
  4. S. C. Riha, M. J. DeVries Vermeer, M. J. Pellin, J. T. Hupp and A. B. F. Martinson, ACS Appl. Mater. Interfaces, 2013, 5, 360–367 CAS.
  5. H. G. Cha, J. Song, H. S. Kim, W. Shin, K. B. Yoon and Y. S. Kang, Chem. Commun., 2011, 47, 2441–2443 RSC.
  6. R. H. Gonçalves, B. H. R. Lima and E. R. Leite, J. Am. Chem. Soc., 2011, 133, 6012–6019 CrossRef PubMed.
  7. O. Zandi, B. M. Klahr and T. W. Hamann, Energy Environ. Sci., 2013, 6, 634–642 CAS.
  8. L. Pauling and S. B. Hendrick, J. Am. Chem. Soc., 1925, 47, 781–790 CrossRef CAS.
  9. V. A. N. Carvalho, R. A. S. Luz, B. H. Lima, E. R. Leite, F. N. Crespilho and F. L. Souza, J. Power Sources, 2012, 205, 525–529 CrossRef PubMed.
  10. L. C. C. Ferraz, W. M. Carvalho, Jr, D. Criado and F. L. Souza, ACS Appl. Mater. Interfaces, 2012, 4, 5515–5523 CAS.
  11. A. Kay, I. Cesar and M. Grätzel, J. Am. Chem. Soc., 2006, 128, 15714–15721 CrossRef CAS PubMed.
  12. S. D. Tilley, M. Cornuz, K. Sivula and M. Grätzel, Angew. Chem., Int. Ed., 2010, 49, 6405–6408 CrossRef CAS PubMed.
  13. L. Xi, S. Y. Chiam, W. F. Mak, P. D. Tran, J. Barber, S. C. J. Loo and L. H. Wong, Chem. Sci., 2013, 4, 164–169 RSC.
  14. A. B. Murphy, P. R. F. Barnes, L. K. Randeniya, I. C. Plumb, I. E. Grey, M. D. Horne and J. A. Glasscock, Int. J. Hydrogen Energy, 2006, 31, 1999–2017 CrossRef CAS PubMed.
  15. S. V. Yanina and K. M. Rosso, Science, 2008, 320, 218–222 CrossRef CAS PubMed.
  16. K. Sivula, F. Le Formal and M. Grätzel, ChemSusChem, 2011, 4, 432–449 CrossRef CAS PubMed.
  17. L. Xi, S. Y. Chiam, W. F. Mak, P. D. Tran, J. Barber, S. C. J. Loo and L. H. Wong, Chem. Sci., 2013, 4, 164–169 RSC.
  18. K. Sivula, R. Zboril, F. Le Formal, R. Robert, A. Weidenkaff, J. Tucek, J. Frydrych and M. Grätzel, J. Am. Chem. Soc., 2010, 132, 7436–7444 CrossRef CAS PubMed.
  19. R. Morrish, M. Rahman, J. M. Don MacElroy and C. A. Wolden, ChemSusChem, 2011, 4, 474–479 CrossRef CAS PubMed.
  20. L. Vayssieres, N. Beermann, S. E. Lindquist and A. Hagfeldt, Chem. Mater., 2001, 13, 233–235 CrossRef CAS.
  21. F. F. Ferreira, E. Granado, W. Carvalho, Jr, S. W. Kycia, D. Bruno and R. Droppa, Jr, J. Synchrotron Radiat., 2006, 13, 46–53 CAS.
  22. D. K. Bora, A. Braun, R. Erni, G. Fortunato, T. Graule and E. C. Constable, Chem. Mater., 2011, 23, 2051–2061 CrossRef CAS.
  23. P. Guo, Z. Wei, B. Wang, Y. Ding, H. Li, G. Zhang and X. S. Zhao, Colloids Surf., A, 2011, 380, 234–240 CrossRef CAS PubMed.
  24. T. W. Hamann, Dalton Trans., 2012, 41, 7830–7834 RSC.
  25. F. L. Souza, K. P. Lopes, E. Longo and E. R. Leite, Phys. Chem. Chem. Phys., 2009, 11, 1215–1219 RSC.
  26. J. Jacob and M. Abdul Khadar, J. Magn. Magn. Mater., 2010, 322, 614–621 CrossRef CAS PubMed.
  27. M. Tadic, N. Citakovic, M. Panjan, B. Stanojevic, D. Markovic, Đ. Jovanovic and V. Spasojevic, J. Alloys Compd., 2012, 543, 118–124 CrossRef CAS PubMed.
  28. H. M. Rietveld, Acta Crystallogr., 1967, 22, 151–152 CrossRef CAS.
  29. H. M. Rietveld, J. Appl. Crystallogr., 1969, 2, 65–71 CrossRef CAS.
  30. A. A. Coelho, J. Evans, I. Evans, A. Kern and S. Parsons, Powder Diffr., 2011, 26, s22–s25 CrossRef CAS.
  31. E. Wolska and U. Schwertmann, Z. Kristallogr., 1989, 189, 223–237 CrossRef CAS PubMed.
  32. B. H. Toby, Powder Diffr., 2006, 21, 67–70 CrossRef CAS.
  33. Y. Cudennec and A. Lecerf, Solid State Sci., 2005, 7, 520–529 CrossRef CAS PubMed.
  34. Y. Cudennec and A. Lecerf, J. Solid State Chem., 2009, 179, 716–722 CrossRef PubMed.
  35. D. K. Bora, A. Braun, S. Erat, O. Safonova, T. Graule and E. C. Constable, Curr. Appl. Phys., 2012, 12, 817–825 CrossRef PubMed.
  36. I. Cesar, A. Kay, J. A. G. Martinez and M. Grätzel, J. Am. Chem. Soc., 2006, 128, 4582–4583 CrossRef CAS PubMed.
  37. M. Cornuz, M. Grätzel and S. Kevin, Chem. Vap. Deposition, 2010, 16, 291–295 CrossRef CAS.
  38. F. L. Souza, K. P. Lopes, P. A. P. Nascente and E. R. Leite, Sol. Energy Mater. Sol. Cells, 2009, 93, 362–368 CrossRef CAS PubMed.

Footnote

Electronic supplementary information (ESI) available. See DOI: 10.1039/c3ra42753f

This journal is © The Royal Society of Chemistry 2014
Click here to see how this site uses Cookies. View our privacy policy here.