DOI:
10.1039/C3RA42707B
(Paper)
RSC Adv., 2014,
4, 1761-1774
Hydrogen bonding patterns in different acrylamide–water clusters: microsolvation probed by micro Raman spectroscopy and DFT calculations
Received
1st June 2013
, Accepted 4th October 2013
First published on
4th October 2013
Abstract
We report in this study on the hydrogen bonding patterns between acrylamide (Acr) and water (W) as a H-donor. Hydrogen bonds between Acr and water molecules and among different water molecules significantly influence the spectral features. Raman spectra of neat Acr and its mixtures with water were recorded in the region, 1800–400 cm−1. A careful analysis of the spectra reveals that upon dilution, the additional peaks are observed at 831 and 1124 cm−1, ∼10 and ∼18 cm−1 away from the main bands at ∼842 and ∼1142 cm−1, respectively, which were attributed to the hydrogen bonding of Acr with water. The new band at ∼1083 cm−1 clearly reveals a nice example of the increment on the degree of hydrogen bonding in terms of multiple hydrogen bonded molecules. The temperature dependent Raman spectra of Acr at nine different temperatures were also recorded, and a significant change in spectral features observed at ∼373 K is attributed to crystal → liquid transition. A new peak at 1620 cm−1 appears to be due to a change in the symmetry of self associated Acr (dimer and trimer) molecules at 373 K. DFT calculations were performed using B3LYP/6-311++G(d,p) to obtain the ground state optimized geometries of neat, self associated dimeric and trimeric forms, and hydrogen bonded complexes in gas phase. The DFT computations were also performed on various (Acr + Wn, n = 1–15) clusters in order to explore the microsolvation. A broad configuration search was performed to identify the lowest energy clusters of Acr with varying number of water molecules. The structures of the clusters are analyzed in terms of the hydrogen bonding network established among the water molecules and between Acr and water molecules. Overall the present study gives a clue regarding the stabilization of the Acr molecule in a large cluster of water molecules.
Introduction
The current research efforts involving hydrogen bonding aim to understand the non-covalent interactions which have remarkable applications in physics, chemistry and biology as well as in crystal engineering. Hydrogen bonds play a very crucial role in intermolecular recognition and supramolecular construction, and its significance in crystal engineering can scarcely be underestimated.1,2 The phenomenon of hydrogen bonding is almost omnipresent in nature. A detailed account of various types of hydrogen bonds was presented by Jeffrey and Desiraju3,4 more than a decade ago. Hydrogen bonds although weak4 are numerous in number and hence they provide considerable stability to the protein molecule and also stabilize the structure of DNA by forming a bridge between the pyrimidine and purine bases.
The research in the area of hydrogen bonding has been both challenging and interesting because of the modifications of its definition from time to time, its characteristics and different criteria for its formation. Earlier5 the International Union of Pure and Applied Chemistry (IUPAC) had defined the hydrogen bond, which reflected the scientific thinking and perceptions of the Pauling era. Recently a new definition of hydrogen bonding was given by Arunan et al.6 However, some comments and questions were posed very recently by Desiraju7 on the modern definition and his intention to some of the reasoning, thought processes and the divergences that accompanied his recommendation on an updated definition of the hydrogen bond was provided. Moreover, still more effort is needed to understand the characteristics and criteria of hydrogen bonding through different molecular associations.
Acrylamide (Acr) is a naturally occurring compound found in many plant based high carbohydrate-foods after they are heated. It has been found that its administration to laboratory animals caused tumor formation in various organs; the exact mechanism involved is still unclear.8 The link between Acr exposure and human cancer is nowadays an emerging and a very challenging research area,9 which requires a better understanding of the conformational behavior of this molecule. Moreover, conformational effects, intra- and inter-molecular hydrogen bonding interactions in Acr present a wide range of molecular properties and aggregation patterns, which may lead to important pharmaceutical and industrial applications (e.g., for making synthetic rubber and plastic).
In view of its importance, the first study on the IR and Raman spectra and structures of Acr was made as early as 1961.10 FT-IR and polarized Raman spectra of Acr and polyacrylamide were reported11 more than a decade ago, where a nice correlation between the observed and calculated wavenumbers was presented. A later study,12 almost a decade ago on proton coupled electron transfer in DNA–Acr complexes was carried out and it found that the balance between single electron transfer and proton coupled electron transfer in the DNA–Acr system was highly sensitive to the solvation properties of the system. In a study made a few years ago by Duarte et al.,13 the conformation of neat Acr dimers by ab initio calculations and its vibrational spectra were reported in order to perform a normal mode analysis for the most stable monomers and dimers in neat Acr. In another study,14 the crystal structure of Acr obtained by single crystal XRD was reported recently and in this crystal structure strong hydrogen bonds, N–H⋯O join the molecules of Acr into bi-molecular layers that make the C⋯C molecular contacts. In yet another study, Chen et al.15 performed most recently DFT calculations on hydrogen bonded complexes formed between guanine and Acr and in their study the hydrogen bonds between DNA and Acr appeared to be crucial in the relative stability of nine different complexes which is expected to provide another nosogenetic interpretation besides the normal covalent interactions between DNA and Acr, which are of interest for studying the mutation of DNA. Hydrogen bonding interactions between an electron rich atom, F, N, O, or Cl with the H atom of the hydrogen donor solvents (H2O, CH3OH and C2H5OH) have been studied extensively by our group recently16–22 on several systems where hydrogen bond formation resulted in a variety of clusters which exhibited their clear signature in spectral features.
Here, due to the importance of Acr in pharmaceutical and industrial fields and also the briefly discussed earlier studies above,10–15 it was, therefore, considered worthwhile to make Raman measurements on neat Acr and its hydrogen bonded complexes with water (W). A considerable part of this study is devoted to detailed DFT calculations on different (Acr + W) clusters in order to correlate the structures thus obtained to the experimental results. In addition to this, temperature dependent Raman measurements on the Acr molecule were also performed in order to investigate the effect on spectral features at high temperature and draw some meaningful conclusions from the observed spectral changes.
Methods
Experimental details
The sample of acrylamide (Acr) of more than 99% purity was purchased from Sigma Aldrich Co. and it was used without any further purification. The samples were stored in an N2-atmosphere after opening the container in order to avoid any contamination from the surrounding atmosphere. A micro Raman spectrometer (from Renishaw) equipped with 1800 grooves per mm gratings and a Peltier cooled CCD detector was employed to record the spectra. The 514.5 nm line of an Ar+ – laser delivering ∼200 mW power at the sample was used as the Raman excitation source in back scattering geometry. The data acquisition time for each spectrum was 60 s per window. The expected spectral resolution was better than 1.0 cm−1 for 100 μm slit width for the present set-up, which was used for all the measurements. In order to record the temperature dependent Raman spectra, the sample was kept in a quartz sample holder, which was kept in the computer controlled high/low temperature cell, THM 600 temperature controlled stage from Linkam Scientific Instruments. The sample was placed on a platform which has an automated X–Y stage below the Olympus long distance 50× microscope objective. The accuracy in the measurement of temperature was ±0.1 C. The GRAM-32 software was used for data collection and the Raman scattered light was collected in the back-scattering geometry.
Computational protocols
All the calculations were performed using Gaussian 03 program package.23 The optimized geometries, structural parameters and harmonic vibrational wavenumbers of the different normal modes of neat Acr and its different clusters were obtained using density functional theoretic (DFT) calculations employing the B3LYP hybrid functional, which is believed to be superior to the other two methods (HF and MP2) in predicting molecular properties.24–28 The high level, basis set of Gaussian type orbitals (GTOs), 6-311++G(d,p)29 was employed for all the calculations. The global minima on the potential energy surface were confirmed by the real harmonic vibrational wavenumbers calculated for each structure/cluster.
Theoretical results and discussion
DFT calculations on acrylamide–water complexes
From our earlier experience and reported literature, it was seen that among BLYP, MP2 and HF methods, the hybrid B3LYP functional16–22,30,31 method performs reasonably well to describe various molecular systems and hence, in the present study, the hybrid B3LYP functional was used for all the calculations. The water molecules were added to the Acr molecule in a systematic manner and in various possible ways in order to incorporate the solvent effect.
Optimized structures and total energies of different hydrogen bonded clusters
The ground state optimized geometry of Acr, self associated clusters (dimer and trimer) and their various possible hydrogen bonded complexes with varying number of water molecules are presented in Fig. 1–3. In order to get the most stable Acr monomer, we have optimized the energies of the different geometrical arrangements of the atoms of Acr by changing the dihedral angle (N–C3–C2–C1) from 0 to 180°. Only two of them, which were significantly populated at room temperature (see Fig. 1a and b) were calculated at the B3LYP/6-311++G(d,p) level. These two conformers differ mostly in the N–C3–C2–C1 dihedral angle and considering the positions of the methylene (–CH2) and amino (–NH2) groups relative to the C2–C1 bond, the former corresponds to a cis and the latter to a trans conformation, respectively. At room temperature, the optimized energy of the trans conformer has lower energy in comparison to the cis conformer (Fig. 1a and b) which essentially means that the trans conformer is most stable.13 In addition to B3LYP method, we have optimized the neat Acr structures using HF and MP2 methods employing the same basis set for the sake of comparison with the experimental results. The numbering scheme used for describing the structural parameters is presented in Fig. 1b. The calculated structural parameters, the bond lengths and the bond angles for neat Acr in gas phase using ab initio methods HF and MP2, and DFT method with B3LYP functional are reported in Table 1 and these results match quite closely with the experimental data.14
 |
| | Fig. 1 Optimized geometries and total energies (a.u.) of C3H5NO (Acr), (a) Acr (cis); (b) Acr (trans); (c) self-associated dimer; (d) self-associated trimer. | |
Table 1 Observed and calculated structural parameters (bond lengths and bond angles) for neat Acr in gas phase using DFT method employing B3LYP functional in cis and trans form, and ab initio methods, HF and MP2 in trans forma
| |
(Acr)gas |
| Experimental |
B3LYP 6-311++G(d,p) |
MP2 6-311++G(d,p) |
HF 6-311++G(d,p) |
|
Ref. 16
|
Cis
|
Trans
|
Trans
|
Trans
|
|
The atom numbering is shown in Fig. 1.
|
|
Bond length (Å)
|
|
r(C1–C2) |
1.31 |
1.33 |
1.33 |
1.34 |
1.32 |
|
r(C1–H1) |
0.97 |
1.08 |
1.08 |
1.08 |
1.08 |
|
r(C1–H2) |
0.95 |
1.08 |
1.08 |
1.08 |
1.08 |
|
r(C2–C3) |
1.49 |
1.49 |
1.46 |
1.49 |
1.32 |
|
r(C2–H3) |
0.96 |
1.08 |
1.06 |
1.08 |
1.08 |
|
r(C3–O) |
1.24 |
1.22 |
1.23 |
1.22 |
1.20 |
|
r(C3–N) |
1.33 |
1.37 |
1.36 |
1.37 |
1.35 |
|
r(N–H4) |
0.87 |
1.01 |
1.01 |
1.01 |
0.99 |
|
r(N–H5) |
0.89 |
1.01 |
1.01 |
1.01 |
0.99 |
| |
|
Bond angle (∠)
|
| ∠(C2C1H1) |
122.0 |
121.1 |
120.0 |
119.7 |
120.5 |
| ∠(C2C1H2) |
121.0 |
122.5 |
121.7 |
121.4 |
121.4 |
| ∠(H1C1H2) |
117.0 |
116.3 |
118.3 |
118.9 |
118.2 |
| ∠(C1C2C3) |
121.8 |
126.0 |
121.0 |
120.5 |
120.9 |
| ∠(C1C2H3) |
122.0 |
121.0 |
121.0 |
120.8 |
121.0 |
| ∠(C3C2H3) |
116.0 |
113.0 |
118.1 |
118.7 |
118.1 |
| ∠(OC3N) |
122.3 |
122.3 |
122.2 |
122.6 |
122.3 |
| ∠(OC3C2) |
121.7 |
120.7 |
123.2 |
123.4 |
123.0 |
| ∠(NC3C2) |
116.0 |
117.0 |
115.5 |
114.1 |
114.7 |
| ∠(C3NH4) |
118.0 |
116.7 |
118.0 |
118.4 |
118.5 |
| ∠(C3NH5) |
121.0 |
121.1 |
122.0 |
122.3 |
122.5 |
| ∠(H4NH5) |
121.0 |
117.7 |
119.0 |
119.2 |
119.1 |
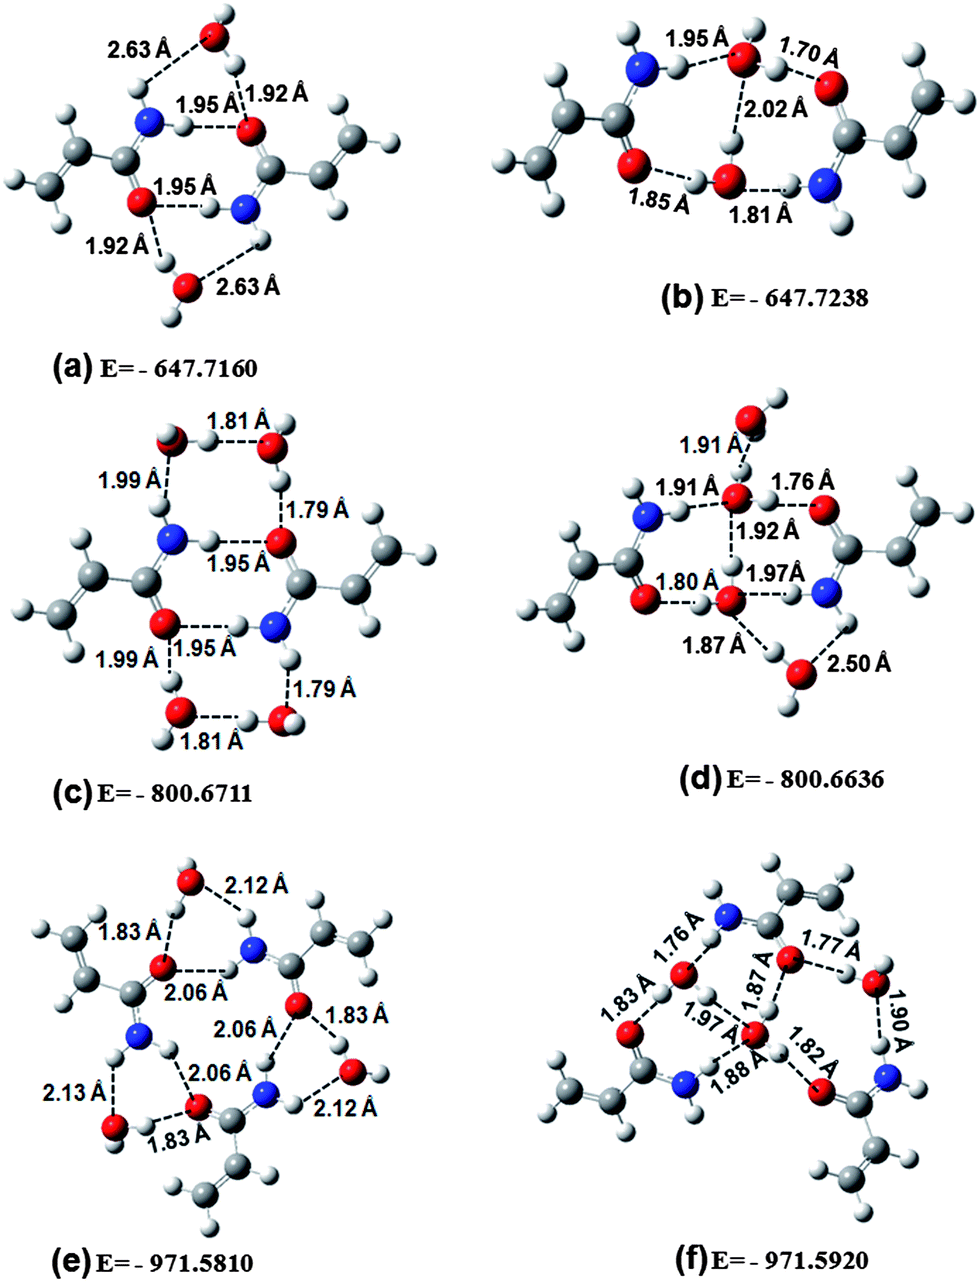
Theoretically several Acr dimers could be obtained through the mutual interaction of two Acr trans monomers.13 The four most stable of these dimers correspond to molecular configurations displaying intra- and inter-molecular hydrogen bonds involving the C![[double bond, length as m-dash]](https://www.rsc.org/images/entities/char_e001.gif) O from one Acr molecule, and the –CH2 and/or –NH2 group from the other, similar to the commonly observed hydrogen bond network occurring in polymers (alkylacrylamides).32 It is a well known fact that in the presence of –NH2 and –CO groups in both the trans and cis conformers of Acr, a significant amount of inter-molecular hydrogen bonding is expected to occur.13,33
O from one Acr molecule, and the –CH2 and/or –NH2 group from the other, similar to the commonly observed hydrogen bond network occurring in polymers (alkylacrylamides).32 It is a well known fact that in the presence of –NH2 and –CO groups in both the trans and cis conformers of Acr, a significant amount of inter-molecular hydrogen bonding is expected to occur.13,33
In the present study the dimeric structure having lowest energy, in comparison to the three other dimeric structures reported in an earlier study,13 was taken for further calculations involving Acr dimers and this structure is presented in Fig. 1c. In addition to dimer we have also calculated the optimized structure of the trimer which is presented in Fig. 1d. The hydrogen bond lengths in the trimer are calculated to be 1.88 Å, whereas in the case of dimer the corresponding value was 1.86 Å (see Fig. 1c). The binding energies (BE) of dimer, trimer and various hydrogen bonded complexes were also calculated, primarily to look for the relative stability of various complexes, and the results are presented in Table 2. In order to have a better estimate of the binding energy, the basis-set superposition error (BSSE) correction was applied in the optimized structure of the various clusters by the standard counterpoise method34,35 in which the binding energy (BE) of a complex is defined as:
| | | ΔE = [ESA/HB complex − ∑Eindividual] + EBSSE, | (1) |
where,
ESA/HB (SA: self associated; HB: hydrogen bonded complex) is the ground state energy of the self associated or hydrogen bonded complex and ∑
Eindividual is the sum of the ground state energies of all the molecules in a particular self associated or hydrogen bonded cluster. The binding energy (BE) of the dimer (
Fig. 1c) and trimer (
Fig. 1d), per Acr molecule, was calculated with the help of above equation and their values were obtained to be 6.52 and 6.73 kcal mol
−1. Thus on the basis of calculated total binding energy, the trimeric geometry appears to be more stable. However, the hydrogen bond is stronger in the dimer in comparison to the trimer. In one of our recent studies,
19 non cyclic trimer of acrylonitrile was also found to be more stable in comparison to the dimer. The hydrogen bonding of three water molecules to the trimer of Acr also leads to two configurations (see
Fig. 2e and f) and follows almost a similar trend of hydrogen bonding patterns as the dimer to two water molecules (
Fig. 2a and b).
Table 2 Calculated bond lengths for neat Acr in gas phase, and bond lengths as well as binding energies (BE) using DFT method employing B3LYP functional for different possible clustersa
| Complex |
BE (kcal mol−1) |
Bond length (Å) |
| C1–C2 |
C1–H1 |
C1–H2 |
C2–C3 |
C2–H3 |
C3–O |
C3–N |
N–H4 |
N–H5 |
|
The value presented in parentheses () and [], shows the bond length of second and third Acr as dimer and trimer respectively.
|
| Acrcis |
|
1.33 |
1.09 |
1.08 |
1.49 |
1.08 |
1.22 |
1.37 |
1.01 |
1.01 |
| Acrtrans |
|
1.33 |
1.08 |
1.08 |
1.50 |
1.08 |
1.22 |
1.37 |
1.01 |
1.01 |
| Dimer |
13.05 |
1.33 |
1.08 |
1.08 |
1.49 |
1.09 |
1.24 |
1.35 |
1.03 |
1.01 |
| |
(1.33) |
(1.08) |
(1.08) |
(1.49) |
(1.09) |
(1.24) |
(1.35) |
(1.03) |
(1.01) |
| (Dimer + 2W)1st |
|
1.33 |
1.08 |
1.08 |
1.49 |
1.09 |
1.24 |
1.34 |
1.02 |
1.01 |
| |
(1.33) |
(1.08) |
(1.08) |
(1.49) |
(1.09) |
(1.24) |
(1.34) |
(1.02) |
(1.01) |
| (Dimer + 2W)2nd |
|
1.33 |
1.08 |
1.08 |
1.49 |
1.09 |
1.24 |
1.35 |
1.03 |
1.01 |
| |
(1.33) |
(1.08) |
(1.08) |
(1.50) |
(1.09) |
(1.23) |
(1.35) |
(1.02) |
(1.01) |
| (Dimer + 4W)1st |
|
1.33 |
1.08 |
1.08 |
1.49 |
1.09 |
1.25 |
1.34 |
1.02 |
1.02 |
| |
(1.33) |
(1.08) |
(1.08) |
(1.49) |
(1.09) |
(1.25) |
(1.34) |
(1.02) |
(1.02) |
| (Dimer + 4W)2nd |
|
1.33 |
1.08 |
1.08 |
1.49 |
1.09 |
1.24 |
1.34 |
1.02 |
1.01 |
| |
(1.33) |
(1.08) |
(1.08) |
(1.50) |
(1.09) |
(1.23) |
(1.35) |
(1.02) |
(1.01) |
| Trimer |
20.21 |
1.33 |
1.08 |
1.08 |
1.50 |
1.09 |
1.23 |
1.35 |
1.02 |
1.01 |
| |
(1.33) |
(1.08) |
(1.08) |
(1.50) |
(1.09) |
(1.23) |
(1.35) |
(1.02) |
(1.01) |
| |
[1.33] |
[1.08] |
[1.08] |
[1.50] |
[1.09] |
[1.23] |
[1.35] |
[1.02] |
[1.01] |
| (Trimer + 3W)1st |
|
1.33 |
1.08 |
1.08 |
1.49 |
1.09 |
1.24 |
1.34 |
1.02 |
1.01 |
| |
(1.33) |
(1.08) |
(1.08) |
(1.49) |
(1.09) |
(1.24) |
(1.34) |
(1.02) |
(1.01) |
| |
[1.33] |
[1.08] |
[1.08] |
[1.49] |
[1.09] |
[1.24] |
[1.34] |
[1.02] |
[1.01] |
| (Trimer + 3W)2nd |
|
1.33 |
1.08 |
1.08 |
1.50 |
1.09 |
1.23 |
1.35 |
1.03 |
1.01 |
| |
(1.33) |
(1.08) |
(1.08) |
(1.50) |
(1.09) |
(1.23) |
(1.35) |
(1.02) |
(1.01) |
| |
[1.33] |
[1.08] |
[1.08] |
[1.49] |
[1.09] |
[1.23] |
[1.34] |
[1.04] |
[1.01] |
| Acr + 1W |
12.48 |
1.33 |
1.08 |
1.08 |
1.49 |
1.09 |
1.23 |
1.36 |
1.01 |
1.01 |
| Acr + 2W |
19.89 |
1.33 |
1.08 |
1.08 |
1.49 |
1.09 |
1.24 |
1.35 |
1.02 |
1.01 |
| Acr + 3W |
28.36 |
1.33 |
1.08 |
1.08 |
1.49 |
1.09 |
1.24 |
1.35 |
1.03 |
1.01 |
| Acr + 4W |
35.96 |
1.33 |
1.08 |
1.08 |
1.49 |
1.09 |
1.24 |
1.34 |
1.03 |
1.01 |
| Acr + 5W |
43.42 |
1.33 |
1.08 |
1.08 |
1.49 |
1.09 |
1.24 |
1.34 |
1.02 |
1.01 |
| Acr + 6W |
55.22 |
1.33 |
1.08 |
1.08 |
1.49 |
1.09 |
1.24 |
1.34 |
1.02 |
1.02 |
| Acr + 7W |
62.94 |
1.33 |
1.08 |
1.08 |
1.49 |
1.09 |
1.25 |
1.34 |
1.02 |
1.02 |
| Acr + 8W |
70.34 |
1.33 |
1.08 |
1.08 |
1.48 |
1.09 |
1.25 |
1.34 |
1.02 |
1.02 |
| Acr + 9W |
78.65 |
1.33 |
1.08 |
1.08 |
1.48 |
1.09 |
1.25 |
1.34 |
1.02 |
1.02 |
| Acr + 10W |
89.31 |
1.33 |
1.08 |
1.08 |
1.49 |
1.09 |
1.25 |
1.34 |
1.02 |
1.02 |
| Acr + 11W |
101.21 |
1.33 |
1.08 |
1.08 |
1.48 |
1.09 |
1.25 |
1.34 |
1.02 |
1.02 |
| Acr + 12W |
110.67 |
1.33 |
1.08 |
1.08 |
1.48 |
1.09 |
1.25 |
1.34 |
1.02 |
1.02 |
| Acr + 13W |
121.53 |
1.33 |
1.08 |
1.08 |
1.49 |
1.09 |
1.25 |
1.33 |
1.02 |
1.02 |
| Acr + 14W |
134.54 |
1.33 |
1.08 |
1.08 |
1.49 |
1.09 |
1.25 |
1.33 |
1.02 |
1.02 |
| Acr + 15W |
147.21 |
1.33 |
1.08 |
1.08 |
1.49 |
1.09 |
1.25 |
1.33 |
1.02 |
1.02 |
 |
| | Fig. 2 Optimized geometries and total energies (a.u.) of self-associated clusters of Acr with water molecules: (a) self-associated dimer bonded to two water molecules (first configuration); (b) self-associated dimer bonded to two water molecules (second configuration); (c) self-associated dimer bonded to four water molecules (first configuration); (d) self-associated dimer bonded to four water molecules (second configuration); (e) self-associated trimer bonded to three water molecules (first configuration); (f) self-associated trimer bonded to three water molecules (second configuration). | |
In the present study, it is quite likely that both the dimer and trimer may coexist in some kind of equilibrium in neat Acr as well as in binary mixtures of Acr with water. By comparing the calculated energies of the Acr monomers to those of the dimer and trimer species obtained by full geometry optimization, it becomes quite evident that the dimer and trimer structures are more stable than the corresponding isolated monomers. We can also understand this phenomenon in the term of entropy at the molecular level. For the dimer and trimer, the formation of O⋯H–N bonds imposes more order on the system; the fact that the atoms of the system are more tied up (loss of degrees of freedom of the atoms) than in the monomer that leads to a decrease in the entropy of the system. From the DFT calculated results, the value of average entropy were obtained to be 74.8, 55.8 and 52.6 cal mol−1 K−1 for neat Acr, dimer and trimer, respectively. Thus the dimer and trimer have led to decrease in entropy and results in a more stable structure than the monomer. Overall, the molecules of neat Acr in condensed phases are expected to exist as a mixture of hydrogen bonded molecular adducts involving trans monomer of the isolated molecule, both the dimeric as well as the trimeric species.
As stated above, the dimer and trimer structure of Arc has a certain binding energy and in order to break these dimer and trimer structures a certain energy is required. In a neat Arc system there is always a certain proportion of monomer, dimer and trimer species available which may interact with the water molecule. Considering first the monomer and dimer structure of Arc, the addition of a small amount of water molecules is not sufficient to break them and may lead to two situations, one where the water molecule interacts with the Acr-dimer as shown in Fig. 2a and other where the water molecule interacts with the monomers of Acr to form a hydrogen bonded cluster as shown in Fig. 2b. Since the optimized energy of the structure shown in Fig. 2b is smaller than the structure shown in Fig. 2a, the water molecule interacts more freely with the monomer than the dimer. However, it is clear from the optimized structure shown in Fig. 2a that interaction of a water molecule slightly weakens the hydrogen bond of the original dimer. The stronger stability of the second configuration indicates that upon addition of water, both monomers presented in Acr interact with water to a larger extent. This fact is well correlated with the calculated entropy value 148.7 and 139.0 cal mol−1 K−1 for first and second configuration, respectively. On the other hand, by increasing the water content the interaction of water molecules to the available structures Fig. 2a and b also leads to two configurations (see Fig. 2c and d) and these structures also exhibit a similar trend of hydrogen bonding as the structure with two water molecules. In this case the calculated optimized energy of the first configuration (Fig. 2c) has 4.71 kcal mol−1 lower energy and thereby a higher stability in comparison to the second configuration (Fig. 2d). Surprisingly, the Acr dimer (Fig. 2c) is in a majority in 2![[thin space (1/6-em)]](https://www.rsc.org/images/entities/char_2009.gif) :4 Acr–W complexes due to the symmetrical arrangement of the cluster where strong hydrogen bonds between water play very crucial role. Moreover, both H atoms of N–H2 group are involved in the hydrogen bond and thereby create a higher stability in comparison to the second configuration. Thus the formation of a larger number of hydrogen bonds imposes more order on the system; the fact that the atoms of the system are more tied up (loss of degrees of freedom of the atoms) than in the second configuration leads to a decrease in the entropy of the system. DFT calculated results yielded the value of entropy to 171.5 and 177.3 cal mol−1 K−1 for (dimer + 4w)I configuration, (dimer + 4w)II configuration, respectively.
:4 Acr–W complexes due to the symmetrical arrangement of the cluster where strong hydrogen bonds between water play very crucial role. Moreover, both H atoms of N–H2 group are involved in the hydrogen bond and thereby create a higher stability in comparison to the second configuration. Thus the formation of a larger number of hydrogen bonds imposes more order on the system; the fact that the atoms of the system are more tied up (loss of degrees of freedom of the atoms) than in the second configuration leads to a decrease in the entropy of the system. DFT calculated results yielded the value of entropy to 171.5 and 177.3 cal mol−1 K−1 for (dimer + 4w)I configuration, (dimer + 4w)II configuration, respectively.
Moreover, using the entropy values, we have also calculated the Gibbs free energy (ΔG) in order to better understand the stability of the complexes. In doing so, we assumed the global process dimer → (dimer + 2w),1 (dimer + 2w),2 (dimer + 4w),1 and (dimer + 4w)2 structures to calculate the Gibbs free energy.
ΔG can be expressed as a function of enthalpy difference ΔH and entropy difference ΔS.
The enthalpy difference ΔH at 298.15 K is given by
| | | ΔH298 = ΔET + ΔE0v + Δ(ΔE298v) + ΔE298r + ΔE298t + Δ(PV) | (3) |
where,
ET is the total molecular energy (values of which are listed in
Table 3),
E0v is the zero-point energy (ZPE), Δ
E298v is the change in vibrational energy on going from 0 K to 298.15 K,
E298r and
E298t respectively represent the rotational and the translational energy, and PV is the work term. Note that we assume the last three terms in
eqn (3) are all zero for the equilibrium.
Table 3 Calculated optimized energies, zero-point energies plus thermal corrections and entropy of dimer, and their complexes with water in the gas phase using the DFT method employing B3LYP/6-311++G(d,p)
| System |
Optimized energies E (a.u.) |
ZPE + thermal (a.u.) |
Enthalpy H (a.u.) |
Entropy cal mol−1 K−1 |
| Dimer |
−494.7766 |
0.3322 |
−495.1088 |
111.58 |
| (Dimer + 2W)1 |
−647.7160 |
0.4368 |
−648.1528 |
148.66 |
| (Dimer + 2W)2 |
−647.7217 |
0.4394 |
−648.1611 |
139.00 |
| (Dimer + 4W)1 |
−800.6722 |
0.5453 |
−801.2175 |
171.27 |
| (Dimer + 4W)2 |
−800.6634 |
0.5442 |
−801.2076 |
177.34 |
Values of ZPE plus thermal corrections at T = 298 K and entropies are listed in Table 3 for the various complexes. From Table 3 and the above equation the values of ΔG were calculated to be −96046.16 kcal mol−1, −96048.49 kcal mol−1, −192101.06 kcal mol−1, and −192096.61 kcal mol−1 for the (dimer + 2w),1 (dimer + 2w),2 (dimer + 4w)1 and (dimer + 4w),2 respectively. Thus, Fig. 2a–f follow the same trend as the optimized energies of the structures. From the present DFT work carried out, differences in the free energy of the idealized species are insignificant under ambient conditions. In view of this fact, in a given solution there exists a population distribution across a range of species.
Similar arguments can be given for the trimeric structures of Acr. The trimers have a certain binding energy and initially when water is added there is a greater possibility that the water molecules will interact with the Acr monomer (Fig. 2f), whereas, there is always a possibility that some of the water molecules interact with the Acr-trimer (Fig. 2e). The interaction of water molecules weakens the hydrogen bonding with the Acr. In summary we can say that at lower dilution the hydrogen bonded complex of Acr-monomer, Acr-dimer and Acr-trimer may co-exist. Only at very high dilution since a water molecule weakens the hydrogen bonding with the Acr they may overcome the binding energy and the system will stabilized with hydrogen bonding to Acr monomers.
The effect of solvation is one of the fundamental issues in chemistry, biology and also in certain problems of physics because of the fact that the structure and reactivity of free molecules are very different from those in a solvent environment. In the present study, apart from the dimer, trimer and their hydrogen bonded complexes with water molecules, we have also performed a microsolvation study of Acr using theoretical calculations on the (Acr + Wn; n = 1, 2, 3, …, 15) complexes. For this study, we started our calculation by bringing the CO group of Acr close to one water molecule (see Fig. 3a). By successively adding water molecules (n = 2, 3, …, 15), it was seen that 15 water molecules are required to make a nearly spherical cell around the Acr molecule (see Fig. 3o). It is quite interesting to see that, apart from the N–H⋯O and O⋯H–O hydrogen bond between Acr and water molecule, the strong hydrogen bonding among the water molecules itself plays a crucial role in stabilizing a cluster of Acr and water molecules in the binary mixture. The structural parameters (bond lengths) of Acr in different hydrogen bonded complexes along with the corresponding BE are presented in Table 2. The BE of the hydrogen bonded complexes, Acr–Wn increase with an increasing number of water molecules (see Table 2). Successively adding a water molecule (n = 2, 3, …, 15) around the Acr molecule after a certain value does not change the structural parameter significantly as evident by the data reported in Table 2. However, upon increasing the number of waters, a strong hydrogen bonding interaction among water molecules becomes more crucial than Acr and water. We believe that the 15 water cluster around the first solvation shell of Acr should be stabilized and acquires the form of a tetrahedral structure of water cluster. In order to better understand the band shift we have also analyzed the charge distribution upon complexation which is shown in Table 4.
 |
| | Fig. 3 Optimized geometries and total energies (a.u.) of Acr monomer hydrogen bonded with water molecules: (a) one Acr molecule bonded to one water molecule; (b, c, d, e, f, g, h, i, j, k, l, m, n and o) one Acr molecule bonded to n = 2, 3, …, 15 water molecules, respectively. | |
Table 4 Calculated Mulliken charges on each atom of neat Acr and its different possible clusters with water in the gas phase using DFT methods employing B3LYP/6-311++G(d,p)a
| Complex |
O |
N |
C1 |
C2 |
C3 |
H1 |
H2 |
H3 |
H4 |
H5 |
|
The numbering of atoms is shown in Fig. 1. The value presented in parentheses () and [], shows the charges of second and third Acr as dimer and trimer, respectively.
|
| Acrtrans |
−0.379 |
−0.335 |
−0.597 |
0.404 |
−0.086 |
0.169 |
0.134 |
0.152 |
0.298 |
0.241 |
| Dimer |
−0.403 |
−0.416 |
−0.679 |
0.492 |
−0.121 |
0.154 |
0.154 |
0.165 |
0.420 |
0.235 |
| (−0.403) |
(−0.416) |
(−0.679) |
(0.492) |
(−0.121) |
(0.154) |
(0.154) |
(0.165) |
(0.420) |
(0.235) |
| (Dimer + 2W)1st |
−0.463 |
−0.326 |
−0.632 |
0.462 |
−0.133 |
0.139 |
0.155 |
0.163 |
0.362 |
0.293 |
| (−0.463) |
(−0.326) |
(−0.632) |
(0.462) |
(−0.133) |
(0.139) |
(0.155) |
(0.163) |
(0.362) |
(0.293) |
| (Dimer + 2W)2nd |
−0.436 |
−0.419 |
−0.654 |
0.496 |
−0.144 |
0.158 |
0.143 |
0.167 |
0.465 |
0.235 |
| (−0.413) |
(−0.422) |
(−0.660) |
(0.520) |
(−0.145) |
(0.168) |
(0.142) |
(0.154) |
(0.440) |
(0.228) |
| (Dimer + 4W)1st |
−0.484 |
−0.349 |
−0.583 |
0.398 |
−0.143 |
0.118 |
0.168 |
0.180 |
0.377 |
0.349 |
| (−0.483) |
(−0.353) |
(−0.568) |
(0.379) |
(−0.138) |
(0.119) |
(0.164) |
(0.180) |
(0.387) |
(0.347) |
| (Dimer + 4W)2nd |
−0.412 |
−0.349 |
−0.637 |
0.461 |
−0.166 |
0.149 |
0.141 |
0.169 |
0.371 |
0.281 |
| (−0.404) |
(−0.419) |
(−0.661) |
(0.498) |
(−0.150) |
(0.165) |
(0.145) |
(0.156) |
(0.483) |
(0.228) |
| Trimer |
−0.425 |
−0.416 |
−0.694 |
0.528 |
−0.179 |
0.135 |
0.157 |
0.158 |
0.498 |
0.240 |
| (−0.427) |
(−0.420) |
(−0.689) |
(0.517) |
(−0.173) |
(0.138) |
(0.156) |
(0.159) |
(0.498) |
(0.241) |
| [−0.425] |
[−0.424] |
[−0.691] |
[0.521] |
[−0.172] |
[0.132] |
[0.157] |
[0.160] |
[0.506] |
[0.242] |
| (Trimer + 3W)2nd |
−0.406 |
−0.407 |
−0.677 |
0.509 |
−0.175 |
0.166 |
0.148 |
0.152 |
0.478 |
0.231 |
| (−0.514) |
(−0.420) |
(−0.646) |
(0.391) |
(−0.004) |
(0.168) |
(0.151) |
(0.170) |
(0.481) |
(0.248) |
| [−0.430] |
[−0.425] |
[−0.663] |
[0.493] |
[−0.118] |
[0.168] |
[0.149] |
[0.158] |
[0.455] |
[0.228] |
| Acr + 1W |
−0.435 |
−0.391 |
−0.598 |
0.376 |
−0.029 |
0.196 |
0.137 |
0.154 |
0.295 |
0.252 |
| Acr + 2W |
−0.436 |
−0.415 |
−0.638 |
0.499 |
−0.135 |
0.164 |
0.147 |
0.163 |
0.426 |
0.233 |
| Acr + 3W |
−0.463 |
−0.427 |
−0.642 |
0.488 |
−0.113 |
0.157 |
0.150 |
0.164 |
0.451 |
0.230 |
| Acr + 4W |
−0.493 |
−0.397 |
−0.641 |
0.448 |
−0.081 |
0.163 |
0.150 |
0.167 |
0.458 |
0.240 |
| Acr + 5W |
−0.482 |
−0.365 |
−0.620 |
0.392 |
−0.101 |
0.159 |
0.154 |
0.176 |
0.367 |
0.319 |
| Acr + 6W |
−0.496 |
−0.451 |
−0.647 |
0.414 |
−0.057 |
0.159 |
0.150 |
0.187 |
0.399 |
0.355 |
| Acr + 7W |
−0.503 |
−0.488 |
−0.600 |
0.338 |
−0.032 |
0.156 |
0.148 |
0.213 |
0.417 |
0.376 |
| Acr + 8W |
−0.506 |
−0.496 |
−0.675 |
0.325 |
0.025 |
0.162 |
0.154 |
0.275 |
0.419 |
0.358 |
| Acr + 9W |
−0.536 |
−0.498 |
−0.665 |
0.280 |
0.095 |
0.164 |
0.149 |
0.278 |
0.417 |
0.356 |
| Acr + 10W |
−0.539 |
−0.527 |
−0.703 |
0.390 |
0.062 |
0.176 |
0.145 |
0.197 |
0.410 |
0.397 |
| Acr + 11W |
−0.535 |
−0.534 |
−0.739 |
0.422 |
0.039 |
0.157 |
0.153 |
0.251 |
0.413 |
0.387 |
| Acr + 12W |
−0.532 |
−0.531 |
−0.743 |
0.424 |
0.042 |
0.159 |
0.157 |
0.257 |
0.469 |
0.347 |
| Acr + 13W |
−0.521 |
−0.519 |
−0.760 |
0.439 |
0.041 |
0.154 |
0.158 |
0.269 |
0.473 |
0.402 |
| Acr + 14W |
−0.504 |
−0.503 |
−0.761 |
0.451 |
−0.081 |
0.151 |
0.187 |
0.281 |
0.431 |
0.409 |
| Acr + 15W |
−0.514 |
−0.514 |
−0.839 |
0.456 |
−0.092 |
0.153 |
0.228 |
0.292 |
0.433 |
0.415 |
Experimental results and discussion
Raman spectra of ν(C–C), (N–H5 bending + CH3 rocking vibrations) and amide vibrations
The Raman spectra of neat Acr and its binary mixtures with water, (Acr + W) at different mole fractions of the reference system, Acr acquired in the region, 1800–400 cm−1 are depicted in Fig. 4. The spectra were fitted using a non-linear curve fitting program Spectra Calc, which is specially suited for the analysis of Raman line profiles in order to get its multiple components. It is well known that the true Raman line is the Lorentzian profile whereas the finite opening of the slit in the Raman instrument contains the Gaussian profile. Thus, during the fitting of the Raman line profiles, each component was assumed to be a mixture of a Lorentzian (80%) and a Gaussian profile (20%), which is essentially as good as a Voigt profile.36,37 In order to check the uniqueness of the fitting parameters thus obtained, each spectrum was fitted giving reasonable initial guesses and each guess finally yielded the same fitted profiles and line shape parameters. The wavenumber positions and linewidths (FWHM) of the Raman peaks obtained by analyzing the observed Raman line profiles in the region, 1800–400 cm−1 at a different mole fraction in the complexes of Acr and water are presented in Table 5. Only three vibrational bands of Acr molecule show significant changes in their spectral features, peak position and/or linewidth upon dilution with water. As expected, the analysis of the experimentally measured spectra shows that the most relevant changes in the spectral features occur in the bands corresponding to C–C, N–H and as well as in the amide I and amide II regions, which comprise of the CO stretching and the NH5 deformation, respectively. A detailed description of the different normal modes of Acr, in terms of various internal coordinates, using potential energy distribution (PED) results, has been presented in Table 6. Moreover, the selected experimentally observed marker Raman bands were also compared to the theoretically calculated results in Table 7 using Gauss View.
 |
| | Fig. 4 Raman spectra of C3H5NO (Acr) in the region, 1800–400 cm−1 at different mole fractions of the reference system, Acr in the binary mixture (Acr + W) (a) neat, (b) 0.99, (c) 0.97, (d) 0.9, (e) 0.85, (f) 0.80, (g) 0.70, (h) 0.50 and (i) 0.30. | |
Table 5 Wavenumber positions and linewidths (FWHM) of the selected Raman peaks obtained by analyzing the observed Raman line profile in the region, 1800–400 cm−1 at different concentrations in the complexes of Acr and watera
| Acr mole fraction |
ν(C–C) |
ρ(NH5) |
Amide band |
| |
HB peak |
|
HB1 peak |
HB2 peak |
|
|
HB: hydrogen bonded; the value presented in parentheses {}, shows the linewidth (FWHM) of the corresponding peak.
|
| Neat |
841 |
— |
1142 |
— |
— |
1583 |
1634 |
1678 |
| {11} |
|
{12} |
|
|
{26} |
{12} |
{20} |
| 0.99 |
841 |
831 |
1141 |
1124 |
— |
1586 |
1632 |
1677 |
| {10} |
{20} |
{11} |
{52} |
|
{34} |
{16} |
{22} |
| 0.97 |
841 |
832 |
1141 |
1125 |
— |
1588 |
1631 |
1676 |
| {9} |
{21} |
{10} |
{53} |
|
{35} |
{17} |
{24} |
| 0.95 |
— |
834 |
— |
1123 |
— |
1594 |
1631 |
1675 |
| |
{20} |
|
{40} |
|
{36} |
{17} |
{25} |
| 0.90 |
— |
836 |
— |
1123 |
1105 |
1597 |
1632 |
1673 |
| |
{17} |
|
{30} |
{24} |
{35} |
{18} |
{27} |
| 0.85 |
— |
836 |
— |
1123 |
1094 |
1598 |
1631 |
1672 |
| |
{16} |
|
{34} |
{19} |
{36} |
{17} |
{29} |
| 0.80 |
— |
836 |
— |
1123 |
1094 |
1598 |
1631 |
1671 |
| |
{16} |
|
{34} |
{19} |
{37} |
{18} |
{30} |
| 0.70 |
— |
836 |
— |
1122 |
1093 |
1598 |
1631 |
1670 |
| |
{15} |
|
{31} |
{19} |
{37} |
{18} |
{32} |
| 0.50 |
— |
836 |
— |
1119 |
1090 |
1598 |
1631 |
1669 |
| |
{16} |
|
{31} |
{21} |
{36} |
{17} |
{33} |
| 0.30 |
— |
836 |
— |
1118 |
1090 |
1599 |
1631 |
1668 |
| |
{15} |
|
{30} |
{29} |
{38} |
{17} |
{35} |
Table 6 Assignment of different normal modes of Acr in terms of potential energy distribution (PED) obtained from DFT calculations {the numbering of atoms is given in Fig. 1b}a
| |
Wavenumber (cm−1) |
Contributions of normal coordinates (>3%) |
|
Abbreviations: δ, torsion; ν, stretching; β, in-plane bending; γ, out-of-plane bending.
|
| 1 |
100.60 |
δ(C2–C3)(59%) − γ(N–H5)(35%) − γ1(C2–C3)(4%) |
| 2 |
147.58 |
γ(N–H5)(66%) + γ1(C2–C3)(26%) + δ(C2–C3)(6%) |
| 3 |
275.48 |
β(C3–C2)(55%) + β1(C3–O)(40%) − β2(C2–C1)(3%) |
| 4 |
465.47 |
γ
1(C2–C3)(43%) + γ2(C2–C1)(36%) − δ1(C2–C1)(18%) |
| 5 |
466.32 |
β
3(C2–C3)(46%) + β1(C3–O)(20%) − β4(C3–N)(14%) − β(C3–C2)(10%) − ν(C3–C2)(5%) |
| 6 |
607.46 |
γ
2(C2–C1)(44%) − δ1(C2–C1)(31%) + γ1(C2–C3)(22%) |
| 7 |
616.80 |
β
3(C2–C3)(32%) − β1(C3–O)(25%) + β(C3–C2)(17%) − β2(C2–C1)(11%) + ν(C3–N)(7%) − β4(C3–N)(4%) |
| 8 |
811.88 |
ν(C3–C2)(57%) + β2(C2–C1)(13%) − β4(C3–N)(13%) + ν(C3–N)(7%) + β3(C2–C3)(5%) |
| 9 |
816.95 |
γ
1(C2–C3)(67%) − γ2(C2–C1)(23%) + δ1(C2–C1)(9%) |
| 10 |
1001.89 |
γ
3(C1–H2)(54%) − δ1(C2–C1)(24%) − γ2(C2–C1)(22%) |
| 11 |
1010.04 |
δ
1(C2–C1)(46%) + γ3(C1–H2)(40%) + γ2(C2–C1)(13%) |
| 12 |
1035.20 |
β
2(C2–C1)(34%) + β4(C3–N)(29%) + β5(C2–H3)(17%) + ν(C3–N)(11%) − ν(C3–C2)(5%) |
| 13 |
1110.01 |
β
4(C3–N)(28%) − β2(C2–C1)(27%) + ν(C3–N)(14%) + ν(C3–O)(10%) − β(C3–C2)(7%) − β5(C2–H3)(6%) + β1(C3–O)(4%) |
| 14 |
1283.67 |
β
5(C2–H3)(31%) + ν(C3–N)(28%) − β3(C2–C3)(11%) − β4(C3–N)(9%) − β2(C2–C1)(7%) − ν(C3–C2)(4%) − β6(N–H4)(3%) − β(C3–C2)(3%) |
| 15 |
1351.28 |
β
5(C2–H3)(19%) − β7(C1–H2)(19%) − ν(C3–N)(19%) + ν(C2–C1)(16%) + ν(C3–C2)(8%) + β3(C2–C3)(7%) − β2(C2–C1)(5%) + β4(C3–N)(4%) |
| 16 |
1437.15 |
β
7(C1–H2)(63%) + β5(C2–H3)(17%) + ν(C3–C2)(9%) − ν(C3–N)(5%) |
| 17 |
1618.80 |
β
6(N–H4)(88%) + ν(C3–N)(6%) + ν(C3–O)(4%) |
| 18 |
1683.41 |
ν(C2–C1)(61%) + β7(C1–H2)(12%) + ν(C3–O)(9%) − ν(C3–C2)(9%) − β5(C2–H3)(6%) |
| 19 |
1756.57 |
ν(C3–O)(66%) − ν(C3–N)(8%) − ν(C2–C1)(6%) − β1(C3–O)(6%) |
| 20 |
3137.29 |
ν(C2–H3)(40%) − ν(C1–H2)(33%) − ν(C1–H1)(26%) |
| 21 |
3148.94 |
ν(C2–H3)(58%) + ν(C1–H1)(27%) + ν(C1–H2)(14%) |
| 22 |
3235.06 |
ν(C1–H2)(53%) − ν(C1–H1)(46%) |
| 23 |
3594.85 |
ν(N–H4)(56%) + ν(N–H5)(43%) |
| 24 |
3727.45 |
ν(N–H4)(46%) − ν(N–H5)(42%) |
Table 7 Experimentally measured wavenumber positions of the vibrational bands of neat Acr, and calculated wavenumber positions of Acr in gas phase, its dimer and trimer employing the B3LYP functional along with the vibrational assignmentsa
| Experimental |
Theoretical (unscaled) |
Vibrational assignments |
| Acr |
Acrgas |
Dimer |
Trimer |
Using Gauss View |
|
ν, stretching; ρ, rocking; δ, in-plane bending; s, symmetric; as, asymmetric.
|
| 841 |
811 |
839 |
831 |
ν(C–C) |
| 1142 |
1110 |
1138 |
1122 |
ρ(NH5) + ρ(CH3) |
| 1280 |
1284 |
1314 |
1307 |
δ(CH) + ν(C–N) |
| 1430 |
1437 |
1450 |
1444 |
δ(C1H1 + C1H2 + C2H3) |
| 1583 |
1618 |
1627 |
1655 |
δ(NH) (amide II) |
| 1633 |
1683 |
1687 |
1682 |
ν(CC) |
| 1678 |
1756 |
1725 |
1709 |
ν(CO) (amide I) |
| 3007 |
3137 |
3139 |
3138 |
ν
s(C1H1 + C2H2) + νas(C2H3) |
| 3030 |
3148 |
3151 |
3151 |
ν
s(C1H1 + C1H2) + ν(C2H3) |
| 3100 |
3235 |
3251 |
3135 |
ν
as(C1H1 + C1H2) |
A close examination of the spectra presented in Fig. 4 reveals that upon dilution a noticeable asymmetry is observed in the spectral feature on the lower wavenumber side of the main peak at ∼842 cm−1. In order to make a clear presentation, the analyzed Raman spectra in the region, 870–790 cm−1 for the binary mixture, (Acr + W) at different mole fraction of the reference system, Acr are presented in Fig. 5. A careful line shape analysis yields a new band at mole fraction 0.99 at a separation of ∼10 cm−1 on the lower wavenumber side from the main peak at ∼842 cm−1. It is to be noted that at mole fraction 0.97, this additional spectral feature becomes more pronounced at the cost of a loss in the main peak intensity. This new band, which appears upon dilution by water, is obviously due to the hydrogen bonding interaction. On further dilution to the mole fraction 0.95 the hydrogen bonded peak becomes so prominent that the main peak at ∼842 cm−1 completely disappears. This corresponds to the situation that almost all Acr molecule formed a hydrogen bond with a water molecule and that the spectral features become unaltered on further dilution (Fig. 5 and Table 5). Similar observations have been observed in the earlier studies21,22 where the hydrogen bonded peak becomes so prominent that the peak corresponding to the unbounded species completely disappears. The analyzed Raman spectra in the region 1200–1000 cm−1 for the binary mixture (Acr + W) presented in Fig. 6 shows a similar observation that a new band (HB1) at mole fraction 0.99 at a separation of ∼18 cm−1 on the lower wavenumber side of the main peak at ∼1142 cm−1. The intensity of the peak (HB1) goes on increasing until mole fraction 0.95 and becomes unaltered after that. However, another peak (HB2) has been observed at the lower wavenumber side of the hydrogen bonded peak that appears at ∼1083 cm−1. Moreover, the intensity of this newly developed band (HB2) goes on increasing upon dilution which clearly indicates that the degree of hydrogen bonding in terms of multiple hydrogen bonded molecules is increasing.
 |
| | Fig. 5 Analyzed Raman spectra in the region, 870–780 cm−1 at different mole fractions of the reference system, Acr in the binary mixture (Acr + W) (a) neat, (b) 0.99, (c) 0.97, (d) 0.9, (e) 0.85, (f) 0.80, (g) 0.70, (h) 0.50 and (i) 0.30. | |
 |
| | Fig. 6 Analyzed Raman spectra in the region, 1200–1000 cm−1 at different mole fractions of the reference system, Acr in the binary mixture (Acr + W) (a) neat, (b) 0.99, (c) 0.97, (d) 0.95, (e) 0.9, (f) 0.85, (g) 0.80, (h) 0.70, (i) 0.50 and (j) 0.30. | |
The analyzed Raman spectra in the region 1800–1500 cm−1 for the binary mixture (Acr + W) are shown in Fig. 7. In this region three bands are observed at 1583, 1633 and 1678 cm−1 and these bands were assigned as amide II (NH in-plane bending), CC stretching and amide I (CO stretching vibrations), respectively. It is evident from the data presented in Table 5 that upon dilution the amide II (NH in-plane bending) shows ∼16 cm−1 up-shift. The observed upshift in wavenumber position for this band is due to repulsive interaction19,38 where charge redistributions were taking place upon hydrogen bond complexation. Further, DFT calculations reveal the remarkable variation in the H–N–H angle of Acr molecule in comparison to various clusters of hydrogen bonds. In the case of neat Acr this angle was calculated to be 119°, whereas this angle varied from 116° to 118° in the various possible clusters evident in Fig. 1–3. The CC and amide I (CO stretching vibrations) show a down-shift of 3 and ∼10 cm−1, respectively upon dilution. This is likely due to fact that when a water molecule attaches to the O atom of the Acr molecule through hydrogen bonding, the CO bond length increases (see Table 2, monomer) and consequently force constant decreases and results in a down-shift of this band. This fact may be also understood in terms of charge distribution as shown in Table 4. When the H atom of water comes near the O atom of the Acr molecule, the charge redistribution takes place which results into a shift of electronic charge from the C atom to the O atom and part of it is used in the formation of the hydrogen bond with water or in other words, we can say that the charge is shifted over to the O⋯H region (for the value see Table 4). Although the shifts observed in Table 5 are due to the subsequent addition of water molecules to the Acr monomer. However, the inner- and outer-sphere complexes may play a significant role in helping to understand the interaction study. It has been reported earlier that the existence of Acr dimers are linked strongly by H-bonds in the unity cell.14 In this way, upon interaction with water the band shifts (Table 5) can be experienced as perturbations in the outer-sphere of Acr dimers and results in the interaction of water molecules to the Acr monomer causing the down-shift in ν(CO). However, the ν(CO) shifts to higher wavenumber in CHCl310 have also been reported due to a low dielectric constant. It seems that in the case of CHCl3, Acr dimers seem to be a majority while monomers bonded to water are favored in the case of water solvent due to its high dielectric constant. When we look at the trend of concentration dependent linewidth variation upon dilution, all these three bands (1583, 1633 and 1678 cm−1) show broadening due to an increasing diffusion effect.39
 |
| | Fig. 7 Analyzed Raman spectra in the region, 1800–1500 cm−1 at different mole fractions of the reference system, Acr in the binary mixture (Acr + W) (a) neat, (b) 0.9, (c) 0.85, (d) 0.80, (e) 0.70, (f) 0.50. | |
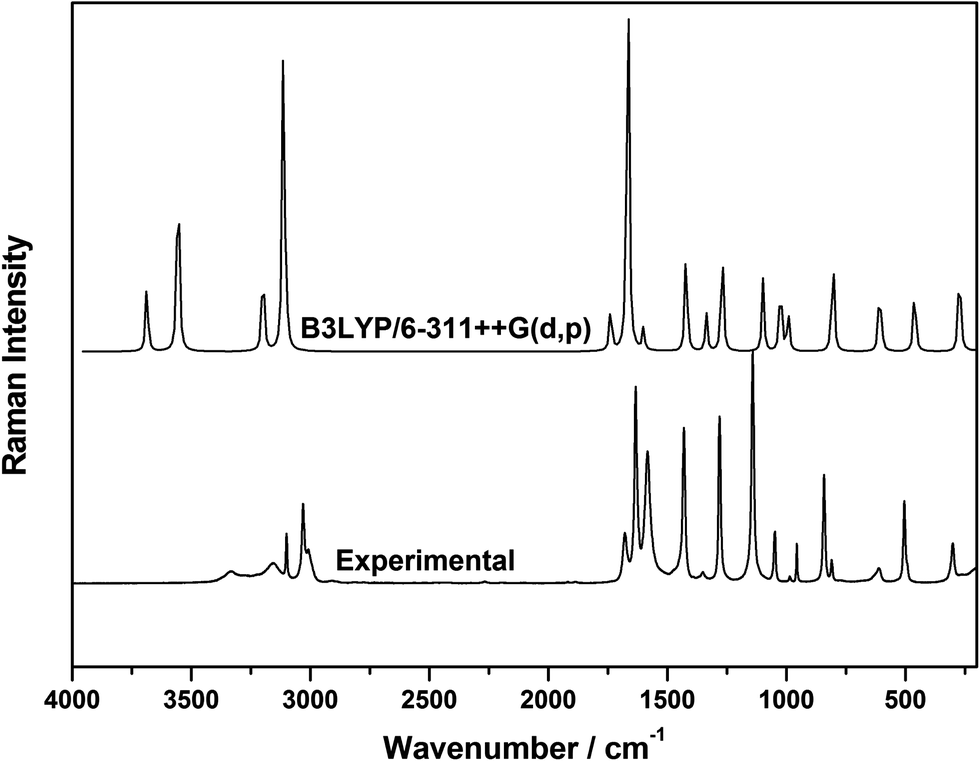
Correlation of experimental and theoretical results
It is a well known fact that the calculated harmonic vibrational transition frequencies overestimate the observed anharmonic vibrational frequencies.23 In view of this, we scaled the normal mode frequencies with the standard scaling factor for the B3LYP/6-311++G(d,p) level, of theory,40 and good agreement, shown in Fig. 8, between the experimental results was obtained. The experimentally measured wavenumber positions of the vibrational bands of neat Acr, and calculated unscaled wavenumber positions of Acr in gas phase as well as its dimer and trimer along with the vibrational assignments are presented in Table 7. Further, it is to be noted that the quantum chemical calculations yield Raman activities for the different normal modes, which cannot be taken directly as Raman intensities. The Raman scattering cross sections, ∂σ/∂Ω, which are proportional to the Raman intensities, may be calculated from the Raman scattering amplitude and the predicted wavenumber for each normal mode using the relationship:41,42| |  | (4) |
where, ν0 is the exciting frequency, νj is the vibrational frequency of the jth normal mode, Sj is the corresponding Raman scattering amplitude obtained from DFT calculations and h, c and k are the universal constants. In the present study the Raman intensities obtained using this relationship match nicely with the experimentally observed intensities, which is quite similar to the results reported in some of our recent studies also.18,20,22,31,43
 |
| | Fig. 8 Comparison of the experimentally observed and calculated room temperature Raman spectra of Acr in gas phase using the DFT method employing the B3LYP functional with the highest level, basis set 6-311++G(d,p). | |
It was observed experimentally that when water molecules are introduced to the Acr, one additional peak at 831 cm−1 (10 cm−1 away on the lower wavenumber side of the main band at ∼842 cm−1) and another peak at 1124 cm−1 (18 cm−1 away on lower wavenumber side of the main band at ∼1142 cm−1) are observed. In order to simulate our experimental findings, detailed theoretical calculations were performed taking several possible structures (see Fig. 1–3). Fig. 1 shows the possible self-associated structures in neat Acr, whereas, Fig. 2 shows the hydrogen bonded species dimer + 2W, dimer + 4W and trimer + 3W showing the situation of stoichiometric ratio 1:1 [Acr + 1W (Fig. 3a), dimer + 2W and trimer + 3W] and 1:2 (dimer + 4W). The stoichiometric ratio 1:1 corresponds to the experimental situation at 0.5 mol fraction whereas, the stoichiometric ratio 1:2 corresponds to the experimental situation at 0.33 mol fraction. It is clear that in the stoichiometric ratio 1:2 the Arc molecule makes a greater number of hydrogen bonds than the stoichiometric ratio 1:1. This is also observed in the experimental Raman spectra that the additional hydrogen bond peak (HB2) appears at high dilution. The calculated structures shown in Fig. 3 visualize the solvent environment around the Acr or Acr solvation with water where the strong interaction among water became more crucial.
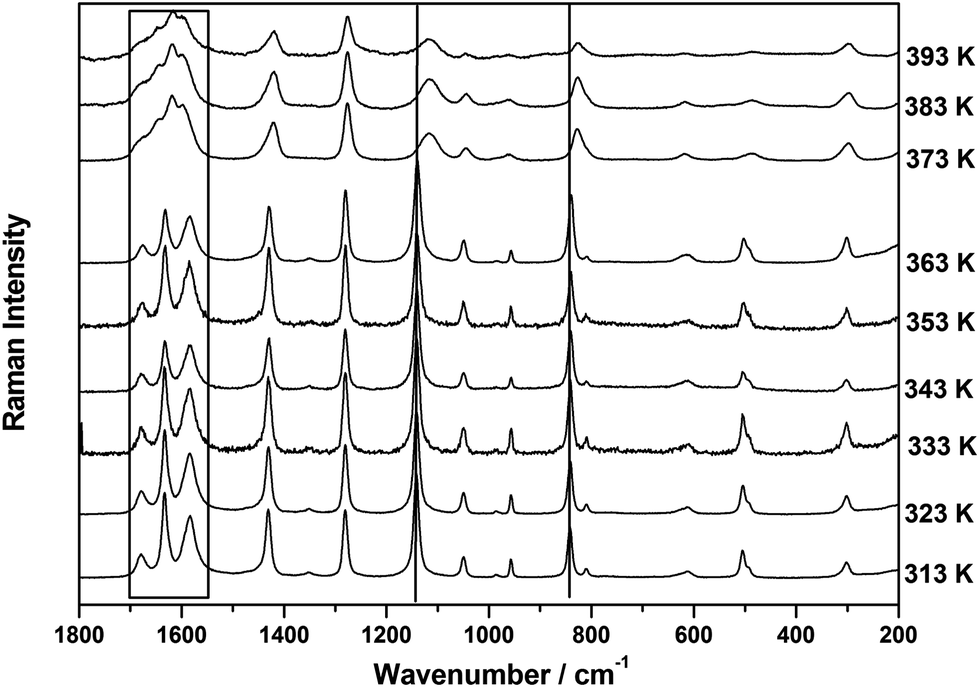
Temperature dependent Raman spectra of acrylamide
The Raman spectra recorded in the spectral region, 1800–200 cm−1 at 9 different temperatures varying in the range, 313–393 K presented in Fig. 9 show significant spectral variation when the system undergoes crystalline → liquid phase transition. A systematic study of the peak position and the linewidth variation may throw some light on the structural transformation that takes place at the transition point. Phase transitions in crystalline solids are associated with large scale changes in molecular structure and orientation. Temperature dependence of hydrogen bonding in the formamide and N-methylacetamide were studied by IR/Raman spectroscopy in combination with DFT calculations and quantum statistical models.44−45 These studies show nicely the temperature induced structural changes in the molecular clusters and conformations. The spectral changes essentially induce variations in both dipole moment and polarizability with respect to a normal coordinate, which lead to changes in the spectral features in the infrared (IR) and Raman spectra. Such spectral changes are, however, mode specific and a particular vibrational band may be more informative than others in case of a particular phase transition. In order to derive some meaningful conclusions from the spectral variations at different temperatures, all the spectra were analyzed and the corresponding parameters are presented in Table 8.
 |
| | Fig. 9 Temperature dependent Raman spectra of Acr in the region, 1800–200 cm−1, at nine different temperatures. | |
Table 8 Wavenumber positions and linewidths (FWHM) of some selected Raman peaks of the Acr molecule obtained by deconvoluting the observed Raman line profile in the 300–3200 cm−1 region at different temperaturea
| Temperature/K |
| 308 |
313 |
323 |
333 |
343 |
353 |
363 |
373 |
383 |
393 |
|
The values presented in parentheses show the corresponding linewidth.
|
|
Peak position
|
| 841.5 |
841.7 |
841.4 |
841.0 |
840.8 |
840.4 |
839.5 |
826.1 |
825.4 |
825.7 |
| (10.48) |
(10.50) |
(10.81) |
(11.10) |
(11.40) |
(11.08) |
(11.61) |
(25.18) |
(25.71) |
(27.0) |
| 956.3 |
956.6 |
956.7 |
956.7 |
956.9 |
956.8 |
956.7 |
963.1 |
964.5 |
964.8 |
| (5.92) |
(5.99) |
(6.21) |
(6.29) |
(5.77) |
(5.47) |
(6.49) |
(34.74) |
(39.09) |
(39.04) |
| 1049.8 |
1049.7 |
1049.8 |
1049.9 |
1049.7 |
1049.5 |
1049.5 |
1045.3 |
1044.7 |
1044.7 |
| (10.1) |
(10.3) |
(10.4) |
(6.29) |
(11.81) |
(11.12) |
(11.19) |
(27.17) |
(21.98) |
(15.16) |
| 1141.8 |
1141.6 |
1141.4 |
1141.1 |
1140.8 |
1140.3 |
1139.7 |
1116.3 |
1115.0 |
1117.0 |
| (12.12) |
(12.13) |
(12.61) |
(13.37) |
(13.31) |
(13.57) |
(14.85) |
(43.71) |
(48.24) |
(57.41) |
| 1280.5 |
1280.4 |
1280.3 |
1280.3 |
1280.4 |
1280.2 |
1279.2 |
1276.0 |
1275.9 |
1275.8 |
| (11.10) |
(11.09) |
(11.06) |
(11.35) |
(11.33) |
(11.13) |
(11.24) |
(16.75) |
(16.92) |
(17.39) |
| 1431.0 |
1430.4 |
1430.7 |
1430.5 |
1430.2 |
1429.8 |
1429.4 |
1422.8 |
1422.0 |
1422.1 |
| (12.26) |
(12.39) |
(12.49) |
(13.03) |
(13.04) |
(12.65) |
(13.57) |
(26.39) |
(27.27) |
(27.29) |
| 1584.1 |
1584.2 |
1584.2 |
1584.8 |
1583.9 |
1584.9 |
1584.6 |
1596.5 |
1596.0 |
1598.7 |
| (27.14) |
(27.43) |
(27.78) |
(28.31) |
(27.90) |
(28.53) |
(29.01) |
(39.27) |
(38.0) |
(46.41) |
| 1633.1 |
1632.9 |
1632.8 |
1632.9 |
1632.3 |
1632.4 |
1631.8 |
1643.8 |
1643.9 |
1643.6 |
| (12.39) |
(12.43) |
(12.49) |
(12.88) |
(14.10) |
(13.97) |
(14.73) |
(43.84) |
(44.93) |
(44.99) |
| 1678.9 |
1678.7 |
1678.5 |
1678.1 |
1677.5 |
1676.3 |
1676.2 |
1682.1 |
1681.9 |
1681.3 |
| (20.94) |
(20.99) |
(21.04) |
(20.56) |
(20.67) |
(19.46) |
(20.71) |
(31.29) |
(30.50) |
(37.39) |
| 3009.5 |
3009.4 |
3009.2 |
3010.0 |
3010.2 |
3008.1 |
3005.8 |
2996.0 |
2995.5 |
2994.0 |
| (32.25) |
(32.43) |
(32.97) |
(29.95) |
(28.72) |
(30.65) |
(30.88) |
(25.54) |
(25.11) |
(25.14) |
| 3030.9 |
3030.7 |
3030.8 |
3030.7 |
3030.6 |
3030.3 |
3030.0 |
3030.3 |
3028.4 |
3029.0 |
| (11.41) |
(11.49) |
(11.60) |
(11.43) |
(12.71) |
(11.64) |
(13.58) |
(23.14) |
(23.09) |
(27.53) |
| 3100.3 |
3100.1 |
3100.2 |
3100.2 |
3100.2 |
3100.2 |
3100.1 |
3099.6 |
3098.5 |
3096.3 |
| (5.98) |
(6.13) |
(6.23) |
(6.17) |
(5.62) |
(6.17) |
(6.76) |
(18.06) |
(18.86) |
(28.63) |
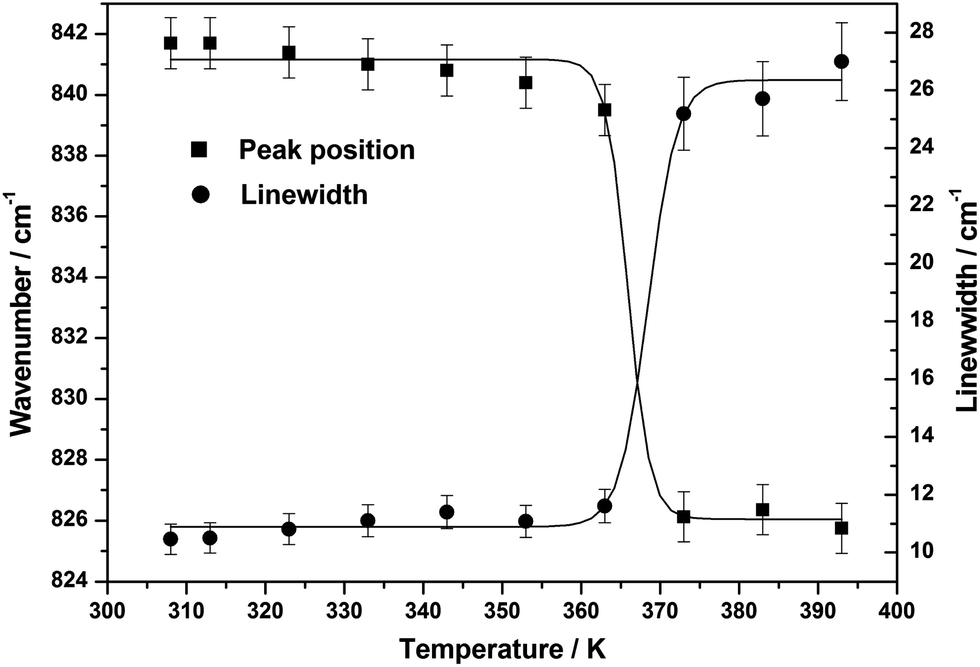
The C–C stretching mode and (N–H5 bending + CH3 rocking) vibrations which were observed at ∼832 cm−1 and ∼1142 cm−1 respectively, suddenly shift to the lower wavenumber side at the crystal → liquid transition (see Fig. 9). The variation of the peak position and linewidth of these two modes with temperature are presented in Fig. 10 and 11. At the transition point, a sudden change in the peak position on lower wavenumber side during crystal → liquid transition at 373 K is obvious from this plot (also see Table 8). In the case of ∼842 cm−1 band, this sudden variation is attributed to the fact that either the intermolecular interactions or the self associated clusters may induce a reduction of the electron density on the C–C bond, which, in turn, leads to a decrease in force constant for the ν(C–C) vibration and thereby resulting in a decrease in the wavenumber of this vibration by ∼12 cm−1. When we look at the temperature dependent linewidth variation of the ν(C–C) vibration, a sudden linewidth broadening was also observed at the crystal → liquid transition. The linewidth of the ν(C–C) vibrational band, as shown in Fig. 11, increases suddenly by more than ∼14 cm−1 at the crystal → liquid transition. The experimentally observed Raman linewidth has contributions from both the intrinsic linewidth and the temperature dependent part. Additional broadening is introduced by the instrumental slit also. However, the contribution to the linewidth due to slit function is very small when the Raman linewidth is more than four times the slit function.46 The spectra are recorded at 100 μm slit opening which corresponds to a spectral slit width of ∼1 cm−1. Since the linewidth of the bands considered are 10 cm−1 or more, the effect of the slit function is almost negligible. The experimentally observed linewidth can be expressed as the sum of two contributions:
where ‘
Γi’ is the intrinsic linewidth and ‘
Γt’ is the temperature dependent contribution to the linewidth. Due to an increase in temperature there is a consistent increase in linewidth. After the transition point, the observed increase in the linewidth is most likely due to the second term in the above expression. The increase in the linewidth of the ∼842 cm
−1 band is consistent with the jump activation model.
47 Almost the same trends, a sudden down-shift in peak position and linewidth broadening of the ∼1142, ∼1280, and ∼1431 cm
−1 bands were also observed at crystal → liquid transition (see
Table 8). However, in the spectral region 1725–1525 cm
−1, the amide vibrational band shows a different type of behavior at the transition temperature, where a new band appears at ∼1620 cm
−1. The spectral changes in this region with temperature have been explored in the forthcoming section.
 |
| | Fig. 10 Variation of the peak position and linewidth of the ∼842 cm−1 band with temperature. | |
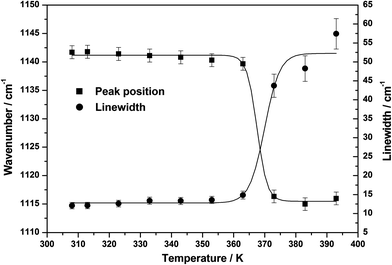 |
| | Fig. 11 Variation of the peak position and linewidth of the ∼1142 cm−1 band with temperature. | |
Deconvolution of spectral regions of amide vibrations at different temperatures
At any transition point, certain obvious changes, such as appearance or disappearance of some Raman bands, are generally observed.48 In addition, a careful study of both linewidth changes, which reflect variation in the dynamic processes and shifts in peak positions, which are basically the characteristic of static processes, help visualize the dynamics and molecular changes taking place at the transition point. In order to make a clear presentation of amide vibrations at different temperatures, the deconvoluted Raman spectra in the region, 1720–1540 cm−1 are presented in Fig. 12. It is evident from the spectra presented in Fig. 12 that at crystal → liquid transition, the bands at 1583, 1633 and 1678 cm−1, which were assigned to amide II (NH in-plane bending), ν(CC) and amide I (CO stretching) vibrations, respectively show a sudden up-shift (see Table 8). The possible reason of up-shift of this amide band may be due to predominant repulsive interactions among Acr molecules in the liquid phase, where dynamics is relatively fast during the normal mode of vibration. We attributed the up-shifts observed for these bands to the complexation-induced breakdown of the intermolecular hydrogen bonding network in the Acr dimer and trimer. However, the increase in the linewidth of the amide bands are again consistent with the jump activation model.47 The development of a new band at 1620 cm−1 at crystal → liquid transition, may be attributed to the fact that in the liquid phase of Acr, another conformer of dimer as reported earlier13 or cis conformer of Acr dimer may become more pronounced and give rise to a new band.
 |
| | Fig. 12 Temperature dependent analyzed Raman spectra of Acr in the amide region, 1720–1540 cm−1 at nine different temperatures. | |
Conclusions
Intermolecular hydrogen bonding in the binary mixture of acrylamide and water; (Acr + W) was investigated using micro Raman spectroscopy and DFT calculations. It is evident from our experimental results that the ν(C–C), ρ(NH5 bending + CH3 rocking) and the amide band are very sensitive to both the aqueous environment and temperature. Upon dilution with water, the additional peaks were observed at ∼831 and ∼1124 cm−1, which are ∼10 and ∼18 cm−1 away on lower side away from the main bands at ∼842 and ∼1142 cm−1, respectively and these are attributed to the hydrogen bonding of Acr with water. A sudden spectral change was observed at crystal → liquid transition (373 K) and all the spectral features, in general, are showing a broadening. A new peak was also observed at 1620 cm−1 due to change in symmetry of the self associated dimers and trimers of the Acr molecule at 373 K. In order to support our experimental results, detailed DFT calculations were performed to obtain the ground state geometry in gas phase for neat Acr, self associated dimer, trimer and their hydrogen bonded complexes with water. Apart from these calculations, microsolvation study of Acr molecule (Acr + Wn complexes; n = 1, 2, …, 15) has also been performed. In the neat Acr, two geometries were proposed as having cis and trans conformer. From the two conformers, the geometry with the trans conformer was found to be more stable in the condensed phase, both in the solid and in aqueous environment, Acr exists mainly as a mixture of several dimeric and trimeric species, the most favoured being the dimers formed from the trans monomer. Increased computational resources have opened up avenues for a high-level molecular dynamics simulation study of complex hydrogen bonded systems and the results of our DFT derived structures and vibrational spectra of the Acr–W system may serve as a starting point for ab initio MD or CPMD simulations.
Acknowledgements
SS would like to thank the U.G.C., New Delhi for a Research Fellowship in Science for Meritorious Students (UGC-RFSMS).
References
- G. R. Desiraju, Supramolecular Synthons in Crystal Engineering—A New Organic Synthesis, Angew. Chem., Int. Ed. Engl., 1995, 34, 2311 CrossRef CAS.
-
G. R. Desiraju, Crystal Engineering: The Design of Organic Solid, Elsevier, NewYork, 1989, p. 54 Search PubMed.
-
G. A. Jeffrey, An Introduction to Hydrogen Bonding, Oxford University Press, New York, 1997 Search PubMed.
-
G. R. Desiraju and T. Steiner, The Weak Hydrogen Bond in Chemistry and Biology, Oxford University Press, Oxford 1999 Search PubMed.
-
IUPAC Compendium of Chemical Terminology, Royal Society of Chemistry, Cambridge, 2nd edn, 1997 Search PubMed.
- E. Arunan, G. R. Desiraju, R. A. Klein, J. Sadlej, S. Scheiner, I. Alkorta, D. C. Clary, R. H. Crabtree, J. J. Dannenberg, P. Hobza, H. G. Kjaergaard, A. C. Legon, B. Mennucci and D. J. Nesbitt, Pure Appl. Chem., 2011, 83, 1619 CrossRef CAS PubMed.
- G. R. Desiraju, Angew. Chem., Int. Ed., 2011, 50, 52 CrossRef CAS PubMed.
-
V. O. Sheftel, Indirect Food Additives and Polymers: Migration and Toxicology, Lewis, London, 2000, p. 1114 Search PubMed.
- A. Besaratinia and G. P. Pfeifer, J. Natl. Cancer Inst., 2004, 96, 1023 CrossRef CAS PubMed.
- N. Jonathan, J. Mol. Spectrosc., 1961, 6, 205 CrossRef CAS.
- R. Murugan, S. Mohan and A. Bigotto, J. Korean Phys. Soc., 1998, 32, 505 CAS.
- C. Carra, N. Iordanova and S. Hammes-Schiffer, J. Phys. Chem. B, 2002, 106, 8415 CrossRef CAS.
- A. S. R. Duarte, A. M. Amorim da Costa and A. M. Amado, J. Mol. Struct.: THEOCHEM, 2005, 723, 63 CrossRef CAS PubMed.
- A. A. Udovenko and L. G. Kolzunova, J. Struct. Chem., 2008, 49, 961 CrossRef CAS PubMed.
- X. Chen, Y. Zhang, F. Yu and H. Wang, J. Solution Chem., 2010, 39, 1341 CrossRef CAS.
- D. K. Singh, S. Mishra, A. K. Ojha, S. K. Srivastava, S. Schlücker, B. P. Asthana, J. Popp and R. K. Singh, J. Raman Spectrosc., 2011, 42, 667 CrossRef CAS.
- D. K. Singh, S. K. Srivastava, S. Schlücker, R. K. Singh and B. P. Asthana, J. Raman Spectrosc., 2011, 42, 851 CrossRef CAS.
- S. Singh, D. K. Singh, S. K. Srivastava and B. P. Asthana, Vib. Spectrosc., 2011, 56, 26 CrossRef CAS PubMed.
- D. K. Singh, S. K. Srivastava and B. P. Asthana, Chem. Phys., 2011, 380, 24 CrossRef CAS PubMed.
- S. Singh, D. K. Singh, S. K. Srivastava and B. P. Asthana, Zeit. für Phys. Chem., 2011, 225, 723 CAS.
- S. Schlücker, R. K. Singh, B. P. Asthana, J. Popp and W. Kiefer, J. Phys. Chem. A, 2001, 105, 9983 CrossRef.
- S. Schlücker, J. Koster, R. K. Singh and B. P. Asthana, J. Phys. Chem. A, 2007, 111, 5185 CrossRef PubMed.
-
M. J. Frisch, G. W. Trucks, H. B. Schlegel, G. E. Scuseria, M. A. Robb, J. R. Cheeseman, V. G. Zakrzewski, J. A. Montgomery, Jr, R. E. Stratmann, J. C. Burant, S. Dapprich, J. M. Millam, A. D. Daniels, K. N. Kudin, M. C. Strain, O. Farkas, J. Tomasi, V. Barone, M. Cossi, R. Cammi, B. Mennucci, C. Pomelli, C. Adamo, S. Clifford, J. Ochterski, G. A. Petersson, P. Y. Ayala, Q. Cui, K. Morokuma, D. K. Malick, A. D. Rabuck, K. Raghavachari, J. B. Foresman, J. Cioslowski, J. V. Ortiz, A. G. Baboul, B. B. Stefanov, G. Liu, A. Liashenko, P. Piskorz, I. Komaromi, R. Gomperts, R. L. Martin, D. J. Fox, T. Keith, M. A. Al-Laham, C. Y. Peng, A. Nanayakkara, M. Challacombe, P. M. W. Gill, B. Johnson, W. Chen, M. W. Wong, J. L. Andres, C. Gonzalez, M. Head-Gordon, E. S. Replogle and J. A. Pople, Gaussian 03, Revision C.02, Gaussian, Inc., Wallingford CT, 2004 Search PubMed.
- A. D. Becke, Phys. Rev. A, 1988, 38, 3098 CrossRef CAS.
- A. D. Becke, J. Chem. Phys., 1993, 98, 5648 CrossRef CAS.
- A. D. Becke, J. Chem. Phys., 1997, 107, 8554 CrossRef CAS.
- H. L. Schmider and A. D. Becke, J. Chem. Phys., 1998, 108, 9624 CrossRef CAS.
- M. A. McAllister, J. Mol. Struct.: THEOCHEM, 1998, 427, 39 CrossRef CAS.
- R. Krishnan, J. S. Binkley, R. Seeger and J. A. Pople, J. Chem. Phys., 1980, 72, 650 CrossRef CAS.
- D. K. Singh, S. K. Srivastva, A. K. Ojha and B. P. Asthana, Spectrochim. Acta, Part A, 2008, 71, 823 CrossRef PubMed.
- D. K. Singh, S. K. Srivastva, A. K. Ojha and B. P. Asthana, J. Mol. Struct., 2008, 892, 384 CrossRef CAS PubMed.
- D. M. Duffy and P. M. Rodger, J. Am. Chem. Soc., 2002, 124, 5206 CrossRef CAS PubMed.
- M. Kobayashi and M. Kobayashi, J. Phys. Chem., 1980, 84, 781 CrossRef CAS.
- S. Simon, M. Duran and J. J. Dannemberg, J. Chem. Phys., 1996, 1105, 11024 CrossRef.
- S. F. Boys and F. Bernardi, Mol. Phys., 1970, 19, 553 CrossRef CAS.
- B. P. Asthana and W. Kiefer, Appl. Spectrosc., 1982, 36, 250 CrossRef CAS.
- B. P. Asthana, W. Kiefer and E. W. Knapp, J. Chem. Phys., 1984, 81, 3774 CrossRef CAS.
- K. S. Schweizer and D. Chandler, J. Chem. Phys., 1982, 76, 2296 CrossRef CAS.
-
P. A. Egelstaff, An Introduction to Liquid State, Academic Press, New York, 1967 Search PubMed.
- M. P. Andersson and P. Uvdal, J. Phys. Chem. A, 2005, 109, 2937 CrossRef CAS PubMed.
- G. A. Guirgis, P. Klaboe, S. Shen, D. L. Powell, A. Gruodis, V. Aleksa, C. J. Nielsen, J. Tao, C. Zheng and J. R. Durig, J. Raman Spectrosc., 2003, 34, 322 CrossRef CAS , and references cited therein.
- P. L. Polavarapu, J. Phys. Chem., 1990, 94, 8106 CrossRef CAS.
- S. Singh, S. K. Srivastav and D. K. Singh, RSC Adv., 2013, 3, 4381 RSC.
- R. Ludwig, F. Weinhold and T. C. Farrar, J. Chem. Phys., 1995, 103, 3636 CrossRef CAS.
- R. Ludwig, O. Reis, R. Winter, F. Weinhold and T. C. Farrar, J. Phys. Chem. B, 1998, 102, 9312 CrossRef CAS.
- R. K. Singh, S. N. Singh, B. P. Asthana and C. M. Pathak, J. Raman Spectrosc., 1994, 25, 423 CrossRef CAS.
- P. Sarkar, P. Mandal, S. Paul and R. Paul, Liq. Cryst., 2003, 30, 507 CrossRef CAS.
- R. K. Singh, S. Schlücker, B. P. Asthana and W. Kiefer, J. Raman Spectrosc., 2002, 33, 720 CrossRef CAS.
|
| This journal is © The Royal Society of Chemistry 2014 |
Click here to see how this site uses Cookies. View our privacy policy here.