Study of single and double chain surfactant–cobalt(III) complexes and their hydrophobicity, micelle formation, interaction with serum albumins and antibacterial activities†
Selvakumar
Veeralakshmi
a,
Selvan
Nehru
a,
Sankaralingam
Arunachalam
*a,
Ponnuchamy
Kumar
b and
Munisamy
Govindaraju
b
aSchool of Chemistry, Bharathidasan University, Tiruchirappalli 620024, Tamil Nadu, India. E-mail: arunasurf@yahoo.com; Fax: +91-431-2407043/2407045; Tel: +91-431-2407053
bDepartment of Environmental Biotechnology, School of Environmental Sciences, Bharathidasan University, Tiruchirappalli 620024, Tamil Nadu, India
First published on 24th April 2014
Abstract
To develop surfactant based metallodrugs, it is important to know the role of the tail part of the surfactant–metal complexes in their hydrophobicity, micellization behaviour, interaction with biomacromolecules and cell penetration. Here, we have taken a new series of single and double chain surfactant–cobalt(III) complexes with alkylamine ligands of different chain length, [Co(dien)(DA)Cl2]ClO4 (1), [Co(dien)(HA)Cl2]ClO4 (2), [Co(dien)(DA)2Cl](ClO4)2 (3) and [Co(dien)(HA)2Cl](ClO4)2 (4), where dien = diethylenetriamine, DA = dodecylamine and HA = hexadecylamine. The complexes were characterised by elemental analysis, NMR, ESI-MS, UV-visible and FTIR techniques. In addition, the average size distribution and morphology of self-assembled surfactant–cobalt(III) complexes were examined by DLS and SEM, respectively. The hydrophobicity, critical micelle concentration (CMC) values, thermodynamics of micellization (ΔG°m, ΔH°m and ΔS°m) and the nature of the interaction of these complexes with bovine and human serum albumins (BSA/HSA) were evaluated. The obtained CMC values were in the order 1 > 2 > 3 > 4, indicating that double chain systems have lower CMC values compared to single chain systems due to the increase in the hydrophobicity of the alkyl amine ligands. The thermodynamics of micellization indicated that the process is spontaneous, exothermic and entropy driven. The interaction of complexes 1–4 with serum albumins indicated that the quenching process follows a static mechanism, and the extent of quenching and binding parameters were in the order 1 < 2 < 3 < 4. Interestingly, on increasing the temperature, the protein–complex stability decreased for the single chain systems, and increased for the double chain systems, probably due to the involvement of electrostatic and hydrophobic interactions. This was further supported by the thermodynamics of protein interaction and synchronous fluorescence studies. Moreover, the results from UV-vis, synchronous and circular dichroism (CD) showed the occurrence of conformational and micro environmental changes in BSA/HSA. It is also noted that BSA has more binding affinity with surfactant–metal complexes compared to HSA. Furthermore, the antimicrobial effects of these complexes were investigated by disk diffusion method; complex 4 has a better antimicrobial activity due to the ease of bacterial cell penetration due to its more hydrophobic nature.
Introduction
Designing effective metallodrugs with reduced side effects against human diseases is an active area of research, and the structural modification of metallodrugs can alter their affinity for biomacromolecules such as nucleic acids, proteins etc. In the field of drug design, issues such as solubility, transfection efficiency, targeted delivery etc. may enter as practical problems. To overcome these problems, drug carriers like surfactants, liposomes, vesicles, cationic polymers and dendrimers are employed for efficient drug delivery. In this context, metallosurfactants have a distinctive place in designing metallodrugs. In drug design, the hydrophobicity of metal complexes plays a major role in the penetration of the cell membrane prior to cell death.1Surfactant–metal complexes are a new class of coordination compounds in which the metal containing coordination sphere acts as the hydrophilic head group, whereas the long alkyl chain containing ligand acts as hydrophobic tail group. Such surfactant–metal complexes are especially rare compared to conventional surfactants, but they have very important applications in diverse research subject areas such as magnetic resonance imaging,2,3 templating of mesoporous materials,4 thin-film opto-electronics,5 drug delivery6 and homogeneous catalysis.7,8 Several studies are available on the effect of the head and tail groups on the micellization behavior, but those are not yet conclusive in the case of surfactant–metal complexes. To develop surfactant-based metallodrugs, it is very important to know how the surfactant–metal complexes affect their hydrophobicity, critical micelle concentration, and their interaction with biomacromolecules such as proteins and nucleic acids, and biological activities such as antitumor, antimicrobial, antioxidant and anti-inflammatory.
Particularly, research on cobalt-based pharmaceuticals has attracted attention in the development of promising applications such as potential hypoxia-activated pro-drugs, chaperones of bioactive ligands to target tumors through bio-reductive activation, higher inhibition of chymotrypsin-like activity in purified proteasomes as well as improved apoptotic induction in PC-3 cancer cells, artificial proteases and last, but not least, the HIV protease inhibitor9 and clinically approved cobalt(III) Schiff base complex Doxovir.10,11
Protein–drug interactions are closely related to drug efficiency in the treatment of diseases, because the absorption, transportation, distribution and metabolism of drugs strongly depend on their binding properties.12 Generally, a strong binding with protein decreases the concentration of free drug in the plasma, whereas weak binding leads to a shorter lifetime or poor distribution of drugs. Moreover, the investigation of the binding of drugs to serum albumins has provided great toxicological and medical insights, and it may provide key information to the field of rational drug design.13–15 Even though many surfactants exhibit very good antibacterial activities, the impact of the protein binding affinity of metallosurfactants on their antibacterial activities is still not clear.
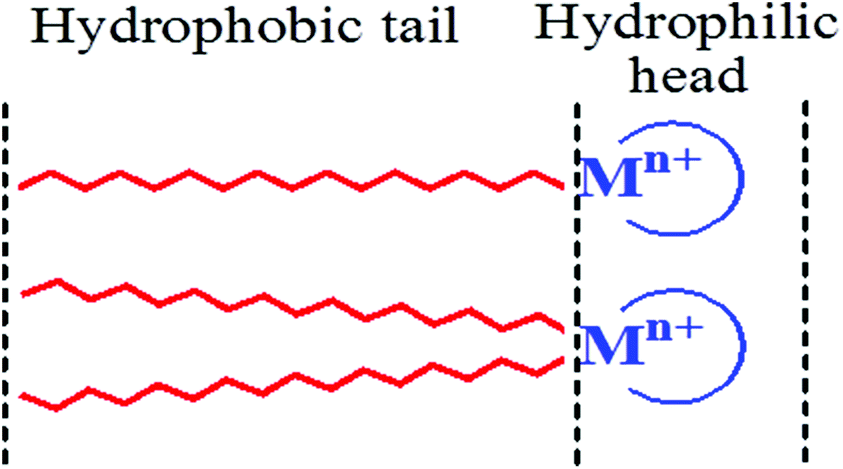
The interaction of proteins with surfactants mainly depends on surfactant features like size, charge, chain length, hydrophobicity, concentration, etc. Several reports have investigated the interaction of proteins with conventional surfactants but reports on surfactant–metal complexes are limited. Thus, the present study focuses on single and double chain surfactant–cobalt(III) complexes (Fig. 1) and their hydrophobicity, CMC and thermodynamic parameters, and their interactions with BSA and HSA. To extend our study we also investigated their antibacterial activity by disk diffusion method using some human pathogenic strains.
 | ||
| Fig. 1 Structural representation of single and double chain surfactant metal complexes. | ||
Results and discussion
Characterization of surfactant–cobalt(III) complexes
The single and double chain surfactant–cobalt(III) complexes were synthesised from [Co(dien)Cl3] by a ligand substitution method in which one or two labile chloride ligands were replaced by one or two amine groups of the alkylamine ligands (Scheme 1). The UV-visible absorption spectra of the surfactant–cobalt(III) complexes clearly show an intense band around 213–219 nm due to N(σ)→Co(III) charge transfer and a band around 511–522 nm due to d–d transitions.16 The IR spectra show the characteristic vibrational frequencies for the formation of surfactant–cobalt(III) complexes. In the precursor complex [Co(dien)Cl3] the N–H and C–H symmetric and asymmetric stretching vibrational bands around 3615, 2852 and 2921 cm−1 are red shifted to 3439, 2849 and 2917 cm−1 after coordination with alkylamine in the surfactant–cobalt(III) complexes (Fig. S1†). These shifts can be explained by the fact that the nitrogen atom of the alkyl amine ligand donates a pair of electrons to the cobalt centre forming a coordinate bond. The band observed around 1113 cm−1 can be assigned to perchlorate ionic species; this means that the counter ion is not involved in the coordination to cobalt. Furthermore, the bands around 627 and 1088 cm−1 can be attributed to the (Co–N) and (C–N) stretching vibrations of surfactant–cobalt(III) complexes.17 The 1H NMR spectra also corroborated the structure of surfactant-cobalt(III) complexes. The methylene protons of the alkyl amine chains and diene ligands appeared in the region of 0.99–3.08 ppm for complexes 1–4 (Fig. S2†). A typical triplet signal at 0.84 ppm corresponds to the terminal methyl group of the long aliphatic alkyl amine chain. The N–H protons appeared as broad peaks in the region of 4.60–8.00 ppm. The 13C NMR spectra of complexes 1–4 gave signals in the region of 22.07–31.21 ppm due to the merging of the methylene carbon signals of alkyl amine chain and diene ligands. Furthermore, a signal around 13.87 ppm was observed for the terminal methyl carbon. ESI-MS spectra of complexes 1–4 showed molecular ion peaks at 417.32, 472.89, 283.08 and 339.17, respectively.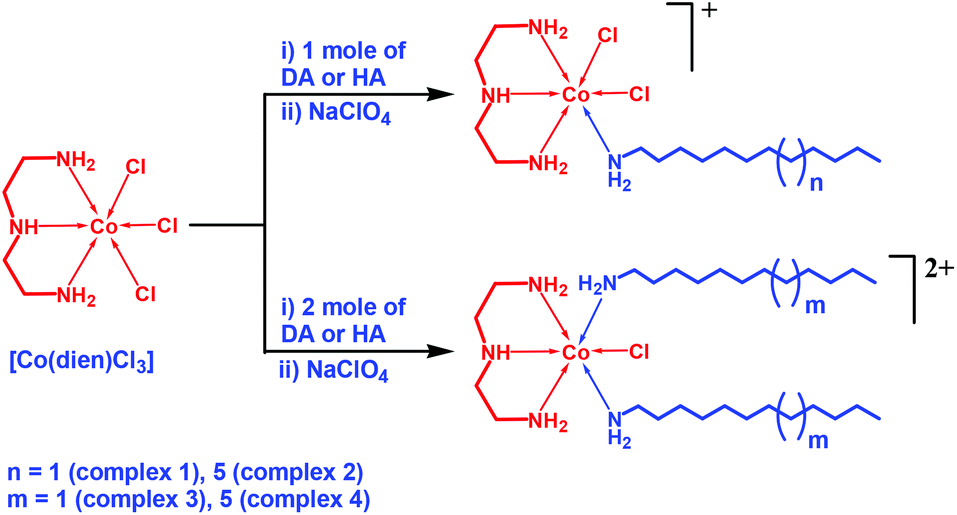 | ||
| Scheme 1 Schematic representation of the synthesis of single and double chain surfactant-cobalt(III) complexes. | ||
Morphology and size distribution of self-assembled surfactant–cobalt(III) complexes
The average hydrodynamic size and surface morphology of the self-assembled surfactant–cobalt(III) complexes were examined by DLS and SEM, respectively.18–20 SEM images and size distribution histogram plots for self-assembled surfactant–cobalt(III) complexes are presented in Fig. 2(a) and (b). The SEM results show that the self-assembled surfactant–cobalt(III) complexes are spherical and rod-like in shape, and the size distribution for the complexes 1–4 is 58.55, 97.79, 108.30 and 120.16 nm, respectively. The rod like morphology21 was preferably formed for the surfactant–cobalt(III) complexes with higher hydrophobicity. As shown in Fig. S3,† self-assembled surfactant–cobalt(III) complexes exhibit monodisperse and narrow size distribution with an average hydrodynamic diameter for the complexes 1–4 of 117.9, 136.3, 151.0 and 188.5 nm, with a polydispersity index PDI = 1.00.21 The obtained size distribution from DLS measurements is larger than the values derived from SEM measurements, which may be due to the experimental conditions.19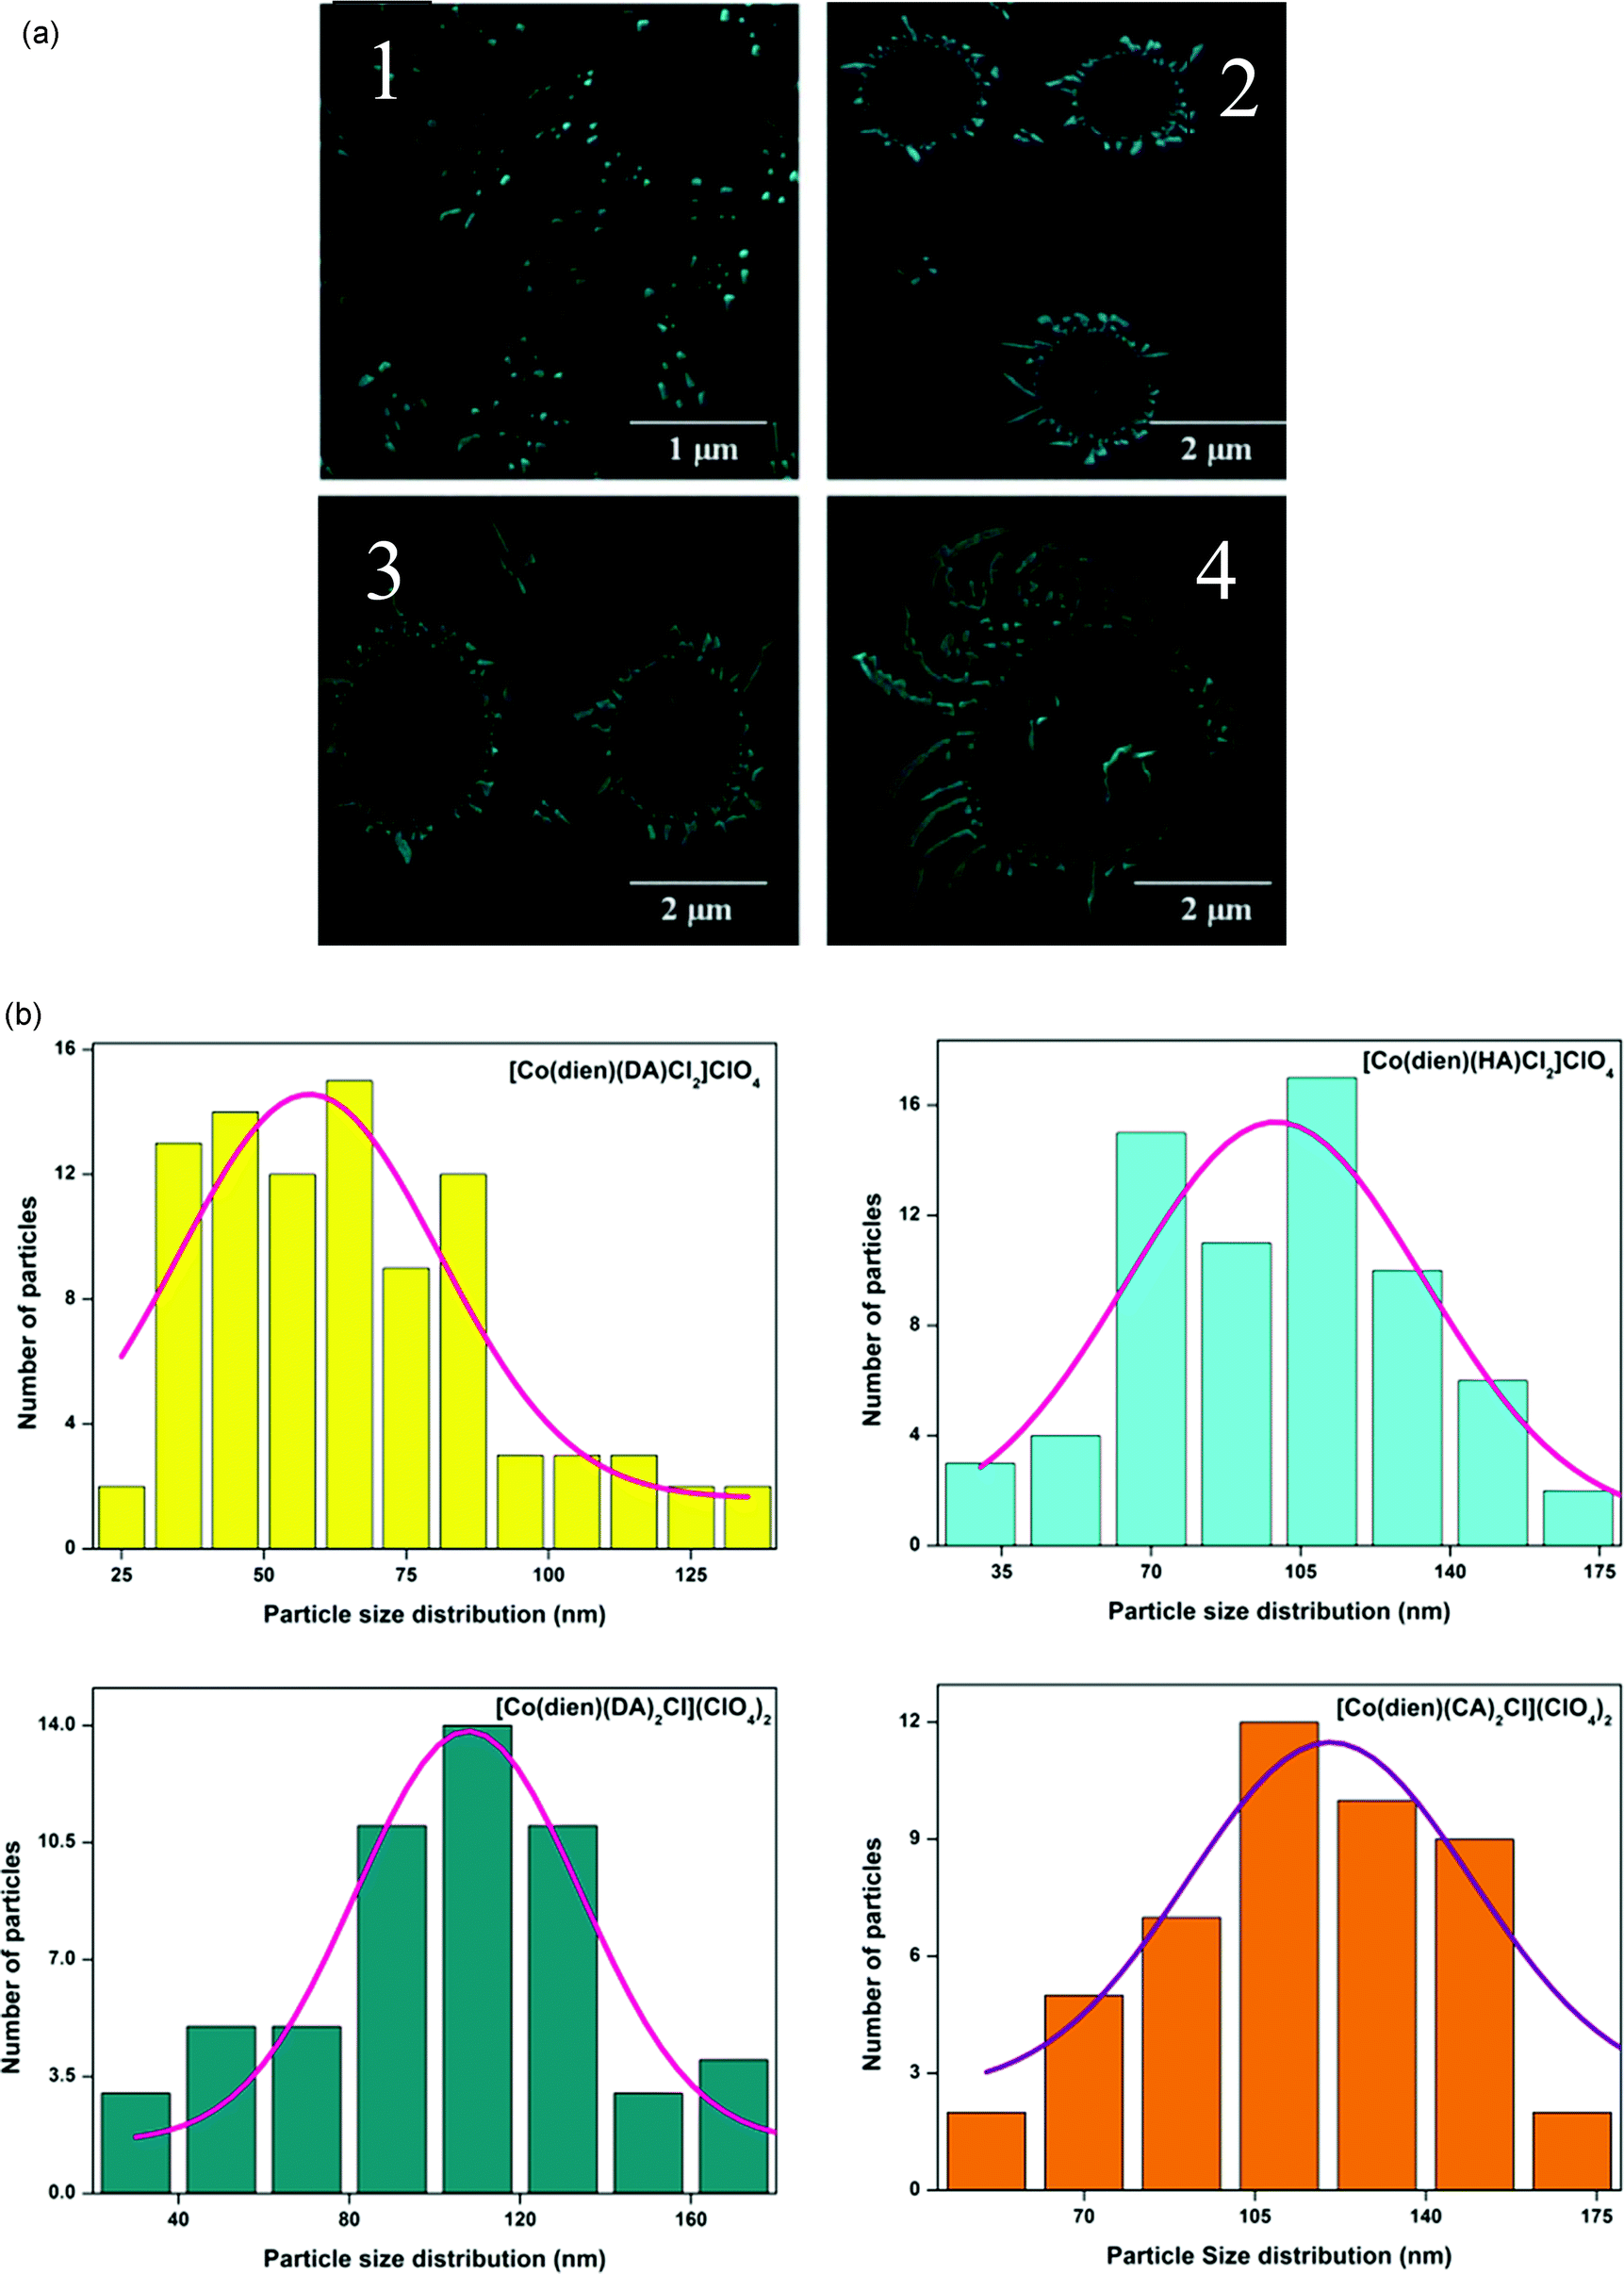 | ||
| Fig. 2 SEM images (a) and Size distribution histogram plots (b) for self-assembled surfactant–cobalt(III) complexes 1–4. | ||
Determination of the partition coefficient
The hydrophobicity of surfactant–metal complexes is an important parameter to analyse the penetration behaviour across the cell membrane, and is investigated in terms of the partition coefficient (log P).22 Here, the surfactant–cobalt(III) complexes are likely to differ in their hydrophobicity due to the variation in the single and double chain systems of different chain lengths. Based on the concentration of surfactant–cobalt(III) complexes distributed in the biphasic system (n-octanol–water), partition coefficients were calculated via the following equation.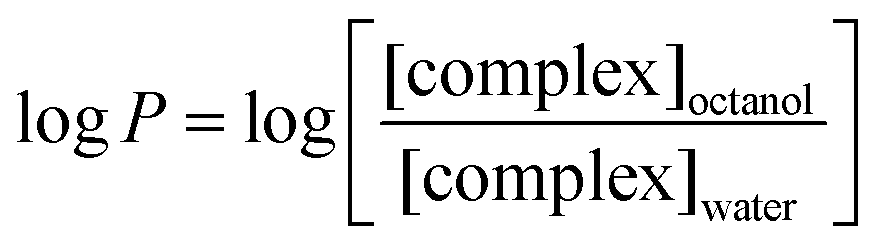 | (1) |
The calculated values of log P for complexes 1–4 are −1.23, −1.03, −0.94 and −0.86 respectively, and are in the order of 1 < 2 < 3 < 4. The hydrophobicity of double chain surfactant–cobalt(III) complexes is higher than for single chain surfactant–cobalt(III) complexes (1, 2 < 3, 4). Within the single or double chain surfactant–cobalt(III) complexes, complexes with longer alkyl chain length have higher hydrophobicity than complexes with shorter alkyl chain length (1 < 2; 3 < 4).
Critical micelle concentration
As their concentration increases, the surfactant–metal complexes tend to aggregate in aqueous medium and at a particular concentration called the critical micelle concentration they start to form micelles; during this phase, their physical properties e.g. specific conductivity also change, due to the change in the mobility of molecules in the system. A typical change in the specific conductivity of surfactant–cobalt(III) complexes in the present study with increasing concentration at five different temperatures (303, 308, 313, 318 and 323 K) was observed and the values are plotted in Fig. 3 and S4.† The obtained plots for all the surfactant–cobalt(III) complexes showed a sharp change from the pre-micellar to post-micellar regions due to the reduction in the mobility of molecules by aggregation. However, the CMC value increased with the increasing temperature, due to disturbances in the aggregation.23 | ||
| Fig. 3 Plots for specific conductivity versus concentration of surfactant–cobalt(III) complexes (3 and 4) in aqueous solution. | ||
The obtained CMC values for the surfactant–cobalt(III) complexes are shown in Table 1, and are very low compared to most simple organic surfactants due to larger head group size which results in a reduction in the concentration of micelles.24 Thus it is suggested that these surfactant–cobalt(III) complexes have more capacity to associate forming micellar aggregates than ordinary synthetic organic surfactants. The order of CMC values for complexes 1 > 2 > 3 > 4 clearly shows that surfactant–cobalt(III) complexes with higher alkylamine chain lengths as well as complexes with more alkylamine ligands have lower CMC values. Double chain surfactant–cobalt(III) complexes have lower CMC values than single chain complexes. This is due to the increase in the hydrophobicity of the tail part, which tends to favour micellization at a lower concentration.
| Complexes | T (K) | CMC × 104 M | ΔG°m (kJ mol−1) | ΔH°m (kJ mol−1) | ΔS°m (J mol−1 K−1) |
|---|---|---|---|---|---|
| 1 | 303 | 4.8045 | −31.201 | −16.704 | +49.248 |
| 308 | 4.9909 | −32.068 | −17.538 | +48.012 | |
| 313 | 5.3667 | −33.612 | −18.861 | +47.128 | |
| 318 | 5.8333 | −34.525 | −19.903 | +45.981 | |
| 323 | 6.2348 | −35.290 | −20.850 | +44.706 | |
| 2 | 303 | 1.3841 | −38.237 | −30.121 | +26.785 |
| 308 | 1.6013 | −38.251 | −31.140 | +23.088 | |
| 313 | 1.8097 | −40.274 | −33.792 | +20.709 | |
| 318 | 1.9918 | −41.009 | −35.352 | +17.789 | |
| 323 | 2.2091 | −42.166 | −37.375 | +14.833 | |
| 3 | 303 | 0.6990 | −44.629 | −6.8109 | +124.81 |
| 308 | 0.7207 | −46.393 | −8.0781 | +124.39 | |
| 313 | 0.7403 | −47.229 | −8.6087 | +123.38 | |
| 318 | 0.7612 | −48.705 | −9.5644 | +123.08 | |
| 323 | 0.7815 | −49.849 | −10.711 | +121.17 | |
| 4 | 303 | 0.1598 | −52.248 | −29.098 | +76.402 |
| 308 | 0.1773 | −52.837 | −30.196 | +73.509 | |
| 313 | 0.2023 | −53.621 | −31.522 | +70.603 | |
| 318 | 0.2253 | −54.159 | −32.634 | +67.689 | |
| 323 | 0.2387 | −54.760 | −33.737 | +65.088 |
Thermodynamics of micellization
Phase separation or the equilibrium model for micelle formation was used to derive the various thermodynamic parameters of micellization by monitoring the change in the CMC with temperature. The sign and magnitude for the formation of micelles by ionic, non-ionic and zwitterionic surfactants have been reported.17 The thermodynamic parameters for the micellization by the single and double chain surfactant metal complexes are compiled in Table 1. Generally it is noted that micelle formation depends on the −ΔG°m, −ΔH°m and +ΔS°m values. The negative Gibbs free energy change denotes that the process of micelle formation is spontaneous and gradually increases with the temperature as well as chain length and number of alkylamine ligands. In all cases, ΔS°m decreases with increasing temperature, which is due to the head group being is more hydrated than the hydrophobic tail. ΔH°m increases with the temperature, indicating that the formation of micelles becomes increasingly exothermic.25,26Interaction of surfactant-cobalt(III) complexes with serum albumins
The biophysical studies on the interaction between protein and surfactant-metal complexes can give valuable information about structural factors governing protein–drug binding behaviour. To develop efficient metallodrugs, it is important to analyse the process behind the protein–drug complex formation: (i) whether the drug interacts with the ground state protein (static process) or with the excited state protein (dynamic process),27 (ii) the strength and stability of protein–drug complexes, (iii) the binding number of protein–drug complex formation, (iv) the nature of the binding forces (electrostatic, hydrophobic, hydrogen bonding and van der Waals interaction) acting upon the protein–drug complex, and (v) conformational and microenvironmental changes in the protein.UV-visible absorption studies
UV-visible absorption techniques can lend support for the above observed static process based on the changes in the absorption peaks of protein. The absorption spectrum of proteins is only influenced by the complexation with quencher in the ground state (static process) rather than in the excited state (dynamic process).28 The absorption spectra of BSA/HSA in the absence and presence of surfactant–cobalt(III) complexes are shown in Fig. 4 and S5.† Generally it is noticed that the addition of surfactant–cobalt(III) complexes to the protein solution results in hypochromism around 210 nm deriving from the α-helix content of the protein and hyperchromism around 280 nm deriving from the aromatic residues of the protein. The observed hypochromism shows the structural influence of the α-helices of the protein, whereas the hyperchromism shows the alteration in the microenvironment around the aromatic acid residues through the extension into the aqueous environment. These changes in the absorbance of the protein by the interaction with surfactant–cobalt(III) complexes are evidence for the existence of static quenching processes. | ||
| Fig. 4 UV-visible absorption spectra of (a) BSA and (b) HSA in the absence and presence of complex 2. [BSA] = [HSA] = 10 μM and [surfactant-cobalt(III) complex] = 90 μM, pH = 7.4. | ||
Analysis of quenching and binding parameters
To investigate the quenching and binding nature of surfactant–cobalt(III) complexes with serum albumins, the emission spectra of BSA and HSA solutions were monitored in the wavelength range 290–450 nm by exciting the proteins at 280 nm, resulting in a strong fluorescence emission peak at 350 nm for BSA and 346 nm for HSA due to their tryptophan residues. The changes in the emission spectra of the protein with increasing surfactant–cobalt(III) complex concentration at three different temperatures (278, 293 and 308 K) were recorded and representative fluorescence emission spectra are shown in Fig. 5. Generally, the fluorescence emission intensity of the protein is quenched regularly by addition of surfactant–cobalt(III) complexes, indicating the efficient formation of a complex between protein and surfactant–metal complexes.29 The obtained results were analysed through equations (S4) and (S5)† and the values for Ksv, kq, Kb and n are summarized in Table 2. | ||
| Fig. 5 Plot of % relative fluorescence intensity of (a) BSA (λem = 350 nm) and (b) HSA (λem = 346 nm) at various concentrations of complexes 1–4 (r = [complex]/[BSA or HSA] = 0–90 μM), pH = 7.4. | ||
| Complexes | T (K) | K sv × 10−4 (M−1) | k q × 10−12 (M−1 S−1) | K b × 10−4 (M−1) | n | ΔH° (kJ mol−1) | ΔG° (kJ mol−1) | ΔS° (J mol−1 K−1) |
|---|---|---|---|---|---|---|---|---|
| BSA-1 | 278 | 0.3910 | 0.3910 | 1.3728 | 1.1456 | −16.742 | −22.020 | +19.037 |
| 293 | 0.4067 | 0.4067 | 0.9517 | 1.0957 | −22.316 | |||
| 308 | 0.4321 | 0.4321 | 0.6135 | 1.0411 | −22.334 | |||
| BSA-2 | 278 | 0.4905 | 0.4905 | 32.569 | 1.4485 | −19.804 | −29.339 | +34.197 |
| 293 | 0.5300 | 0.5300 | 19.907 | 1.4062 | −29.723 | |||
| 308 | 0.5736 | 0.5736 | 11.604 | 1.3304 | −29.862 | |||
| BSA-3 | 278 | 2.4522 | 2.4522 | 113.53 | 1.4387 | +8.665 | −32.225 | +146.997 |
| 293 | 2.7625 | 2.7625 | 134.15 | 1.4479 | −34.370 | |||
| 308 | 2.9201 | 2.9201 | 190.29 | 1.4541 | −37.026 | |||
| BSA-4 | 278 | 3.5229 | 3.5229 | 247.80 | 1.4745 | +45.696 | −34.029 | +286.885 |
| 293 | 4.1973 | 4.1973 | 736.55 | 1.5745 | −38.519 | |||
| 308 | 4.5578 | 4.5578 | 105.22 | 1.6007 | −41.404 | |||
| HSA-1 | 278 | 0.3616 | 0.3616 | 0.2515 | 0.9601 | −11.960 | −18.098 | +22.188 |
| 293 | 0.3783 | 0.3783 | 0.1986 | 0.9216 | −18.499 | |||
| 308 | 0.3893 | 0.3893 | 0.1408 | 0.8832 | −18.565 | |||
| HSA-2 | 278 | 0.5393 | 0.5393 | 12.966 | 1.3147 | −14.556 | −27.210 | +45.688 |
| 293 | 0.6392 | 0.6392 | 7.9305 | 1.2728 | −28.010 | |||
| 308 | 0.6674 | 0.6674 | 4.5930 | 1.2029 | −28.431 | |||
| HSA-3 | 278 | 2.5342 | 2.5342 | 13.231 | 1.1921 | +42.198 | −27.257 | +249.599 |
| 293 | 2.5396 | 2.5396 | 32.077 | 1.2812 | −30.885 | |||
| 308 | 2.7061 | 2.7061 | 100.76 | 1.3971 | −35.397 | |||
| HSA-4 | 278 | 2.7486 | 2.7486 | 100.93 | 1.2912 | +60.996 | −31.953 | +325.024 |
| 293 | 2.8539 | 2.8539 | 159.88 | 1.4059 | −35.834 | |||
| 308 | 3.4532 | 3.4532 | 655.09 | 1.5540 | −41.368 |
As all the Stern–Volmer plots are linear, it is concluded that a single type of quenching mechanism exists, either static or dynamic, which can be distinguished from the temperature dependence of the Ksv and kq values. It is known that higher temperatures are likely to result in decreasing quenching constant values for the static process due to the weakening of the ground state complex stability, whereas an increase of the quenching constant values for the dynamic process is due to the faster diffusion of the excited molecules.30 Thus the manner in which the quenching constant values (Ksv and kq) increase with the temperature (Table 2) indicates a stimulation of the dynamic quenching process upon BSA/HSA binding by the surfactant–cobalt(III) complexes.
However, the obtained quenching rate constant values (kq ≈ 1011–1012 M−1 s−1) are 10–100 times higher than the maximum value possible for diffusion controlled dynamic quenching (i.e., 2.0 × 10¹⁰ M−1 s−1). This observation can be explained based on the existence of a special process in which the surfactant–cobalt(III) complex quenches BSA/HSA via initiation of a static mechanism rather than the dynamic process.31,32
Similarly the binding number per albumin molecule (n) is around 1, indicating a strong and independent binding site in BSA/HSA for the surfactant–cobalt(III) complex. It is also observed that the binding (Kb) between the protein and the surfactant–cobalt(III) complex with respect to temperature decreased for single chain systems, whereas it increased for double chain systems. This may be due to the increasing temperature diminishing the electrostatic attraction between the protein and the single chain surfactant–cobalt(III) complex, thereby decreasing the stability of protein–surfactant cobalt(III) complexes. However, the increase in the temperature tightens the hydrophobic attraction between the protein and the double chain surfactant–cobalt(III) complex, thereby increasing the stability of protein-surfactant metal complexes.27
Thermodynamic parameters and nature of the binding forces
In order to analyse the nature of the binding forces (hydrophobic, electrostatic, hydrogen bonding and van der Waals interactions) between the protein and the surfactant–cobalt(III) complex, the sign and magnitude of the thermodynamic parameters such as ΔG° (free energy change), ΔH° (enthalpy change), and ΔS° (entropy change) for the interaction process were calculated by using equations (S5) and (S6).† Ross and Subramanian33 have studied the various models to explain the existence of principal binding forces in the protein association process using thermodynamic parameters and the results showed that (i) positive values for ΔH° and ΔS° resulted from hydrophobic forces, (ii) negative values for ΔH° and ΔS° resulted from van der Waals interaction and hydrogen bond formation, and (iii) a negative ΔH° and a positive ΔS° resulted from electrostatic interaction. As seen from Table 2, the negative free energy change values for the interaction between surfactant–cobalt(III) complexes and BSA/HSA indicate that the binding process is spontaneous. The positive ΔH° and ΔS° values indicate that hydrophobic interactions play a dominant role in the interactions between double chain surfactant–cobalt(III) complexes and BSA/HSA.34 The negative ΔH° and positive ΔS° values for the interaction between single chain surfactant–cobalt(III) complexes and BSA/HSA indicate that electrostatic interactions play a major role.Synchronous fluorescence studies
Synchronous fluorescence spectroscopy was used to monitor the microenvironmental and conformational changes around the vicinity of tryptophan (Trp) and tyrosine (Tyr) chromophores in the protein, following their quenching and shift in the emission maximum upon addition of the surfactant–cobalt(III) complex. The characteristic emission for the tyrosine and tryptophan residues of the protein can be obtained by maintaining the wavelength interval (Δλ) as 15 and 60 nm, respectively.30 In the investigated concentration range, the changes in the synchronous fluorescence spectra of BSA/HSA upon increasing the concentration of surfactant-cobalt(III) complex at Δλ = 15 and 60 nm are shown in Fig. 6.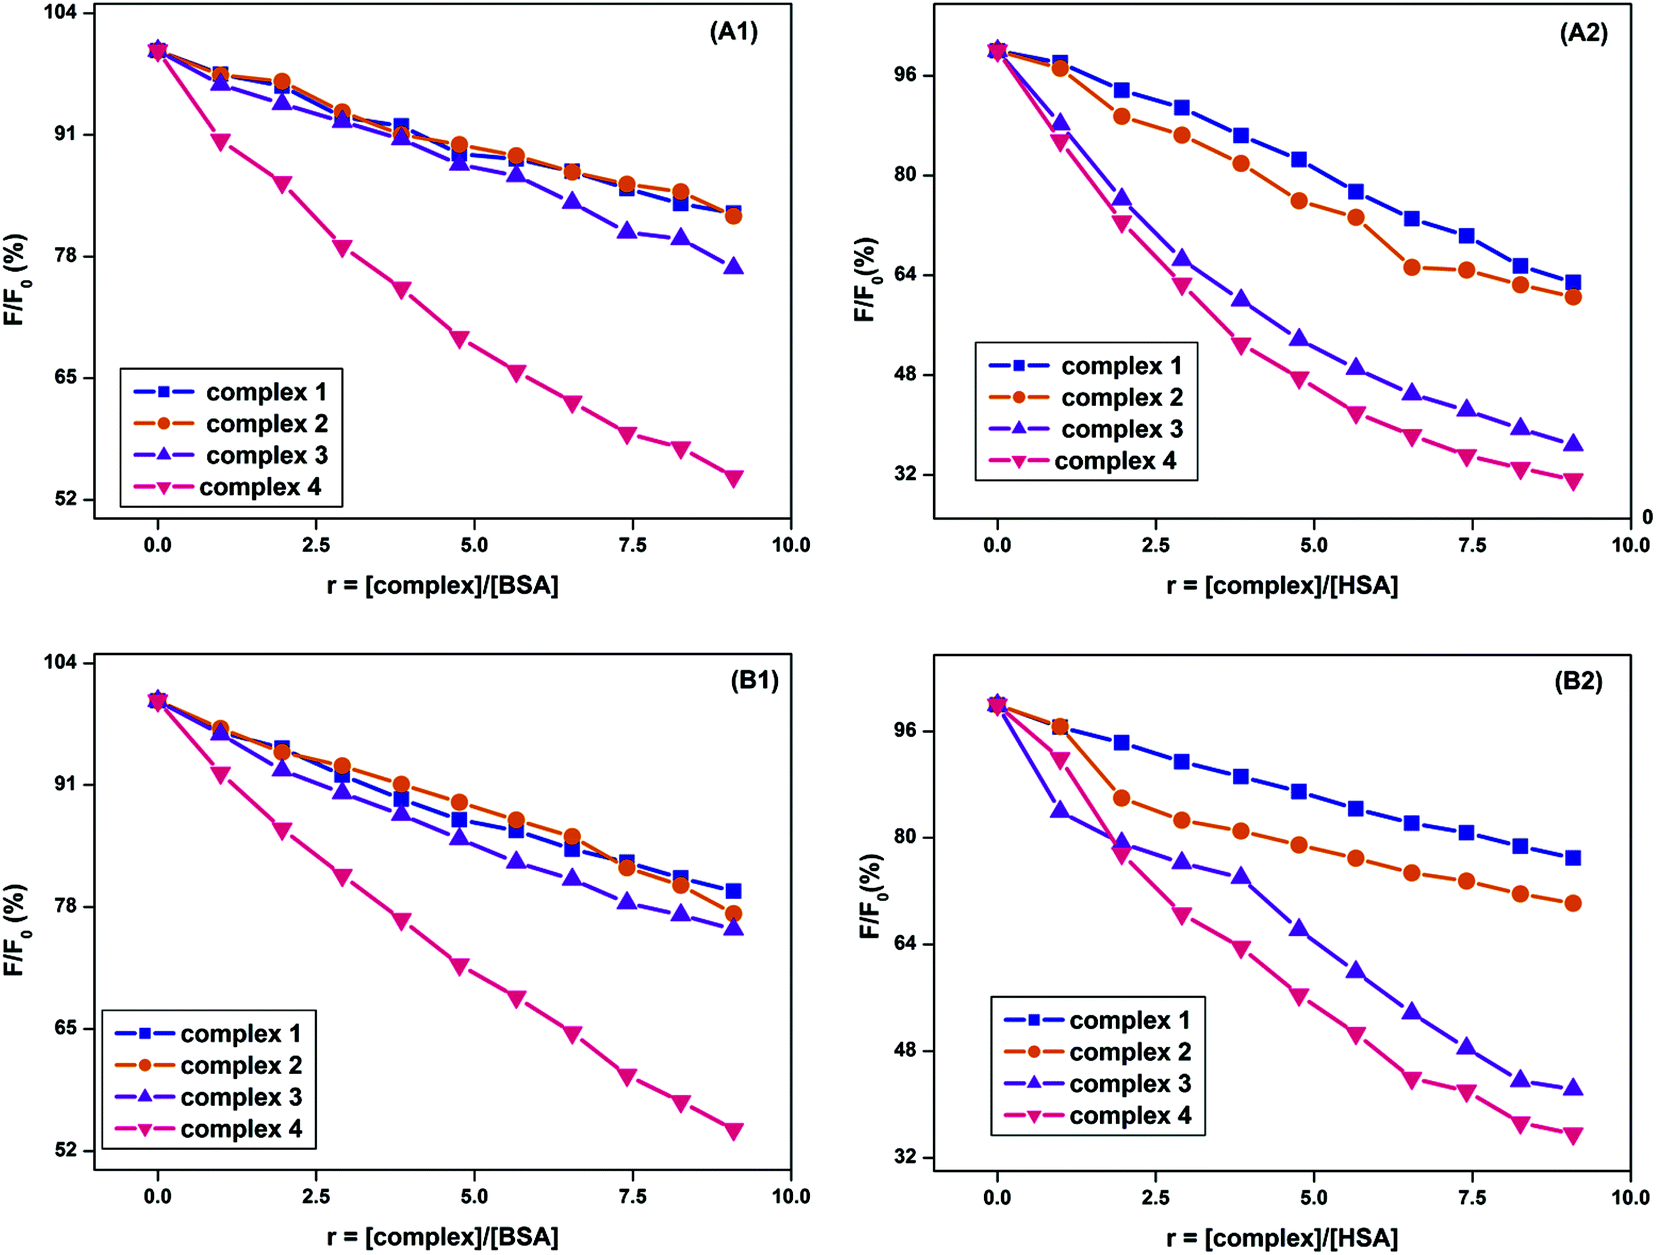 | ||
| Fig. 6 Effect of addition of complexes 1–4 (r = [complex]/[BSA or HSA]) on the relative synchronous fluorescence intensity of BSA (left, A) and HSA (right, B) at Δλ = 15 nm (top, 1), Δλ = 60 nm (bottom, 2); BSA = HSA = 10 μM and [surfactant–cobalt(III) complex] = 90 μM, pH = 7.4. | ||
As seen from Fig. 6 in the case of BSA, the fluorescence intensity of Tyr/Trp residues is relatively more quenched than in the case of HSA which may be due to the more aromatic residues in BSA. It can also be noticed that surfactant–cobalt(III) complexes interact with both Tyr and Trp residues in a similar manner, indicating non-specific binding. In addition to this, there is no significant shift in the emission maximum of Tyr residues upon addition of complexes 1–4. In contrast, an obvious red shift in the emission of Trp residues was noticed for the single chain surfactant–metal complexes, which indicated an enhancement of polarity through reduction of hydrophobicity. A slight blue shift in the emission of tryptophan residues was observed for double chain surfactant–metal complexes, which indicates that the polarity around the tryptophan residues decreased through the increase of hydrophobicity due to conformational changes in BSA/HSA. From this result we can conclude that double chain surfactant–cobalt(III) complexes have a higher hydrophobic character than single chain surfactant–cobalt(III) complexes.
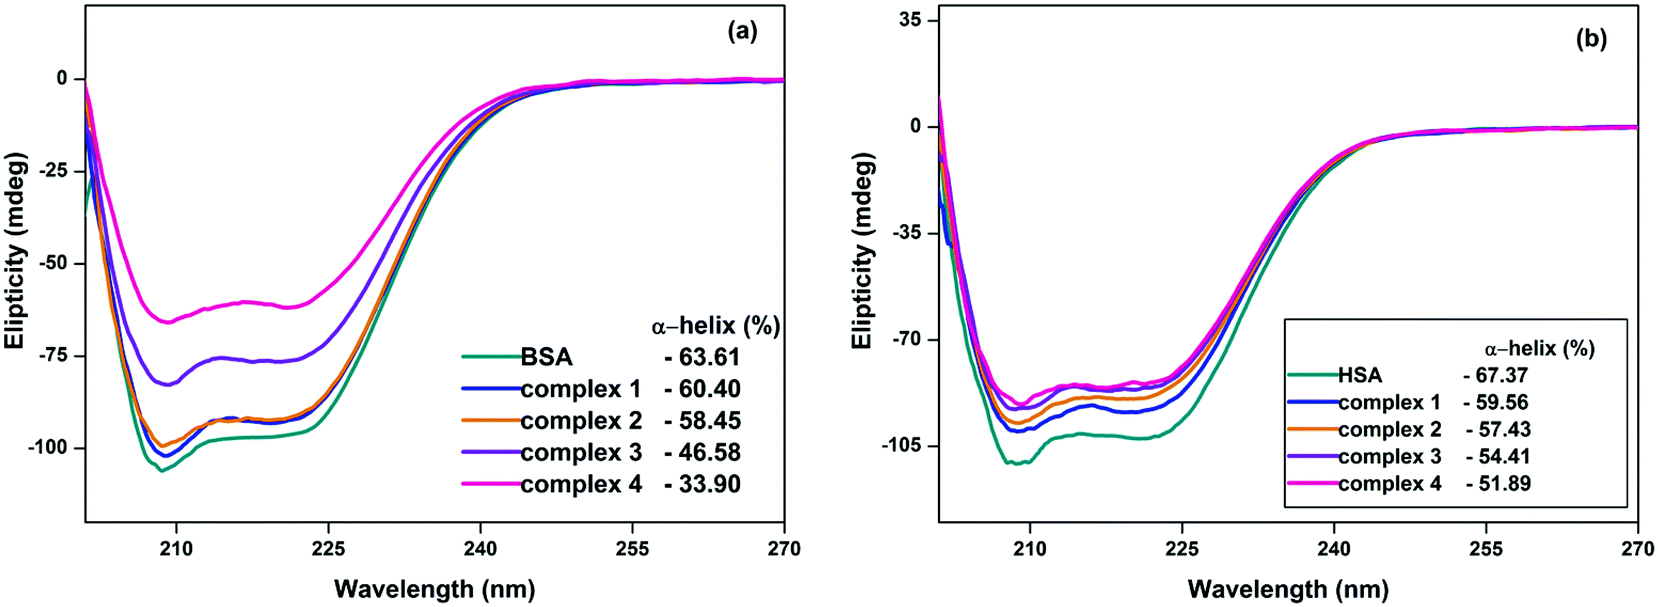
Circular dichroism spectroscopic studies
CD spectroscopy is a sensitive technique to investigate the changes in the secondary structure of protein upon interaction with metallodrugs. The far-UV CD spectra of BSA/HSA exhibit two negative bands at 208 and 222 nm, which are characteristic of the typical α-helical structure of the protein and originate from the n→π* transfer of the peptide bonds of the α-helix.35–37 In order to obtain an insight into the changes in the secondary structure of BSA/HSA upon interaction with surfactant–cobalt(III) complexes, the far-UV CD spectra of BSA/HSA were recorded in the absence and presence of complexes 1–4.As can be seen from Fig. 7, the negative ellipticity values of BSA/HSA decreased by the addition of surfactant–cobalt(III) complexes, indicating an unfolding of the peptide strands, thereby lowering the α-helical content in the protein. The extent to which the α-helical content in BSA/HSA is decreased by the complexes 1–4 is in the order of 1 < 2 < 3 < 4, showing that the binding of surfactant–cobalt(III) complexes with BSA/HSA induces conformational changes in BSA/HSA, which may affect the physiological functions of the protein.
 | ||
| Fig. 7 Circular dichroism spectra of (a) BSA and (b) HSA in the absence and presence of complexes 1–4. [BSA] = [HSA] = 2 μM, [surfactant-cobalt(III) complexes] = 4 μM, pH = 7.4. | ||
Based on the results presented in Fig. 7, it is found that the percentage of change in α-helicity of proteins by the complexes 3 and 4 is lower than for complexes 1 and 2, according to the hydrophobicity factors. This change in α-helicity of proteins shows a direct relationship between the length of the hydrophobic tail of the surfactant–cobalt(III) complexes and protein conformation. In order to explore the effect of additional alkyl chains of surfactant–cobalt(III) complexes on the conformation of BSA/HSA, the α-helix content of single and double chain complexes were compared and it was observed that the α-helix content of proteins was reduced by a larger extent in the presence of double chain complexes than for the respective single chain complexes. This is due to the larger hydrophobicity of the double chain than the single chain surfactant–cobalt(III) complexes.
Antibacterial activity
A disk diffusion assay was adopted to test the antibacterial activity of single and double chain surfactant–cobalt(III) complexes against human pathogens. The complexes exhibited good antibacterial activity against both Gram-positive and Gram-negative bacteria with reference to a standard antibiotic drug (ciprofloxacin). The killing effect of the complexes is in relation with the concentration of the drug in a dose-dependent manner, i.e. a higher concentration of surfactant–cobalt(III) complex has a greater killing effect than a lower concentration in all tested microorganisms. The results of the antibacterial activities of complexes at different concentrations (0, 250, 500 750, 1000 μg mL−1) are summarized in Table 3 and Fig. S6 and S7.† We found that E. coli is highly susceptible to all complexes while K. pneumoniae and P. aeruginosa are least susceptible. A moderate level of susceptibility was noticed in strains such as P. vulgaris, S. aureus, S. flexneri and S. typhi. Out of the four surfactant–cobalt(III) complexes, complex 4 possessed very good antibacterial activity against all the microbes used. In addition to this, the percentage of increase (%) of bacterial inhibition between the standard (ciprofloxacin) and complexes 1–4 was also evaluated (Table S1 and Fig. S8†). The percentage fold increase of complex 4 was found to be 51.35% (E. coli), 52.94% (P. vulgaris), 67.4% (S. typhi), 56.25% (S. flexneri), 52.94% (S. aureus) and 37.5% (V. cholerae) against ciprofloxacin. On the other hand, complex-2 displayed effective inhibition against K. pneumoniae (23.52%) and complexes 2 and 3 against P. aeruginosa (33.33%) as compared to the standard. This may be mainly attributed to the hydrophobicity of the complex which can penetrate the cell wall inducing DNA damage.38 It is also reported that the ionic interaction between the surfactant (cationic charge) and cell membrane (anionic charge) may play a major role in the diffusion of complexes into bacteria.39 Meanwhile, complexes of similar kind have shown significant antibacterial activity against Gram-positive and Gram-negative bacteria. However, the study may require further investigation to elucidate the actual mechanism of the killing effect of bacterial strains.| Bacterial strain used | Zone of inhibition (in mm) | ||||||||||||||||||||
|---|---|---|---|---|---|---|---|---|---|---|---|---|---|---|---|---|---|---|---|---|---|
| Standard (μg mL−1) | Complex 1 (μg mL−1) | Complex 2 (μg mL−1) | Complex 3 (μg mL−1) | Complex 4 (μg mL−1) | |||||||||||||||||
| 1000 | 0 | 250 | 500 | 750 | 1000 | 0 | 250 | 500 | 750 | 1000 | 0 | 250 | 500 | 750 | 1000 | 0 | 250 | 500 | 750 | 1000 | |
| Standard – ciprofloxacin. Solvent – water (showed nil effect against the microorganisms under test). | |||||||||||||||||||||
| E. coli | 28 | 0 | 10.5 | 13 | 14.5 | 17 | 0 | 12 | 14.5 | 16 | 17 | 0 | 12 | 13.5 | 15 | 17 | 0 | 10.5 | 13.5 | 15 | 18.5 |
| K. pneumoniae | 21 | 0 | 10 | 11.5 | 11 | 13 | 0 | 9.5 | 10.5 | 12 | 14 | 0 | 11.5 | 13 | 14 | 17 | 0 | 10.5 | 12 | 14 | 14 |
| P. aeruginosa | 20 | 0 | 8.5 | 10.5 | 11 | 12 | 0 | 12 | 12.5 | 13 | 15 | 0 | 8.5 | 10.5 | 13 | 15 | 0 | 11.5 | 12 | 12.5 | 14 |
| P. vulgaris | 26 | 0 | 8 | 11.5 | 12.5 | 13.5 | 0 | 9.5 | 10.5 | 12 | 14 | 0 | 9.5 | 11 | 12 | 13.5 | 0 | 10.5 | 14.5 | 15.5 | 17 |
| S. typhi | 26 | 0 | 10 | 11 | 12 | 13 | 0 | 8.5 | 11 | 13 | 15 | 0 | 10.5 | 12.5 | 11.5 | 15.5 | 0 | 9.5 | 12.5 | 14 | 15.5 |
| S. flexneri | 25 | 0 | 10 | 11.5 | 11 | 13 | 0 | 9.5 | 10.5 | 12 | 14 | 0 | 11.5 | 12.5 | 14.5 | 15 | 0 | 12 | 13 | 14.5 | 16 |
| S. aureus | 26 | 0 | 8.5 | 11.5 | 12.5 | 13.5 | 0 | 10.5 | 14 | 16 | 17 | 0 | 13.5 | 16 | 16 | 17 | 0 | 12.5 | 14 | 14.5 | 17 |
| V. cholerae | 22 | 0 | 7 | 9 | 10.5 | 11.5 | 0 | 10.5 | 13 | 13 | 15 | 0 | 9 | 9.5 | 11 | 13.5 | 0 | 12 | 13 | 14.5 | 16 |
Experimental section
Materials
BSA (lyophilized powder, essentially fatty acid free and globulin free ≥99%), HSA (lyophilized powder, fatty acid free and globulin free ≥99%), dodecylamine and hexadecylamine were purchased from Sigma–Aldrich and used as supplied. The cobaltous chloride and diethylenetriamine were obtained from Rankem, India. For microbiological studies, the ingredients were purchased from HiMedia Laboratories. All other chemicals were of analytical reagent grade, and double distilled water was used throughout the study.General methods
Elemental analyses (C, H, and N) were carried out at Perkin-Elmer Series II 2400 CHNS/O Elemental Analyzer. Electrospray ionisation mass spectrometry (ESI-MS) analysis was performed in the positive ion mode on a liquid chromatography–ion trap mass spectrometer (LCQ Fleet, Thermo Fisher Instruments Limited, US). Complexes 1–4 were dissolved in water, and the mass scan range was from 100 to 1000 amu. 1H and 13C NMR measurements were performed on BRUKER 400 MHZ NMR spectrometer using d6-DMSO as solvent. Infrared spectra were recorded using a Perkin-Elmer FT-IR spectrophotometer with samples prepared as KBr pellets. Absorption measurements were performed on a Shimadzu UV-1800 UV-Vis spectrophotometer using cuvettes of 1 cm path length. Circular dichroism spectra were recorded on a JASCO-J810 spectropolarimeter with a cylindrical cuvette of 0.1 cm path length. Fluorescence experiments were carried out on a thermostatic bath coupled JASCO FP650 spectrofluorometer using a 1 cm quartz cuvette. Conductivity measurements were made with an Elico Conductivity bridge type CM 82 and dip-type cell with a cell constant of 1.0.The surface morphology and average size distribution of self-assembled surfactant–cobalt(III) complexes were analysed by SEM on VEGA3 TESCAN at an accelerating voltage of 30 kV. A drop of aqueous solution of surfactant–cobalt(III) complex was placed on FTO plate (Agar Scientific Ltd, UK) and it was air dried at room temperature. The average hydrodynamic diameter of the surfactant–cobalt(III) complexes were measured by DLS on ZetaSizer NanoSizer 90 ZS (Malvern Instruments) equipped with He–Ne laser. All the measurements were carried out at a wavelength of 633.8 nm and the data were analysed in an automatic mode. The measured size was presented as the average value of 20 runs, with triplicate measurements within each run. The percentage of cobalt content present in the surfactant–cobalt(III) complexes was determined spectrophotometrically by converting the complexes into [CoCl4]2− whose molar absorbance coefficient is 561 M−1 cm−1 at 691 nm.40
Synthesis of surfactant–cobalt(III) complexes
[Co(dien)Cl3] was synthesised according to the reported procedure.41 To a saturated aqueous solution of [Co(dien)Cl3] (3.2215 g, 0.2825 mmol), an ethanolic solution of the respective mole ratio of ligand, dodecylamine (2.757 mL, 0.1854 mmol for 1; 5.514 mL, 0.3708 mmol for 3) or hexadecylamine (2.953 mL, 0.2415 mmol for 2; 5.906 mL, 0.4831 mmol for 4) was added drop by drop over a period of 30 min. During this addition, the dark violet colour of the solution gradually became lighter and the resulting mixture was kept at room temperature for 48 h. Afterwards, a saturated solution of sodium perchlorate in very dilute perchloric acid was added to the reaction mixture. The obtained precipitate was filtered and washed with cold ethanol followed by acetone, and dried over fused calcium chloride and stored in a vacuum desiccator.Partition coefficients determination
The hydrophobicity values of surfactant–cobalt(III) complexes 1–4 were measured by the “Shake flask” method in octanol–water phase partitions as reported earlier.42 Complexes 1–4 were dissolved in a mixture of water and n-octanol followed by shaking for 1 hour. The mixture was allowed to settle over a period of 30 minutes and the resulting two phases were collected separately without cross contamination of one solvent layer into another. The concentration of surfactant–cobalt(III) complexes in each phase was determined by UV-Vis absorption spectroscopy at room temperature. The results are given as the mean values obtained from three independent experiments.Conductivity measurements
Conductivity measurements were made in a thermo stated water bath maintaining the temperature constant within ±0.1 °C, after calibrating the cell constant with standard KCl solutions of known specific conductivities. Specific conductivity values for the aqueous solution of surfactant–cobalt(III) complexes with a concentration in the range of 10−6–10−2 M−1 were measured at 303, 308, 313, 318 and 323 K. Each reading was noted after thorough mixing and temperature equilibration until no significant change occurred. The CMC values were obtained by plotting specific conductance versus concentration of surfactant–cobalt(III) complex. The change in the CMC with temperature was analysed from phase separation model or equilibrium model for micelle formation.25 The thermodynamic parameters were calculated as given in the ESI.†43,44Interaction studies with serum albumins
Protein binding studies were carried out using Tris-HCl buffer (pH = 7.4), and the concentrations of BSA and HSA were determined spectrophotometrically from the respective molar extinction coefficient of 43![[thin space (1/6-em)]](https://www.rsc.org/images/entities/char_2009.gif) 800 and 36500 M−1 cm−1 at 278 nm. The initial setup was made for fluorescence measurements as: excitation and emission slits were set at 5 nm and 3 nm, respectively, and scanning speed was set at 500 nm min−1. The fluorescence emission spectra were recorded in the wavelength range 290–450 nm by exciting at 280 nm. UV-visible experiments were performed by keeping the concentrations of BSA/HSA (10 μM) and varying concentrations of surfactant-cobalt(III) complexes (0–90 μM), and the absorbance due to complex itself is nullified by adding it in both the sample and reference cells. The fluorescence quenching experiments were carried out in such a way that the concentration of protein and surfactant–cobalt(III) complex was the same as used in the UV-visible studies. The synchronous fluorescence spectra were recorded with Δλ = 15 nm and Δλ = 60 nm for tyrosine and tryptophan residues respectively. In CD spectral measurements, the concentration of BSA/HSA was maintained at 2 μM. The spectra were recorded in the range of 200–270 nm with a scan rate of 200 nm min−1 and a response time of 4 s. Three scans were accumulated for each spectrum. By correcting the inner filter effect45 for the interaction between surfactant-cobalt(III) complexes and BSA/HSA, quenching and binding parameters,46–49 thermodynamics of interaction33,50,51 and percentage of α-helix52–54 were calculated as given in the ESI.†
800 and 36500 M−1 cm−1 at 278 nm. The initial setup was made for fluorescence measurements as: excitation and emission slits were set at 5 nm and 3 nm, respectively, and scanning speed was set at 500 nm min−1. The fluorescence emission spectra were recorded in the wavelength range 290–450 nm by exciting at 280 nm. UV-visible experiments were performed by keeping the concentrations of BSA/HSA (10 μM) and varying concentrations of surfactant-cobalt(III) complexes (0–90 μM), and the absorbance due to complex itself is nullified by adding it in both the sample and reference cells. The fluorescence quenching experiments were carried out in such a way that the concentration of protein and surfactant–cobalt(III) complex was the same as used in the UV-visible studies. The synchronous fluorescence spectra were recorded with Δλ = 15 nm and Δλ = 60 nm for tyrosine and tryptophan residues respectively. In CD spectral measurements, the concentration of BSA/HSA was maintained at 2 μM. The spectra were recorded in the range of 200–270 nm with a scan rate of 200 nm min−1 and a response time of 4 s. Three scans were accumulated for each spectrum. By correcting the inner filter effect45 for the interaction between surfactant-cobalt(III) complexes and BSA/HSA, quenching and binding parameters,46–49 thermodynamics of interaction33,50,51 and percentage of α-helix52–54 were calculated as given in the ESI.†
Antibacterial activity
The antibacterial activity of single and double chain surfactant–cobalt(III) complexes was tested against human pathogenic strains by disk diffusion assay.38 This method is a valuable, inexpensive tool for the demonstration of antibacterial susceptibility of a particular compound by measuring its relative zone of inhibition. Bacterial cultures such as Escherichia coli (MTCC-1687), Salmonella typhi (MTCC-531), Pseudomonas aeruginosa (MTCC-350), Staphylococcus aureus (MTCC-96), Proteus vulgaris (MTCC-425), Klebsiella pneumoniae (MTCC-350), Shigella flexneri (MTCC-1457) and Vibrio cholerae (MTCC-3906) obtained from Microbial Type Culture Collection (MTCC), Indian Institute of Microbial Technology (IMTECH) Chandigarh were allowed to grow overnight in Luria–Bertani (LB) broth at 37 °C. After appropriate sub-culturing, exponential cultures were swabbed onto freshly prepared LB agar plates and sterile disk (6 mm) were placed on to the plate. The disks were loaded with 20 μl of precursor and complex (1–4) at different concentration (such as 0, 250, 500, 750 and 1000 μg mL−1) along with standard reference drug (ciprofloxacin). The plates were incubated at 37 °C for 24 h followed by measuring the relative zone of inhibition using a vernier caliper. The experiments were performed in triplicates.Conclusions
In this work, surfactant–cobalt(III) complexes (1–4) with alkylamine ligands differing in their chain length and number of chain have been synthesized to investigate their tail effect on the hydrophobicity, CMC behaviour, protein interaction and antibacterial activities. On increasing hydrophobicity of surfactant–cobalt(III) complexes (1–4), the self-assembled micellar size became spherical to rod-like, whereas their size distribution gradually increased. A series 1 → 2 → 3 → 4 was observed, in which the CMC values decreased, whereas hydrophobicity, protein quenching and binding parameters increased, indicating that these observations were greatly influenced by the effect of the number of alkylamine ligands compared to the change in the chain length of the alkylamine ligand. Further, it is noted that the thermodynamics of micelle formation is a spontaneous, exothermic and entropy driven process. The temperature dependent interaction of surfactant–cobalt(III) complexes with serum albumins has shown that the probable quenching mechanism is static and this was further confirmed by ground state protein–complex formation in the UV-Vis studies. On increasing the temperature, the protein–complex stability from binding constant values decreased in the case of a single chain system, and increased in the case of a double chain system. This was further confirmed by the thermodynamics of protein interaction, indicating that a single chain system is likely to be involved in electrostatic interactions (−ΔG, −ΔH and +ΔS), whereas a double chain system is likely to be involved in hydrophobic interactions (−ΔG, +ΔH and +ΔS). Similarly, synchronous fluorescence studies have shown that the polarity around Trp residues increased in single chain systems for electrostatic reasons, and decreased in double chain systems due to their hydrophobic nature. Moreover, CD studies showed some appreciable conformational and micro environmental changes in the protein. Furthermore, the complexes 1–4 interacted more strongly with BSA compared to HSA. It is interesting to observe that double chain systems possess remarkable antibacterial activity as compared to single chain systems. This could be possibly due to the hydrophobic nature of the compound that can easily penetrate the cell membrane. Significantly, this work deals with the tail tune effect which is important for designing surfactant-based metallodrugs with a desired binding mode with drug carrier serum albumins. This kind of tuning the hydrophobicity of surfactant–metal complexes with suitable tail ligands could be the best pathway to effective biological drugs in the near future.Acknowledgements
The authors are grateful to the UGC-SAP & COSIST and DST-FIST programmes of the Department of Chemistry, Bharathidasan University. S.V. acknowledges the UGC-RFSMS for financial support (Junior Research Fellowship). SA thanks the sanction of research schemes from funding agencies, CSIR [grant no. 01(2461)/11/EMR-II] and UGC [grant no. 41-223/2012(SR)]. The authors thank Dr K. Jeganathan, Co-ordinator, and T.S. Sheena, Research Scholar, Center for NanoScience and Nanotechnology, Bharathidasan University for the DLS measurements. The authors thank Dr P. Suresh and Prof. K. Pitchumani, School of chemistry, Madurai Kamaraj University for providing the ESI-MS measurements.References
- X. Zhao, F. Sheng, J. Zheng and R. Liu, J. Agric. Food Chem., 2011, 59, 7902–7909 CrossRef CAS PubMed.
- R. Hovland, C. Gløgård, A. J. Aasen and J. Klaveness, Org. Biomol. Chem., 2003, 1, 644–647 CAS.
- R. W. Storrs, F. D. Tropper, H. Y. Li, C. K. Song, J. K. Kuniyoshi, D. A. Sipkins, K. C. Li and M. D. Bednarski, J. Am. Chem. Soc., 1995, 117, 7301–7306 CrossRef CAS.
- H. Jervis, D. Bruce, M. Raimondi and J. Seddon, Chem. Commun., 1999, 2031–2032 RSC.
- E. Kimura, H. Hashimoto and T. Koike, J. Am. Chem. Soc., 1996, 118, 10963–10970 CrossRef CAS.
- G. W. Walker, R. J. Geue, A. M. Sargeson and C. A. Behm, Dalton Trans., 2003, 2992–3001 RSC.
- J. G. Weijnen, A. Koudijs and J. F. Engbersen, J. Org. Chem., 1992, 57, 7258–7265 CrossRef CAS.
- G. Ghirlanda, P. Scrimin, A. E. Kaifer and L. A. Echegoyen, Langmuir, 1996, 12, 3695–3701 CrossRef CAS.
- P. N. Řezáčová, J. Pokorná, J. I. Brynda, M. Kožíšek, P. Cígler, M. Lepšík, J. Fanfrlik, J. Rezac, K. R. Grantz Šašková and I. Sieglová, J. Med. Chem., 2009, 52, 7132–7141 CrossRef PubMed.
- M. D. Hall, T. W. Failes, N. Yamamoto and T. W. Hambley, Dalton Trans., 2007, 3983–3990 RSC.
- M. Kožíšek, P. Cígler, M. Lepšík, J. I. Fanfrlík, P. N. Řezáčová, J. I. Brynda, J. Pokorná, J. R. Plešek, B. R. Grüner and K. R. Grantz Šašková, J. Med. Chem., 2008, 51, 4839–4843 CrossRef PubMed.
- C. Zhang, S. Liu, Q. Zhu and Y. Zhou, J. Med. Chem., 2005, 48, 2325–2335 CrossRef CAS PubMed.
- T. Singh, P. Bharmoria, M.-A. Morikawa, N. Kimizuka and A. Kumar, J. Phys. Chem. B, 2012, 116, 11924–11935 CrossRef CAS PubMed.
- F. Dimiza, A. N. Papadopoulos, V. Tangoulis, V. Psycharis, C. P. Raptopoulou, D. P. Kessissoglou and G. Psomas, Dalton Trans., 2010, 39, 4517–4528 RSC.
- K. Y. Zhang, S. P.-Y. Li, N. Zhu, I. W.-S. Or, M. S.-H. Cheung, Y.-W. Lam and K. K.-W. Lo, Inorg. Chem., 2010, 49, 2530–2540 CrossRef CAS PubMed.
- S. Nehru, S. Arunachalam, R. Arun and K. Premkumar, J. Biomol. Struct. Dyn., 2013, 1–13, DOI:10.1080/07391102.2013.836460.
- R. S. Kumar, S. Arunachalam, V. Periasamy, C. Preethy, A. Riyasdeen and M. Akbarsha, J. Inorg. Biochem., 2009, 103, 117–127 CrossRef CAS PubMed.
- X. Wu, Y. Tian, M. Yu, J. Han and S. Han, Biomater. Sci., 2014 10.1039/c4bm00007b.
- J. Yan, Z. Ye, H. Luo, M. Chen, Y. Zhou, W. Tan, Y. Xiao, Y. Zhang and M. Lang, Polym. Chem., 2011, 2, 1331–1340 RSC.
- T. Chang, M. S. Lord, B. Bergmann, A. Macmillan and M. H. Stenzel, J. Mater. Chem. B, 2014, 2, 2883–2891 RSC.
- X. Zhong, J. Guo, L. Feng, X. Xu and D. Zhu, Colloids Surf., A, 2014, 441, 572–580 CrossRef CAS PubMed.
- S. Jagadeesan, V. Balasubramanian, P. Baumann, M. Neuburger, D. Häussinger and C. G. Palivan, Inorg. Chem., 2013, 52, 12535–12544 CrossRef CAS PubMed.
- N. Kumaraguru and K. Santhakumar, Phys. Chem. Liq., 2010, 48, 747–763 CrossRef CAS.
- K. Santhakumar, N. Kumaraguru, M. Arumugham and S. Arunachalam, Polyhedron, 2006, 25, 1507–1513 CrossRef CAS PubMed.
- P. Mukerjee, J. Phys. Chem., 1962, 66, 1375–1376 CrossRef CAS.
- O. Owoyomi, J. Ige and O. Soriyan, Chem. Sci. J., 2011, 2011 Search PubMed.
- Y. Ni, R. Zhu and S. Kokot, Analyst, 2011, 136, 4794–4801 RSC.
- X.-X. Cheng, Y. Lui, B. Zhou, X.-H. Xiao and Y. Liu, Spectrochimica Acta, Part A, 2009, 72, 922–928 CrossRef PubMed.
- C.-Q. Xiao, F.-L. Jiang, B. Zhou, R. Li and Y. Liu, Photochem. Photobiol. Sci., 2011, 10, 1110–1117 CAS.
- F. Samari, B. Hemmateenejad, M. Shamsipur, M. Rashidi and H. Samouei, Inorg. Chem., 2012, 51, 3454–3464 CrossRef CAS PubMed.
- C.-Y. Yang, Y. Liu, D. Zheng, J.-C. Zhu and J. Dai, J. Photochem. Photobiol., A, 2007, 188, 51–55 CrossRef CAS PubMed.
- D. Shcharbin, E. Pedziwiatr, L. Chonco, J. F. Bermejo-Martín, P. Ortega, F. J. de la Mata, R. Eritja, R. Gómez, B. Klajnert and M. Bryszewska, Biomacromolecules, 2007, 8, 2059–2062 CrossRef CAS PubMed.
- P. D. Ross and S. Subramanian, Biochemistry, 1981, 20, 3096–3102 CrossRef CAS.
- M. Yu, Z. Ding, F. Jiang, X. Ding, J. Sun, S. Chen and G. Lv, Spectrochimica Acta, Part A, 2011, 83, 453–460 CrossRef CAS PubMed.
- B. K. Paul, A. Samanta and N. Guchhait, J. Phys. Chem. B, 2010, 114, 6183–6196 CrossRef CAS PubMed.
- Q. Yang, J. Liang and H. Han, J. Phys. Chem. B, 2009, 113, 10454–10458 CrossRef CAS PubMed.
- Z. Chi, R. Liu, Y. Teng, X. Fang and C. Gao, J. Agric. Food Chem., 2010, 58, 10262–10269 CrossRef CAS PubMed.
- R. S. Kumar and S. Arunachalam, Biophys. Chem., 2008, 136, 136–144 CrossRef CAS PubMed.
- A. Colomer, A. Pinazo, M. Manresa, M. Vinardell, M. Mitjans, M. Infante and L. Pérez, J. Med. Chem., 2011, 54, 989–1002 CrossRef CAS PubMed.
- R. Kitson, Anal. Chem., 1950, 22, 664–667 CrossRef CAS.
- S. H. Caldwell and D. House, J. Inorg. Nucl. Chem., 1969, 31, 811–823 CrossRef CAS.
- R. K. Gupta, R. Pandey, G. Sharma, R. Prasad, B. Koch, S. Srikrishna, P.-Z. Li, Q. Xu and D. S. Pandey, Inorg. Chem., 2013, 52, 3687–3698 CrossRef CAS PubMed.
- A. Gonzalez-Perez, J. Del Castillo, J. Czapkiewicz and J. Rodríguez, Colloid Polym. Sci., 2002, 280, 503–508 CAS.
- R. Zana, J. Colloid Interface Sci., 1980, 78, 330–337 CrossRef CAS.
- M. Van De Weert, J. Fluoresc., 2010, 20, 625–629 CrossRef CAS PubMed.
- J. R. Lakowicz, Principles of fluorescence spectroscopy, Springer, 2009 Search PubMed.
- Y.-Z. Zhang, B. Zhou, Y.-X. Liu, C.-X. Zhou, X.-L. Ding and Y. Liu, J. Fluoresc., 2008, 18, 109–118 CrossRef CAS PubMed.
- S. Soares, N. Mateus and V. De Freitas, J. Agric. Food Chem., 2007, 55, 6726–6735 CrossRef CAS PubMed.
- A. Tarushi, J. Kljun, I. Turel, A. A. Pantazaki, G. Psomas and D. P. Kessissoglou, New J. Chem., 2013, 37, 342–355 RSC.
- A. Divsalar, M. J. Bagheri, A. A. Saboury, H. Mansoori-Torshizi and M. Amani, J. Phys. Chem. B, 2009, 113, 14035–14042 CrossRef CAS PubMed.
- A. Tanwir, R. Jahan, M. A. Quadir, M. A. Kaisar and M. K. Hossain, Dhaka Univ. J. Pharm. Sci., 2012, 11, 45–49 Search PubMed.
- J. Zhang, X.-J. Wang, Y.-J. Yan and W.-S. Xiang, J. Agric. Food Chem., 2011, 59, 7506–7513 CrossRef CAS PubMed.
- P. Bolel, N. Mahapatra and M. Halder, J. Agric. Food Chem., 2012, 60, 3727–3734 CrossRef CAS PubMed.
- J. Mandeville and H. Tajmir-Riahi, Biomacromolecules, 2010, 11, 465–472 CrossRef CAS PubMed.
Footnote |
| † Electronic supplementary information (ESI) available. See DOI: 10.1039/c4qi00018h |
| This journal is © the Partner Organisations 2014 |