 Open Access Article
Creative Commons Attribution 3.0 Unported Licence
Studying the polymerization initiation efficiency of acetophenone-type initiators via PLP-ESI-MS and femtosecond spectroscopy†
Elena
Frick‡
ab,
Hanna A.
Ernst‡
c,
Dominik
Voll
ab,
Thomas J. A.
Wolf
cd,
Andreas-Neil
Unterreiner
*c and
Christopher
Barner-Kowollik
*ab
aPreparative Macromolecular Chemistry, Institut für Technische Chemie und Polymerchemie, Karlsruhe Institute of Technology (KIT), Engesserstr. 18, 76131 Karlsruhe, Germany. E-mail: christopher.barner-kowollik@kit.edu
bInstitut für Biologische Grenzflächen, Karlsruhe Institute of Technology (KIT), Hermann-von-Helmholtz-Platz 1, 76344 Eggenstein-Leopoldshafen, Germany
cInstitut für Physikalische Chemie, Abteilung für Molekulare Physikalische Chemie, Karlsruhe Institute of Technology (KIT), Fritz-Haber-Weg 2, 76131 Karlsruhe, Germany. E-mail: andreas.unterreiner@kit.edu
dStanford PULSE Institute, SLAC National Accelerator Laboratory, Menlo Park, CA 94025, USA
First published on 29th April 2014
Abstract
The initiation efficiency and the excited state dynamics of the three triplet radical photoinitiators MMMP (2-methyl-4′-(methylthio)-2-morpholinopropiophenone), benzoin (2-hydroxy-1,2-diphenylethanone, Bz), and 4-methyl benzoin (2-hydroxy-2-phenyl-1-(p-tolyl) ethanone, 4MB) are investigated via a trifold combination of pulsed laser polymerization and subsequent electrospray ionization mass spectrometry (PLP-ESI-MS), femtosecond transient absorption (TA) spectroscopy, and density functional theory (DFT) methods. A quantitative elucidation of the underlying mechanisms that cause unequal initiation efficiencies of the three photoinitiators is proposed suggesting higher radical formation capabilities for MMMP and 4MB compared to Bz based on the inherent photophysical properties of the three initiators. MMMP shows significantly higher complexity of the relaxation pathways due to partial excitation into higher singlet states as well as extended triplet lifetimes. However, Bz shows the highest initiation efficiency for polymerization of MMA at a wavelength of 351 nm compared to both MMMP (Bz![[thin space (1/6-em)]](https://www.rsc.org/images/entities/char_2009.gif) :
:![[thin space (1/6-em)]](https://www.rsc.org/images/entities/char_2009.gif) MMMP corresponds to 1
MMMP corresponds to 1![[thin space (1/6-em)]](https://www.rsc.org/images/entities/char_2009.gif) :
:![[thin space (1/6-em)]](https://www.rsc.org/images/entities/char_2009.gif) 0.63) and 4MB (Bz
0.63) and 4MB (Bz![[thin space (1/6-em)]](https://www.rsc.org/images/entities/char_2009.gif) :
:![[thin space (1/6-em)]](https://www.rsc.org/images/entities/char_2009.gif) 4MB corresponds to 1
4MB corresponds to 1![[thin space (1/6-em)]](https://www.rsc.org/images/entities/char_2009.gif) :
:![[thin space (1/6-em)]](https://www.rsc.org/images/entities/char_2009.gif) 0.86). The current study thus evidences that the combination of PLP-ESI-MS and TA experiments allows for arriving at quantitative initiation abilities of identical radical fragments originating from disparate source molecules. However, the quantitative initiation evaluation of different fragments originating from disparate source molecules requires additional information regarding the fragments' reactivity towards vinyl bonds.
0.86). The current study thus evidences that the combination of PLP-ESI-MS and TA experiments allows for arriving at quantitative initiation abilities of identical radical fragments originating from disparate source molecules. However, the quantitative initiation evaluation of different fragments originating from disparate source molecules requires additional information regarding the fragments' reactivity towards vinyl bonds.
Introduction
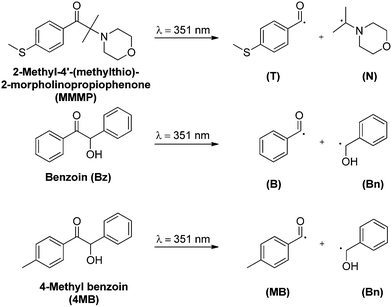
The initiation process of photo-induced polymerization reactions is of significant importance not only for the chemical nature of the final polymer, but also for the rate at which polymerization is initiated. Although light usually plays a role solely in the very first step of a photopolymerization process, a closer look into the fate of an initiator molecule upon irradiation with light gives valuable information on how and with which propensity an initiating fragment is incorporated into a polymer chain, i.e., how it is actually able to initiate. Two main kinds of radical photoinitiators are known, the type I (radical formation after α-cleavage) and type II photoinitiators (radical formation after H-abstraction),1,2 categorized by their radical formation pathway. Type I initiators such as acetophenones, benzyl ketals, or benzoin and its derivatives are excited into a triplet state upon irradiation with UV light and subsequently undergo α-cleavage, forming two radical fragments which are – both or only one of them – capable of initiating a polymerization reaction.The initiator 2-methyl-4′-(methylthio)-2-morpholinopropiophenone (MMMP) is widely used in industrial applications and has been referred to as a ‘near-ideal’ photoinitiator, forming two radical fragments with equal initiation abilities.3 However, a quantitative evaluation of this statement, e.g., via pulsed laser polymerization and subsequent electrospray ionization mass spectrometry (PLP-ESI-MS) has not yet been carried out. Therefore, in the current study we compare the initiation efficiency of the radical fragments of the type I photoinitiators MMMP, benzoin (Bz), and 4-methyl benzoin (4MB) (Scheme 1) derived from a post-mortem analysis of their polymerization products via PLP-ESI-MS. In order to achieve an exact comparison of the initiation efficiencies of the aforementioned initiators, the already established PLP-ESI-MS technique4–6 was chosen, providing quantitative insight into the incorporation propensity of radical fragments at the polymer termini during free radical polymerization. For this purpose – in a first step – polymerization reactions are carried out via pulsed laser polymerization (PLP) with a high-frequency pulsed laser system at 351 nm wavelength, employing mixtures containing the monomer methyl methacrylate (MMA) and two or three photoinitiators simultaneously present at different molar ratios. A subsequent post-mortem analysis of the generated polymers via electrospray ionization mass spectrometry (ESI-MS) is employed to determine the incorporation rates of the radical initiator fragments into the polymer. As already demonstrated in previous studies, the above described ‘cocktail experiment’ technique enables the quantitative comparison of the initiation efficiencies of several photoinitiator fragments.5,6
So far, a quantitative comparison of MMMP and benzoin, as well as MMMP and 4MB, could not be carried out via PLP-ESI-MS, due to the peak overlap between the benzoyl radical fragment (B) initiated chains (ionized with Na+ ions) and N-isopropyl morpholino radical fragment (N) initiated chains ionized with H+ (along with Na+ ionization) during the ESI process. Here, we report for the first time the quantitative comparison of the aforementioned initiators, based on a new protocol that is employed for the suppression of H+ ionization of the morpholino moiety (fragment N, Scheme 1) during ESI-MS.
In the present work PLP-ESI-MS experiments are combined with the investigation of excited state properties as well as of the underlying relaxation mechanism upon photoexcitation via both femtosecond transient absorption (TA) spectroscopy and density functional theory (DFT) methods. As pointed out in our previous study by Wolf and Voll et al.7 such a combination serves as a powerful tool for the detailed study of photoinitiation processes as well as for identifying decisive factors leading to good incorporation properties of radical initiator fragments. As noted in the study,7 the initiation efficiency not necessarily depends on the absorption probability at the employed pump wavelength, but rather on the ability of radical formation and thus on the efficiency of the intersystem crossing (ISC) process upon photoexcitation. Furthermore, it was shown that the incorporation propensity of an initiator fragment is origin dependent. In other words, two identical radical fragments do not automatically exhibit the same initiation efficiencies if their originating molecules, whose cleavage generated the fragments, are not identical. For instance, by comparing 2,4,6-trimethyl benzoin with mesitil, a distinct difference of the initiation ability of the 2,4,6-trimethyl benzoyl fragment can be detected, depending on its original photoinitiator molecule. A further study carried out by Voll et al.5 demonstrates that in addition to its ISC behavior, the incorporation efficiency of a particular radical fragment is also influenced by steric effects. By increasing the number of methyl substituents on the benzoyl fragment a decrease of the initiation ability was found. In the present study, we compare for the first time the four different radical fragments T, N, B, and MB (shown in Scheme 1) in order to obtain in-depth insight into the crucial factors determining initiation efficiencies by combining PLP-ESI-MS, femtosecond TA spectroscopy, and DFT calculations.
Experimental section
Materials
Methyl methacrylate (MMA, Sigma-Aldrich, 99%) and ethyl methacrylate (EMA, Acros Organics, 99%) were freed from inhibitor by passing through a column of activated basic alumina (Merck). Benzoin (Bz, Sigma-Aldrich, 98%) and 2-methyl-4′-(methylthio)-2-morpholinopropiophenone (MMMP, Sigma-Aldrich, 98%) were recrystallized twice in ethanol prior to use. 4-Methyl benzoin (4MB) was synthesized according to the literature.5 For the ESI-MS measurements sodium trifluoroacetate (Sigma-Aldrich, 99%), toluene (Carl Roth, Rotisolv HPLC grade), and methanol (VWR, Chromanorm) were employed as received. Methylisobutyrate (MIB, Sigma Aldrich, 99%) was used as purchased.PLP experiments
All PLP samples (volume ∼ 0.5 mL) contained MMA and a mixture of photoinitiators (PI) with a concentration of cPI = 5 × 10⁻³ mol L−1. The samples were carefully freed from oxygen prior to laser irradiation by purging the reaction mixture with high-purity nitrogen for 5 min. Each sample vial was subsequently placed into a sample holder, which was held at a constant temperature of −5 °C using a thermostat (model: 1196D, VWR, Darmstadt, Germany). The temperature was independently measured at the sample holder. The sample temperature was allowed to equilibrate for 5 min before starting the polymerization. Photoinitiation was achieved by an excimer laser system (Coherent Xantos XS-500, XeF, frequency variable from 1 to 500 Hz, operating at a wavelength of 351 nm (pulse width ∼ 20 ns) and a laser energy of 0.35 mJ) at 100 Hz for an overall polymerization time of 90![[thin space (1/6-em)]](https://www.rsc.org/images/entities/char_2009.gif) 000 laser pulses (∼ 15 min). A custom-built metal filter (fine-mesh metal grid) was implemented next to the radiation exit window to obtain a reduced laser energy of ∼ 0.35 mJ per pulse. The laser beam, which was adjusted to an energy of close to 0.35 mJ per pulse hitting the sample, was redirected to illuminate the vial from the bottom (refer to the literature for the detailed laser set-up).8
000 laser pulses (∼ 15 min). A custom-built metal filter (fine-mesh metal grid) was implemented next to the radiation exit window to obtain a reduced laser energy of ∼ 0.35 mJ per pulse. The laser beam, which was adjusted to an energy of close to 0.35 mJ per pulse hitting the sample, was redirected to illuminate the vial from the bottom (refer to the literature for the detailed laser set-up).8
ESI-MS measurements
Direct infusion ESI-MS measurements were performed in a toluene–methanol (3![[thin space (1/6-em)]](https://www.rsc.org/images/entities/char_2009.gif) :
:![[thin space (1/6-em)]](https://www.rsc.org/images/entities/char_2009.gif) 2 v/v) mixture with 300 μM sodium trifluoroacetate (NaTFA) to avoid H+ ionization of the polymer chains containing the morpholino end group (N). A polymer concentration of 0.4 mg mL−1 was applied for the measurements. ESI-MS spectra were recorded using an LXQ mass spectrometer (ThermoFisher Scientific, San Jose, CA, USA) equipped with an atmospheric pressure ionization source operating in the nebulizer assisted electrospray mode. The instrument was calibrated in the m/z range 195–1822 using a standard containing caffeine, Met-Arg-Phe-Ala acetate (MRFA) and a mixture of fluorinated phosphazenes (Ultramark 1621) (all from Aldrich). A constant spray voltage of 4.5 kV was used and nitrogen at a dimensionless sweep gas flow-rate of 2 (approx. 3 L min−1) and a dimensionless sheath gas flow-rate of 12 (approx. 1 L min−1) were applied. The capillary voltage, the tube lens offset voltage, and the capillary temperature were set to 6 kV, 110 V, and 300 °C, respectively.
2 v/v) mixture with 300 μM sodium trifluoroacetate (NaTFA) to avoid H+ ionization of the polymer chains containing the morpholino end group (N). A polymer concentration of 0.4 mg mL−1 was applied for the measurements. ESI-MS spectra were recorded using an LXQ mass spectrometer (ThermoFisher Scientific, San Jose, CA, USA) equipped with an atmospheric pressure ionization source operating in the nebulizer assisted electrospray mode. The instrument was calibrated in the m/z range 195–1822 using a standard containing caffeine, Met-Arg-Phe-Ala acetate (MRFA) and a mixture of fluorinated phosphazenes (Ultramark 1621) (all from Aldrich). A constant spray voltage of 4.5 kV was used and nitrogen at a dimensionless sweep gas flow-rate of 2 (approx. 3 L min−1) and a dimensionless sheath gas flow-rate of 12 (approx. 1 L min−1) were applied. The capillary voltage, the tube lens offset voltage, and the capillary temperature were set to 6 kV, 110 V, and 300 °C, respectively.
Steady state spectroscopy
Steady state spectra of the three photoinitiators Bz, 4MB, and MMMP were recorded with a UV-VIS spectrometer Cary 500 (Varian) in the wavelength range of 200–800 nm in methylisobutyrate (MIB) as the solvent. The spectra were measured at ambient temperature in fused silica cuvettes with an optical path length of 1 mm.Time-resolved spectroscopy
The photophysical and photochemical properties of the three photoinitiators were studied by means of femtosecond transient absorption spectroscopy. A scheme of the employed setup is shown in Fig. 1, similar to a state-of-the-art femtosecond transient spectrometer described by Riedle et al.9 Laser pulses with 1.6 mJ per pulse at a central wavelength of 775 nm, a typical pulse duration of 150 fs and a repetition rate of 1 kHz were generated using a CPA 2210 laser system (Clark-MXR).7,10 A portion of the fundamental beam (250 μJ per pulse) was split into two parts by a beam splitter (BS) on the one hand to operate a NOPA (non-collinearly optical parametric amplifier) system in the visible region and on the other hand to generate a white light (WL) continuum. In order to excite the photoinitiators in the UV region, the visible pulses generated by the NOPA system were dispersion optimized using a prism compressor (PC) and subsequently upconverted into UV by frequency doubling using a BBO crystal. Since this method allows for pump wavelengths in a tunability range between 240 nm and 360 nm, the photoinitiators were investigated at two selected pump wavelengths (325 nm and 351 nm, respectively) with pulse energies of about 0.3 and 0.25 μJ per pulse. A computer-controlled delay stage in combination with a retro reflector was employed for measuring at different delay times. The second portion of the fundamental laser output, employed for WL generation, was focused into a sapphire plate (1 mm (4)) after passing through an iris (1), a neutral density filter (2), and a lens (3). After recollimation, the seed-wavelength was removed from the WL spectrum using a custom-made dielectric filter (Laser Components). Thus, the generated WL covers the large wavelength range of 430 nm to 710 nm employed for probing the molecules. The pump pulse and WL were focused into the sample under magic angle conditions. Behind the sample the transmitted WL was split in a prism-based polychromator and detected using a CCD camera (Linescan 2000, Ingenieurbüro Stresing). For efficient exploitation of the detector's dynamic range, the dispersed WL was attenuated using a variable neutral density filter in front of the camera. The repetition rate of the laser pulses was reduced using a chopper wheel to allow for measuring the change of the optical density (ΔOD(λ,τ)) as described in eqn (1), where I(λ,τ) and I0 are the transmitted probe light through the excited and non-excited sample. | (1) |
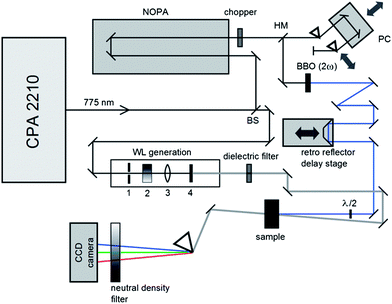 | ||
| Fig. 1 Scheme of the employed transient spectrometer consisting of a half mirror (HM), a prism compressor (PC), and a beam splitter (BS). | ||
The CCD camera was aligned using small bandwidth interference filters inserted into the WL beam path at the position of the sample. The temporal overlap between the pump and the probe beam (time zero) was adjusted by the dye molecule 7-diethylamino-3-thenoylcoumarin (DETC). The samples were continuously pumped through a fused silica cuvette with an optical path length of 1 mm to avoid decomposition by radiation. Data acquisition was performed using a home-made software in a Labview environment. Furthermore, the transient data are corrected for the chirp of the white light caused by group velocity dispersion due to optical components in the probe beam. Thereby, the chirp correction is based on the determination of the coherent artifact characterized by the temporal overlap of the pump pulse with a certain frequency component of the white light continuum.9
Theoretical methods
DFT calculations as well as TD-DFT calculations for excited states were performed employing the TURBOMOLE V6.3 program package.11 The geometries of the ground states were optimized using BP86/def2-SV(P).12–21 Energies at the optimized geometries as well as singlet and triplet excitations22–24 and associated oscillator strengths were computed by B3LYP/aug-cc-pVDZ.12–16,18–20,25–27Results and discussion
ESI-MS measurements and ionization process
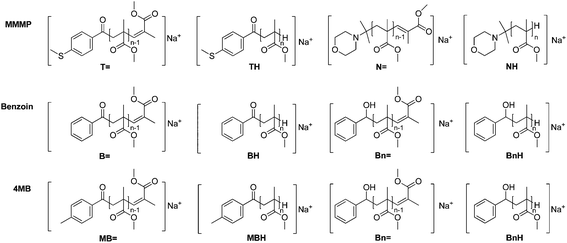
By analyzing MMMP-initiated polymer samples via size exclusion chromatography electrospray ionization mass spectrometry (SEC-ESI-MS) or direct infusion ESI-MS in common solvent mixtures such as THF–methanol or DCM–methanol, not only Na+ ionization was observed, but also the occurrence of H+ ionization of the polymer chains bearing the morpholino fragment (N) originating from MMMP as the end group. The calculation of the exact masses of MMMP- and Bz-initiated polymers, respectively, reveals the overlapping masses of the H+ ionized disproportionation products initiated by the morpholino fragment ([NH]H+, Scheme 2) and the corresponding Na+ ionized polymer chains initiated by the B fragment ([BH]Na+, Scheme 2).Therefore, as long as the H+ ionization cannot be reduced to a minimum, a quantitative comparison of the initiation efficiency of the two initiators MMMP and Bz is not feasible. Therefore, we concentrated our efforts first into achieving the suppression of H+ ionization of the morpholino end capped polymers during the ESI process.
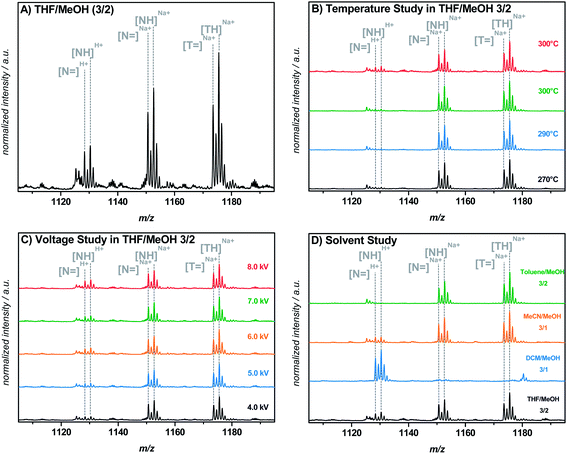
Attempts were made to control the H+ ionization during the direct ESI-MS measurement, most probably occurring at the nitrogen atom of this functionality, by variation of the salt concentration (0–500 μM NaTFA), the capillary temperature (270–320 °C), the capillary voltage (4–8 kV), and the solvent (THF–methanol (3![[thin space (1/6-em)]](https://www.rsc.org/images/entities/char_2009.gif) :
:![[thin space (1/6-em)]](https://www.rsc.org/images/entities/char_2009.gif) 2), DCM–methanol (3
2), DCM–methanol (3![[thin space (1/6-em)]](https://www.rsc.org/images/entities/char_2009.gif) :
:![[thin space (1/6-em)]](https://www.rsc.org/images/entities/char_2009.gif) 1), MeCN–methanol (3
1), MeCN–methanol (3![[thin space (1/6-em)]](https://www.rsc.org/images/entities/char_2009.gif) :
:![[thin space (1/6-em)]](https://www.rsc.org/images/entities/char_2009.gif) 1), toluene–methanol (3
1), toluene–methanol (3![[thin space (1/6-em)]](https://www.rsc.org/images/entities/char_2009.gif) :
:![[thin space (1/6-em)]](https://www.rsc.org/images/entities/char_2009.gif) 2, v/v, respectively)) as shown in Fig. 2. However, changing the capillary temperature or voltage resulted in no significant decrease of H+ ionization. The extent of H+ ionization of the morpholino functionality (in comparison to the Na+ ionization) in a THF–methanol (3
2, v/v, respectively)) as shown in Fig. 2. However, changing the capillary temperature or voltage resulted in no significant decrease of H+ ionization. The extent of H+ ionization of the morpholino functionality (in comparison to the Na+ ionization) in a THF–methanol (3![[thin space (1/6-em)]](https://www.rsc.org/images/entities/char_2009.gif) :
:![[thin space (1/6-em)]](https://www.rsc.org/images/entities/char_2009.gif) 2) mixture was observed to be independent of both the capillary temperature and voltage. Moreover, the extent of H+ ionization seemed to change arbitrarily and was partly non-reproducible. Variation of the solvent mixture finally resulted in a successful and reproducible suppression of the H+ ionization by employing toluene–methanol (3
2) mixture was observed to be independent of both the capillary temperature and voltage. Moreover, the extent of H+ ionization seemed to change arbitrarily and was partly non-reproducible. Variation of the solvent mixture finally resulted in a successful and reproducible suppression of the H+ ionization by employing toluene–methanol (3![[thin space (1/6-em)]](https://www.rsc.org/images/entities/char_2009.gif) :
:![[thin space (1/6-em)]](https://www.rsc.org/images/entities/char_2009.gif) 2) containing 300 μM NaTFA as the solvent for direct infusion ESI-MS measurements. Peak tuning prior to recording the spectra did not have any influence on the reported results. A possible explanation for the positive influence of toluene on the prevention of H+ ionization may be its very low permittivity (εr = 2.38) compared to that of THF (εr = 7.52), DCM (εr = 8.93), or acetonitrile (εr = 36.64).28 A solvent with a high permittivity supports H+ ionization during the ESI process, possibly due to its distinct field weakening effect based on the particle orientation in a charged field. Particularly the pKa value of the morpholino moiety can be influenced by a different solvent permittivity, having a substantial impact on the ionization behavior of the group. However, as depicted in Fig. 2D, the H+ ionization behavior in the solvent mixtures with either acetonitrile or DCM does not follow the trend of the permittivity, i.e., the permittivity for acetonitrile is higher than for DCM, at the same time significantly more H+ ionization occurs in the DCM mixture than in the acetonitrile mixture. Consequently, other parameters than solely the solvent permittivity are likely affecting the process and the extent of H+ ionization during the ESI process.
2) containing 300 μM NaTFA as the solvent for direct infusion ESI-MS measurements. Peak tuning prior to recording the spectra did not have any influence on the reported results. A possible explanation for the positive influence of toluene on the prevention of H+ ionization may be its very low permittivity (εr = 2.38) compared to that of THF (εr = 7.52), DCM (εr = 8.93), or acetonitrile (εr = 36.64).28 A solvent with a high permittivity supports H+ ionization during the ESI process, possibly due to its distinct field weakening effect based on the particle orientation in a charged field. Particularly the pKa value of the morpholino moiety can be influenced by a different solvent permittivity, having a substantial impact on the ionization behavior of the group. However, as depicted in Fig. 2D, the H+ ionization behavior in the solvent mixtures with either acetonitrile or DCM does not follow the trend of the permittivity, i.e., the permittivity for acetonitrile is higher than for DCM, at the same time significantly more H+ ionization occurs in the DCM mixture than in the acetonitrile mixture. Consequently, other parameters than solely the solvent permittivity are likely affecting the process and the extent of H+ ionization during the ESI process.
ESI-MS data evaluation
In a PLP sample of polymerized methacrylates, macromolecular disproportionation products can be found alongside recombination products. Analysis of the latter provides no insight into the initiation process since the presence of two initiator fragments acting as chain end groups gives no information regarding which fragment served as the initiating radical for the polymeric growth. The information on how the growth of a polymer chain was initiated, i.e., which fragment of the employed photoinitiator served as the initiating radical and which specific radical fragment performs better, is retained in the disproportionation products. In a mass spectrum, disproportionation peaks occur in pairs with a mass difference of 2 amu. In the present study the disproportionation peaks are labeled DX![[double bond, length as m-dash]](https://www.rsc.org/images/entities/char_e001.gif) or DXH – where X defines the chemical nature of the α-position of the polymer chain, i.e., the fragment that initiated the polymeric growth ((B), (T), (N), or (MB)) – while
or DXH – where X defines the chemical nature of the α-position of the polymer chain, i.e., the fragment that initiated the polymeric growth ((B), (T), (N), or (MB)) – while ![[double bond, length as m-dash]](https://www.rsc.org/images/entities/char_e001.gif) and H symbolize the nature of the ω-end of the chain, depending on the role of the end group in the H-abstraction during the disproportionation process.
and H symbolize the nature of the ω-end of the chain, depending on the role of the end group in the H-abstraction during the disproportionation process.
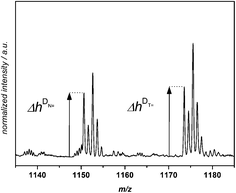
A quantitative comparison of the initiation efficiency of MMMP with Bz and 4MB towards MMA in PLP was carried out employing a method that evaluates the peak heights Δh of the polymer signals in each repeating unit (see Fig. 3). Therefore, the first peak of every peak cluster corresponding to the two disproportionation structures (bearing a double bond or no double bond as the end group, e.g., [N![[double bond, length as m-dash]](https://www.rsc.org/images/entities/char_e001.gif) ] and [NH]) was selected since this peak is the only one showing no isobaric overlap with major product peaks.
] and [NH]) was selected since this peak is the only one showing no isobaric overlap with major product peaks.
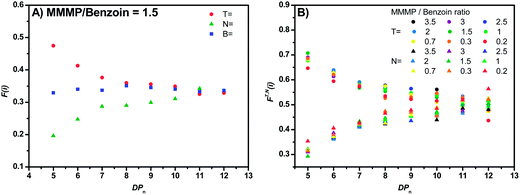
The relative peak heights can be employed for the calculation of the mole fraction FX(i) (see eqn (S1)†) of a disproportionation product, bearing a certain end group functionality X derived from the initiating fragment. Thus, FX(i) is directly correlated with the relative number of macromolecular chains initiated by the aforementioned fragment that can be found in the polymer sample. It can be assumed that the initiating fragment does not affect the propagation of the monomer radical (at least not for DPn > 2) and that therefore an equal distribution of the end group X is present over all chain lengths. The FX(i) values for a certain fragment X can be plotted versus the degree of polymerization DPn (refer to Fig. 5(A)) in order to illustrate the distribution of X over all detected chains in the ESI-MS. If this plot shows a constant gradient close to zero, a chain length-independent ESI process can be assumed, i.e., the ionization ability of polymer chains being not influenced by the chain length.
However, for various reasons, a chain length-dependent ionization process occurs in some cases. In order to overcome a potentially mass biased ESI process, a modified method based on Günzler et al.4 established in previous quantitative mass spectrometric evaluations was employed. The approach that is utilized here is equivalent to our previous studies, e.g., in the case of the mesitoyl and benzoyl fragment.6 The approach is illustrated in the ESI in eqn (S2)–(S5),† where GX![[double bond, length as m-dash]](https://www.rsc.org/images/entities/char_e001.gif) (i) is the ratio of the peak heights of DX1
(i) is the ratio of the peak heights of DX1![[double bond, length as m-dash]](https://www.rsc.org/images/entities/char_e001.gif) and DX2
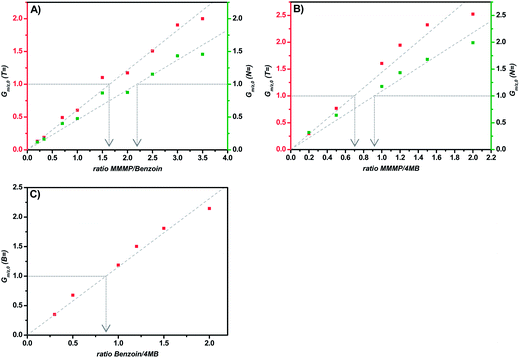
and DX2![[double bond, length as m-dash]](https://www.rsc.org/images/entities/char_e001.gif) (where i is the considered repeating unit, (i − 1) the preceding repeating unit, and (i + 1) the following repeating unit). After averaging G, G′, and G′′ one obtains the mass bias-free ratio of two disproportionation products Gm/z,0 that can be plotted against the molar ratio of the photoinitiators in the initial polymerization mixture. These Gm/z,0 plots serve as a quantitative tool for the evaluation of the initiation efficiency of an initiator fragment X1 in comparison to X2 (e.g., fragment T in comparison to B). When plotting Gm/z,0versus the initiator ratio, a linear trend can be observed. The ratio for which Gm/z,0 = 1 is the initiator ratio that is necessary to achieve an equal initiation ability of the compared fragments and that is consequently the quantitative initiation efficiency ratio between these fragments.
(where i is the considered repeating unit, (i − 1) the preceding repeating unit, and (i + 1) the following repeating unit). After averaging G, G′, and G′′ one obtains the mass bias-free ratio of two disproportionation products Gm/z,0 that can be plotted against the molar ratio of the photoinitiators in the initial polymerization mixture. These Gm/z,0 plots serve as a quantitative tool for the evaluation of the initiation efficiency of an initiator fragment X1 in comparison to X2 (e.g., fragment T in comparison to B). When plotting Gm/z,0versus the initiator ratio, a linear trend can be observed. The ratio for which Gm/z,0 = 1 is the initiator ratio that is necessary to achieve an equal initiation ability of the compared fragments and that is consequently the quantitative initiation efficiency ratio between these fragments.
Consequently, in the following sections we will discuss case by case the binary cocktail experiments of the three aforementioned initiators as well as a trio experiment simultaneously containing the three initiators.
Comparison MMMP/Bz
The comparison of the fragments T and N of MMMP with the benzoyl fragment B of Bz (Fig. 4(A)) results in an initiation efficiency ratio of 1.6 and 2.2, respectively. More precisely, the same number of polymer chains initiated by the T (or N) and B fragments, respectively, can be achieved by employing a photoinitiator mixture of MMMP/Bz in a molar ratio of 1.6![[thin space (1/6-em)]](https://www.rsc.org/images/entities/char_2009.gif) :
:![[thin space (1/6-em)]](https://www.rsc.org/images/entities/char_2009.gif) 1 (or 2.2
1 (or 2.2![[thin space (1/6-em)]](https://www.rsc.org/images/entities/char_2009.gif) :
:![[thin space (1/6-em)]](https://www.rsc.org/images/entities/char_2009.gif) 1). Thus, the B fragment of Bz shows an initiation ability that is 1.6 times higher than that of the T fragment and 2.2 times higher than that of the N fragment originated from MMMP.
1). Thus, the B fragment of Bz shows an initiation ability that is 1.6 times higher than that of the T fragment and 2.2 times higher than that of the N fragment originated from MMMP.
Comparison MMMP/4MB
In contrast to the comparison of MMMP with Bz evaluated above, the benzoin-like fragment 4MB shows a lower initiation ability than both the T and the N fragments of MMMP (Fig. 4(B)). A molar ratio of MMMP/4MB of 0.7 needs to be employed for an equal initiation of T and MB fragments and a ratio of 0.9 has to be employed for an equal initiation of N and MB.Comparison Bz/4MB
A third duo experiment – the comparison of Bz and 4MB – was carried out to complete the investigation of all three photoinitiators. In this experiment only the B fragment can be compared since the peaks of the second Bz fragment (Bn) show an isobaric overlap with the DBH peaks and therefore cannot be evaluated. An initiation efficiency ratio of 0.86 was found, indicating the benzoyl radical – originating from Bz – to be more reactive than the 4MB radical fragment regarding the initiation of polymerization (Fig. 4(C)).Comparison Bz/4MB/MMMP
In trio cocktail experiments (refer to ESI and Fig. S1†) the initiation ability of the benzoyl fragment of Bz clearly surpasses both MMMP fragments (T and N) as well as the 4MB fragment. At the same time, in contrast to the results of the experiments with two compared initiators, the T and MB fragments show almost equal initiation abilities.Ionization and solubility effects in the MMMP-initiated polymer
In order to detect a potential chain length-dependent ionization behavior of the analyzed polymer samples, the mole fractions F(i) of specific disproportionation products (refer to eqn (S1)†) were plotted versus the polymerization degree DPn of the considered polymer chains. Declining values of F(i) (with increasing DPn) correspond to a relative decrease in peak intensity in the mass spectrum for longer chains, as can be observed for the T fragment of MMMP (Fig. 5(A)). At a first glance, one might assume that the initiating fragment T tends to produce shorter polymer chains than N and therefore lower peak intensities are detected for longer chains. However, an influence of the α-group (the initiator fragment) on the propagating radical chain end (the ω-group) over several repeating units (especially at DPn > 2 where penultimate effects do not apply anymore29) can be excluded and an equal propagation rate for all polymer chains in a PLP sample can be assumed. Therefore, declining values of F(i) are indicative of a chain length-dependent ionization behavior of the observed polymer chains. This behavior indeed occurs for the MMMP-initiated polymers. With increasing DPn the F(i) values of the disproportionation peaks decrease for chains initiated by the T fragment and increase for chains bearing the N end group. At the same time the mole fractions of B-initiated disproportionation products remain relatively constant over the whole DPn range (refer to Fig. 5(A)). In our earlier studies, where we analyzed the quantitative initiation efficiency of benzoin-like derivatives,5,6 such a clear chain length-dependent ionization behavior, as it appears for MMMP, was not observed. In order to exclude any unusual ionization behavior inherent to MMA – however unlikely it may be – ethyl methacrylate (EMA) was polymerized with MMMP via PLP and the resulting polymer was assessed via ESI-MS. EMA was chosen due to its structural similarity to MMA, bearing one additional carbon unit. Both the PLP experiment and the ESI-MS measurement were carried out under identical conditions as for the MMMP-initiated polymerization of MMA. As expected, the F(i) values of the disproportionation peaks T![[double bond, length as m-dash]](https://www.rsc.org/images/entities/char_e001.gif) and N
and N![[double bond, length as m-dash]](https://www.rsc.org/images/entities/char_e001.gif) of the poly(ethyl methacrylate) show the same asymptotic behavior as for the MMMP-initiated poly(methyl methacrylate) (refer to Fig. S2†).
of the poly(ethyl methacrylate) show the same asymptotic behavior as for the MMMP-initiated poly(methyl methacrylate) (refer to Fig. S2†).
In order to detect a possible connection between the decrease of the DT![[double bond, length as m-dash]](https://www.rsc.org/images/entities/char_e001.gif) peak heights and the increase of the DN
peak heights and the increase of the DN![[double bond, length as m-dash]](https://www.rsc.org/images/entities/char_e001.gif) peak heights, the mole fractions FT(i) and FN(i), which exclude the DB
peak heights, the mole fractions FT(i) and FN(i), which exclude the DB![[double bond, length as m-dash]](https://www.rsc.org/images/entities/char_e001.gif) peaks (see eqn (2) and (3)), are plotted versus the DPn (refer to Fig. 5(B)).
peaks (see eqn (2) and (3)), are plotted versus the DPn (refer to Fig. 5(B)).
 | (2) |
 | (3) |
An asymptotic behavior for the mole fractions FT(i) and FN(i) is observed. For low degrees of polymerization, the T-initiated polymer chains seem to be the predominant products and only very low peak intensities for N-initiated polymer chains are observed. However, for increasing the DPn the proportion of the N-initiated chains increases up to FN(i) = 0.5, whereas FT(i) decreases to FT(i) = 0.5. Such a converging behavior is possibly due to either solubility or ionization effects caused by the morpholino group of the analyzed N-initiated polymer chains. A poor solubility or ionization behavior of the morpholino group causes a low detection rate for short polymer chains. However, through the lengthening of the polymer chains the influence of the morpholino group on the solubility or ionization of the entire molecule diminishes and the influence of the repeating units becomes dominating, resulting in a similar behavior of N![[double bond, length as m-dash]](https://www.rsc.org/images/entities/char_e001.gif) and T
and T![[double bond, length as m-dash]](https://www.rsc.org/images/entities/char_e001.gif) at higher DPns. Thus, an asymptotic behavior of the mole fractions of the DT
at higher DPns. Thus, an asymptotic behavior of the mole fractions of the DT![[double bond, length as m-dash]](https://www.rsc.org/images/entities/char_e001.gif) and DN
and DN![[double bond, length as m-dash]](https://www.rsc.org/images/entities/char_e001.gif) peak heights is observed. Logically, the intersection of both mole fractions for DPn = 12 at a mole fraction value of 0.5 for both fragments indicates an equal initiation efficiency of both fragments of MMMP. So far it is not clear if poor solubility of the morpholino group in toluene or if poor Na+ ionization of this group during the ESI process is the determining factor for the described effect.
peak heights is observed. Logically, the intersection of both mole fractions for DPn = 12 at a mole fraction value of 0.5 for both fragments indicates an equal initiation efficiency of both fragments of MMMP. So far it is not clear if poor solubility of the morpholino group in toluene or if poor Na+ ionization of this group during the ESI process is the determining factor for the described effect.
In order to ensure that the aforementioned behavior does not affect the quantitative comparison of the initiation efficiency between the T fragment of MMMP and the B fragment of Bz, a corrected plot of Gm/z,0versus the initiator ratio was prepared by selecting only chains with DPn = 8–12 for the calculation (refer to Fig. 6). This approach is aimed at diminishing the influence of short chains on the evaluation of Gm/z,0. However, no significant difference of the initiation efficiency ratio (the initiator ratio at which Gm/z,0 = 1) using the two approaches – taking into account all chain lengths or solely those with DPn = 8–12 – could be detected, demonstrating the applicability of the mass bias-free evaluation (refer to eqn (S2)–(S5)†).
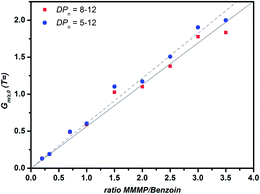 | ||
| Fig. 6 Plot of Gm/z,0versus the initiator ratio for two DPn ranges that were employed to calculate Gm/z,0 for the two initiator fragments T and B, derived from MMMP and Bz. | ||
Steady-state spectroscopy
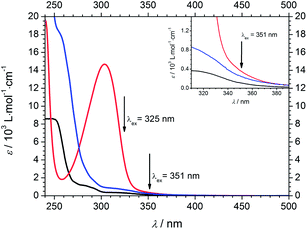
Fig. 7 displays the wavelength dependent extinction coefficients of Bz (black), 4MB (blue), and MMMP (red) in MIB as the solvent. A similar molecular structure of Bz and 4MB ensures the comparability of their steady state spectra. Both initiator molecules show a weak absorption band centered around 320 nm and a strong band below 250 nm saturated for Bz (not shown here). For Bz two weak shoulders around 284 nm and 292 nm can be identified, whereas 4MB exhibits a shoulder at 257 nm. In contrast, MMMP displays a broad absorption band centered at 304 nm, revealing a high extinction coefficient and a small shoulder close to 350 nm as well as further transitions below 250 nm (not shown). The pump wavelengths at both 351 nm and 325 nm are marked by arrows; the inset graph in Fig. 7 depicts the area between 310 nm and 390 nm in more detail. Since the photoinitiators were excited at 351 nm in the PLP-ESI-MS experiments, the same wavelength was chosen to pump the initiator molecules in the time-resolved transient absorption experiments. However, as a result of the employed pump wavelength generation the signal-to-noise-ratio of the transient spectra was very low at 351 nm. In order to obtain a better signal-to-noise-ratio, we performed additional transient absorption experiments at a second pump wavelength of 325 nm. This wavelength resulted in higher excitation probabilities and in a substantially increased quality of the transient spectra. Thus, a dataset was recorded at 325 nm allowing for a detailed analysis of the photophysical properties of the investigated photoinitiators as well as for direct comparison with the PLP-ESI-MS experiments at 351 nm.The extinction coefficients at both pump wavelengths are listed in Table 1 together with the concentrations for an optical path length of 1 mm and an optical density of 1.0 (MMMP) and 0.6 (Bz and 4MB), respectively. Due to the lower solubility of Bz and 4MB in MIB, compared to MMMP, a higher optical density could not be obtained. Nevertheless, MIB serves as a suitable solvent due to its structural similarity to methyl methacrylate, the monomer that was employed in the PLP-ESI-MS experiments. As Table 1 illustrates, all three initiator molecules exhibit higher extinction coefficients at a wavelength of 325 nm than at 351 nm. Furthermore, MMMP exhibits the highest extinction coefficient at both wavelengths differing by a factor of approximately 1.4 compared to 4MB and 3.2 compared to Bz at 351 nm. At the same time, the difference at 325 nm is significantly larger resulting in a factor of approximately 5.3 (4MB) and 11.4 (Bz), respectively. The comparison of 4MB and Bz shows that the extinction coefficients of 4MB are for both wavelengths higher by a factor of about 2.2. However, as our previous studies7 pointed out, the comparison of the extinction coefficients at the pump wavelengths is not sufficient for understanding the underlying processes that lead to different initiation efficiencies. Taking into account Fig. 7, exciting at 351 nm as well as at 325 nm corresponds to excitation into the first weak absorption bands of Bz and 4MB. As a consequence of the proximity of the strong absorption band (304 nm) and the shoulder around 350 nm in the spectrum of MMMP, a contribution of higher excited states is expected for both pump wavelengths.
| ε/(103 L mol−1 cm−1) | c/(10−2 mol L−1) | |||
|---|---|---|---|---|
| 325 nm | 351 nm | 325 nm | 351 nm | |
| MMMP | 3.571 | 0.354 | 0.28 | 2.82 |
| 4MB | 0.669 | 0.245 | 0.89 | 2.44 |
| Bz | 0.311 | 0.110 | 1.92 | 5.45 |
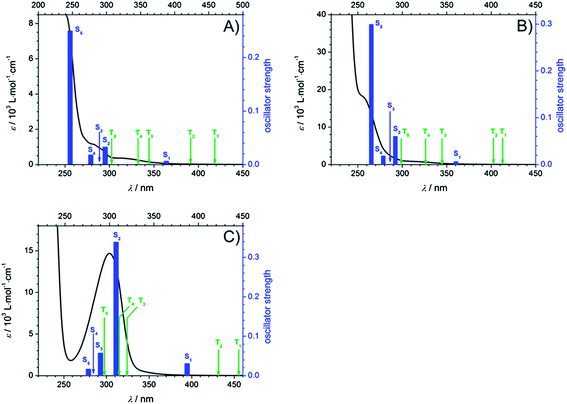
To obtain deeper insight into the character of the involved excited states after pumping at 351 nm and 325 nm, several selected singlet excitations and their corresponding oscillator strengths as well as triplet excitations relative to S0 were computed (TD-DFT/B3LYP/aug-cc-pVDZ). Fig. 8 displays the calculated transitions combined with the experimental extinction coefficients in MIB for Bz (A), 4MB (B), and MMMP (C). Thereby, singlet excitations are assigned by blue bars with respect to their oscillator strengths and triplet excitations are labeled with green arrows. The predicted singlet transitions are in reasonable agreement with the experimental results obtained from the recorded UV-VIS spectra revealing a slight red shift. For an overview of the calculated values the reader is referred to the ESI (Table S1†). Considering these results, it can be concluded that for Bz and 4MB excitation at 351 nm and 325 nm exclusively correspond to a transition into the first excited singlet state S1, since transitions into higher states are considerably more blue-shifted. However, for MMMP a combination of excitation into S1 as well as into higher singlet states (at least S2) is assumed considering the vicinity of the strong absorption band at 304 nm, which consists of several singlet transitions characterized by high oscillator strengths, as well as the full width at half maximum (FWHM) of the pump pulses of about 6–10 nm. As inspection of molecular orbitals shows, the main contribution to the S1–S0 transition is provided by the highest occupied (HOMO) and the lowest unoccupied molecular orbital (LUMO) exhibiting a charge transfer character into an 1(nπ*) state for all three photoinitiators. For a detailed depiction and discussion the reader is referred to see the ESI and Fig. S4.†
Time-resolved spectroscopy
Fig. 9 displays the transient absorption spectra of Bz (A), 4MB (B), and MMMP (C) at 351 nm. As mentioned in the experimental setup section the intensities of the recorded spectra at a wavelength of 351 nm are rather weak, while the transient traces recorded at 325 nm (shown in Fig. 9, Bz (D), 4MB (E), MMMP (F)) exhibit considerably higher intensities, i.e., larger ΔOD values. Furthermore, the transient features observed at 325 nm are comparable with the results obtained at 351 nm wavelength. For MMMP a significant spectral shift of the absorption bands from 520 nm to 500 nm (refer to Fig. 9(C) and (F), respectively) was found. Additionally, in the spectra recorded at 325 nm, a weak absorption in the spectral region of 600–700 nm can be observed for all three photoinitiators. To some extent this weak absorption also occurs in the spectra obtained at 351 nm.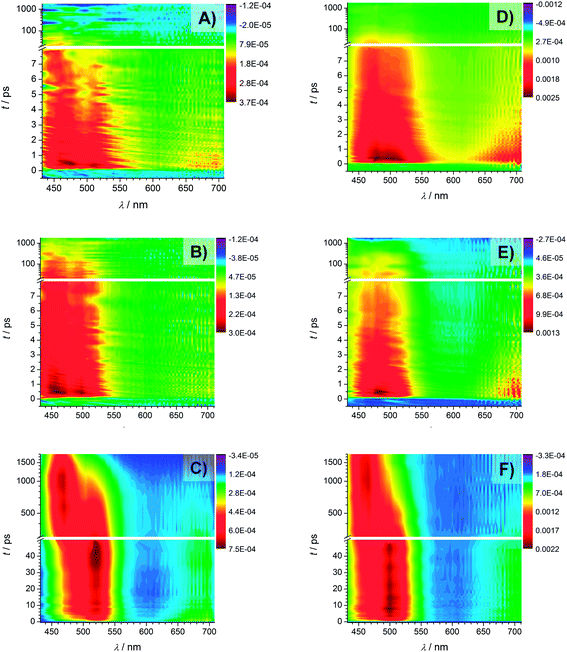 | ||
| Fig. 9 Transient spectra recorded with a pump wavelength of 351 nm of Bz (A), 4MB (B), and MMMP (C) and transient spectra recorded with a pump wavelength of 325 nm of Bz (D), 4MB (E), and MMMP (F). | ||
The spectra of Bz and 4MB exhibit a similar structure showing dominant absorption in a wavelength region between 430 nm and 540 nm. Comparing the temporal evolution, the observed absorption decays slower for 4MB. In contrast, two distinguishable absorption bands can be detected for MMMP in a similar wavelength range. One of them (maximum at 520 nm (Fig. 9(C)) and 500 nm (Fig. 9(F))) directly appears at time zero and decays within the observed time window (1.8 ns), whereas the second band centered at 464 nm (for both pump wavelengths) appears considerably later. Apparently, both the decrease of the first absorption band and the increase of the second absorption band occur on the same time scale. The decrease of the second absorption band cannot be observed on the applied time scale. In summary, a depopulation of the excited species observed at 520 nm apparently leads to a population of another excited species observed at 464 nm.
The TA spectra were analyzed by multiexponential fit functions as described below, consisting of a sum of exponential functions containing the time constants τi as well as the amplitudes Ai(λ) as parameters (refer to eqn (4)).
 | (4) |
This sum is convoluted with an error function including the parameter τ0 which is a measure of the experimental time resolution and models the increase of the transient absorption traces. All time constants are listed in Table 2 (left: 351 nm and right: 325 nm) and were obtained by global fitting with the program Origin 9.0.
| 351 nm | 325 nm | |||||
|---|---|---|---|---|---|---|
| Bz | 4MB | MMMP | Bz | 4MB | MMMP | |
| τ 1 | 3.2 ps ± 0.2 ps | 2.5 ps ± 0.1 ps | 1.9 ps ± 0.1 ps | 2.5 ps ± 0.1 ps | 2.5 ps ± 0.1 ps | 1.1 ps ± 0.1 ps |
| τ 2 | (50–80) ps | (80–180) ps | 70 ps ± 7 ps | (50–80) ps | (150–350) ps | 57 ps ± 6 ps |
| τ 3 | >1.8 ns | >1.8 ns | (650–850) ps | >1.8 ns | >1.8 ns | (450–650) ps |
| τ 4 | — | — | >1.8 ns | — | — | >1.8 ns |
The analysis of the time constants reveals a similar behavior for Bz and 4MB. We found a biexponential decay on a picosecond time scale for these two initiator molecules at 351 nm by fitting the spectral region of the transient absorption bands between 441 and 552 nm (Bz) and 441 and 540 nm (4MB), respectively, resulting in the constants τ1 and τ2. A further common feature for both molecules is a residual TA throughout the accessible time window of 1.8 ns leading to τ3. The values of the first time constant – as shown in Table 2 – are very similar for Bz (3.2 ps ± 0.2 ps) and 4MB (2.5 ps ± 0.1 ps), while the second time constant is substantially lower for 4MB than for Bz, showing a considerable difference of approximately 30–100 ps. In comparison, the third time constants are significantly higher than the experimental time window and therefore undefined. As a result, the determination of τ2 is more inaccurate than the determination of τ1. The error margin of τ2 is estimated to be equal or less than 5%. Analysis of the TA traces at 325 nm in the same spectral region can as well be modeled by three time constants revealing a similar behavior compared to traces at 351 nm. Considering Table 2, the obtained values are characterized by lower or equal time constants compared to 351 nm, except τ2 for 4MB (150–350 ps). These findings are in good agreement with our previous study of Bz in methanol7 showing larger time constants presumably due to different solvent effects in MIB and methanol. For MMMP the different transient signatures as well as the contribution of higher singlet states than S1 after pumping indicate a more complex mechanism compared to Bz and 4MB. Analysis of the spectral region between 435 nm and 549 nm has shown that a fourfold exponential fit function is required for an adequate description of the transient data. The first three time constants are located on a picosecond time scale, whereas the fourth time constant is outside of the experimental time window. Thus, following the above rationale, the error margins of τ1 (≤5%) and τ2 (≤10%) are relatively small. The TA traces are characterized by a biexponential increase of transient absorption (τ1 and τ2). Furthermore, τ3 describes the decay of the first absorption band as well as the increase of the second band, whereas the fourth time constant models the decay for long delay times. The observed weak transient absorption in the spectral region between 600 and 700 nm can be analyzed in an analogous manner revealing comparable time constants indicating similar underlying processes. Due to the low overall amplitudes its analysis was, however, not further pursued.
Quantum chemical calculations
In order to evaluate the transient data it is essential to obtain insights into the electronic state properties of MMMP, Bz, and 4MB. The optimized geometries of the three photoinitiators were calculated using DFT/BP86/def2-SV(P) (refer to Fig. S3†). Taking into account our earlier study7 and previous investigation of Bz,30 the trans structure has been identified as the most stable and relevant form for α-cleavage from the triplet state in polar solvents. Therefore, the conceivable optimized geometries revealing a cis position with regard to the hydroxyl and carbonyl group will not be discussed in this study.For the minimum geometries the ground state energies without (S0) and with (S0+corr) zero point correction (DFT/B3LYP/aug-cc-pVDZ) were calculated and are listed in Table S2.†
Since the radical formation of type I photoinitiators originates from triplet states, relaxation via ISC is a decisive step for the overall process. As predicted by the El-Sayed selection rules,311(nπ*) states can easily undergo ISC processes into 3(ππ*) states. Apart from the change of the orbital angular momentum it is also worth taking a look at the order of magnitude of the energy gap between singlet and triplet states. For all three photoinitiators the smallest values are found for the energy difference between S1 and T2. Thereby, the values for Bz (0.238 eV) and MMMP (0.268 eV) differ only slightly, whereas a higher value of 0.362 eV was found for 4MB. A closer inspection of the involved orbitals reveals at least a partial 3(ππ*) character of T2 for the investigated initiators. A detailed discussion combining the theoretical and time-resolved results is given in the following section.
Discussion of transient data
Bz and 4MB
As a consequence of their related transient features as well as their similar molecular structure the two photoinitiators Bz and 4MB are discussed together in the following part. After excitation into S1 both population of T1via ISC and its depopulation via α-cleavage can be observed within the accessible time window of 1.8 ns in agreement with our previous study.7 Thus, the third time constant associated with the observed residual absorption for long delay times is related to absorption of the reaction products generated by α-cleavage. Therefore, the relaxation process connected to τ2 can be assigned to the depopulation of T1via an α-cleavage reaction. Compared to our earlier study,7 the value of 50–80 ps found for Bz in MIB is considerably larger than 14.3 ps ± 0.9 ps found in methanol7 indicating a strong solvent dependence of the α-cleavage as predicted by a previous study of Bz.30 Furthermore, the population of the triplet states is described by the first time constant τ1 being likewise lower in MIB for Bz (3.2 ps ± 0.2 ps) than in methanol (1.2 ps ± 0.2 ps).7 As pointed out in the theoretical calculation section, the ISC is very likely to take place between S1 and T2. The observed time constants of 3.2 ps ± 0.2 ps (Bz) and 2.5 ps ± 0.1 ps (4MB) for this process are in good agreement with typical values around 2–3 ps observed in similar type I photoinitiator systems.32 Keeping in mind that internal conversion (IC) processes into the ground state are always a further possibility of depopulating S1 on a (sub)picosecond time scale, a convolution of IC and ISC cannot be excluded for τ1. Therefore, τ1 should be interpreted as a combination of two relaxation processes leading to τ1 = (τIC·τISC)/(τIC + τISC). Thus, the value of τ1 can only be estimated as a lower limit for the underlying ISC process.Fig. 10 reveals the decay associated difference spectra (amplitudes Ai) for Bz (A) and 4MB (B) connected to the three time constants in the fit function. They correspond to the spectral signatures of the three exponentially decaying species assumed by the fit model, namely S1 (A1, τ1), T1 (A2, τ2) and the radicals (A3, τ3). The first amplitude A1 exhibits a similar trend for both Bz and 4MB. Furthermore, the evolutions of A2 and A3 are comparable for the two initiator molecules, yet showing a higher interspace for Bz.
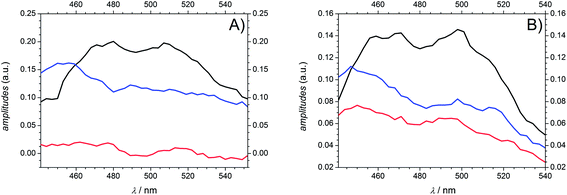 | ||
| Fig. 10 Amplitudes A1 (black), A2 (blue), and A3 (red) derived from global fits for Bz (A) and 4MB (B) at a pump wavelength of 351 nm. | ||
Values for relative amplitudes were obtained for three selected probe wavelengths (477 nm, 489 nm, and 501 nm) in the vicinity of the peak absorption and at a pump wavelength of 351 nm. One could argue whether integration over the entire absorption band instead of three wavelengths would give more reliable values. However, caused by limitations of the employed WL the recorded transient spectra reveal the relevant spectral signature only partially (no transient signature below 430 nm is accessible). Furthermore, considering Fig. 8 an unambiguous attribution to specific singlet or triplet transitions would be cumbersome due to an increasing number of excited states contributions, even if one had sufficient spectral information.
The relative amplitudes for 489 nm are listed in Table 3 (for the other values refer to Table S3†). For both Bz and 4MB, the first amplitude A1,rel shows the highest contribution to the TA. In a comparison of the second and third amplitudes, A3,rel plays a minor role for Bz, whereas for 4MB these two amplitudes show nearly equal contributions.
| 351 nm/489 nm | A 1,rel | A 2,rel | A 3,rel |
|---|---|---|---|
| Bz | 0.59 | 0.40 | 0.01 |
| 4MB | 0.49 | 0.28 | 0.23 |
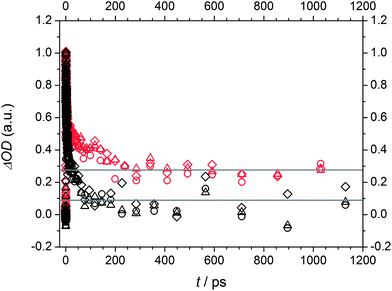
Fig. 11 displays the normalized TA traces at the selected probe wavelengths for Bz (black) and 4MB (red) at 351 nm. Assuming similar absorption properties of the initially populated excited states and the radical products of α-cleavage, the resulting ΔOD (a.u.) values (refer to eqn (1)) can be employed for an estimation of the ability of radical formation. The relationship of the ΔOD values between 4MB and Bz is determined by a factor of approximately 3.4 (ΔOD (a.u.) = 0.08 for Bz and ΔOD (a.u.) = 0.27 for 4MB) indicating that 4MB shows a 3.4 times higher capability towards radical formation. The efficiency of radical generation depends on the efficiency of the ISC process as well as on competitive reactions like IC processes which can depopulate the T1 state. Since the transient data do not allow for a quantitative analysis of such additional processes a quantitative determination of the ISC efficiencies is not possible in this case. Assuming that competitive IC processes are negligible and thus, the quantum yield of radical formation originating from T1 is Φradical ≅ 1 the obtained value of 3.4 can be associated with the relationship of the ISC efficiencies between 4 MB and Bz. In summary, it can be stated that the ability of radical formation of 4 MB is higher than that of Bz. This behavior is also observable at 325 nm excitation (refer to Fig. S5 for amplitudes, Table S4 for relative amplitudes, and normalized TA traces (Fig. S6†)). Since the transient data at 325 nm reveal the same spectral features and can also be analyzed by three time constants, excitation into the same excited state (S1) compared to 351 nm is very likely. Moreover, this assumption is supported by the results discussed in the quantum chemical calculation section. Thereby, transition into a higher Franck–Condon region of S1 results in lower values for the time constants, except for τ2 for 4MB, in comparison to 351 nm. Apart from that, comparable lower limits for the ISC processes of Bz and 4MB as well as the trend for longer time constants associated with α-cleavage for 4MB are observed.
MMMP
As mentioned in the quantum chemical calculation section a combination of excitation into S1 and S2 is assumed for MMMP at 351 nm. Furthermore, the observation of the two spectral and temporal separable bands and the determination of a fourth time constant indicate a different relaxation mechanism after photoexcitation than for Bz or 4MB. In agreement with a study by Morlet-Savary et al.,33 carried out on a picosecond time scale, the first absorption band centered at 520 nm is assigned mainly to singlet–singlet absorption originating from S1, whereas the second absorption band centered at 464 nm is associated with absorption of the first excited triplet state T1. Fig. 12 displays the amplitudes Ai (A1 (black), A2 (blue), A3 (red), and A4 (green)) obtained from the global fits at 351 nm. Thereby, A1, A2, A3, and A4 are associated with τ1, τ2, τ3, and τ4, respectively. An evaluation of the transient data shows that both the decay of the singlet absorption band as well as the rise of the triplet absorption band are directly attributed to τ3 (650–850 ps) displayed by the positive and negative signature of the corresponding amplitude A3. Therefore, the assignment of τ3 to an ISC process originating from S1 stays in good agreement with a previous study on MMMP.33 Considering the quantum chemical calculations, the ISC of MMMP very likely takes place from S1 into T2 analogous to the ISC found for Bz and 4MB. Thus, the process associated with τ4 is assigned to the triplet lifetime and α-cleavage reaction, respectively, and characterized by a positive signature of the amplitude A4. As a result of the long lived triplet state absorption, the cleavage reaction products are not observable within the accessible time window of 1.8 ns. Additionally, two smaller time constants τ1 and τ2 are determined characterizing the rise of the TA traces within the first 100 ps. The associated amplitudes A1 and A2 show a slightly negative and similar signature with a maximum contribution around 520 nm (refer to Fig. 12). Such behavior points out that different steps have to be associated including excited state vibrational relaxation within S1 and S2, IC from S2 (or higher) to S1, and ISC from S2 (or higher) to triplet states. Vibrational relaxation is indicated by the pump wavelength dependence of the time constant (refer to Table 2). IC and ISC are in line with a study by Morlet-Savary et al.,33 but with a limited time resolution of 10 ps. Although the present study was performed with a much better temporal resolution, it is still not possible to disentangle the different contributions indicated by τ1 and τ2.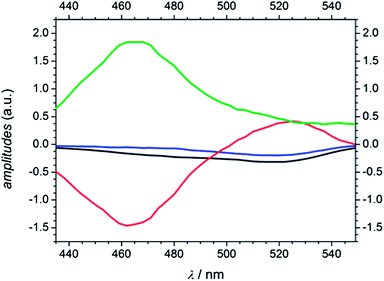 | ||
| Fig. 12 Amplitudes of MMMP derived from global analysis at a pump wavelength of 351 nm (A1 (black), A2 (blue), A3 (red), and A4 (green)). | ||
In comparison to Bz and 4MB, the time constant assigned to ISC from S1 (τ1) is considerably higher for MMMP (τ3) as well as the constant assigned to α-cleavage (τ3 for Bz and 4MB, τ4 for MMMP). As a consequence of the spectral differences of the singlet and triplet absorption band relative amplitudes cannot be determined at one probe wavelength as it was the case for Bz and 4MB. Furthermore, resulting from the long triplet lifetime we cannot observe or specify any cleavage products.
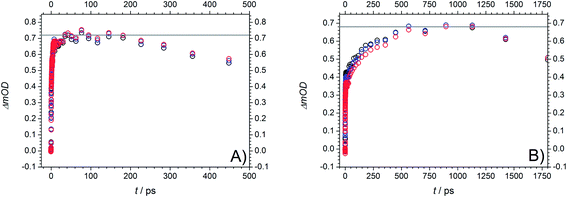
However, assuming that the contribution of higher triplet state absorption is negligible, we were able to determine the maximum absorption of the S1 and T1 state from the TA traces around 520 nm and 464 nm at 351 nm excitation. Fig. 13 shows the maximum of the first absorption band at three probe wavelengths (519 nm, 522 nm, and 525 nm, (A)) as well as the maximum of the second band (465 nm, 468 nm, and 471 nm, (B)).
Assuming comparable absorption properties for both excited states, the obtained TA values of ΔOD = 0.72 and ΔOD = 0.68, respectively, are a measure of the number of generated molecules in these two states and therefore for the ISC efficiency originating from S1. The relationship between the obtained values is approximately 0.94 indicating a high population of T1 (94%) and thus a high ISC efficiency. Assuming that the T1 state is mainly depopulated by α-cleavage and competitive processes play only a minor role (Φradical ≅ 1), the calculated relation additionally postulates a high ability of radical formation for MMMP at 351 nm. In line with our previous considerations, excitation at 325 nm leads to an increase of contributions of higher singlet states to the transient spectra and finally results in lower time constants and a spectral shift of the singlet absorption band. An analogue estimation of the efficiency of radical generation as well as the amplitudes derived from global fitting at 325 nm are listed in the ESI (Fig. S7 and S8).† The population of the T1 state was calculated to be about 95 %. In summary, it can be stated that a higher ability of radical formation was found for 4 MB and presumably also for MMMP compared to Bz.
Concluding remarks
Comparison of post-mortem analysis and femtosecond spectroscopy
As already concluded from our previous study,7 the magnitude of the extinction coefficients ε at the employed pump wavelength does not necessarily correlate with the determined initiation efficiencies of the three investigated photoinitiator molecules. Comparing the excitation probabilities we would expect a higher initiation ability for MMMP (0.354 × 10³ L mol−1 cm−1) and 4MB (0.245 × 10³ L mol−1 cm−1) with respect to Bz (0.110 × 10³ L mol−1 cm−1) at 351 nm. However, the ratio of the extinction coefficients can be employed for the normalization of the initiation efficiencies, which are scaled to the concentration of initiator molecules, thus making them independent of the excitation probability. Table 4 contains the initiation efficiencies derived from PLP-ESI-MS experiments (for details see Comparison MMMP/Bz, Comparison MMMP/4MB, Comparison Bz/4MB) as well as relationships normalized to the corresponding extinction coefficients at 351 nm. Thereby, the values of the efficiencies are multiplied by the respective factors calculated from the relationship of the extinction coefficients at 351 nm and are summarized in Table 5.| Compared fragments | Initiation efficiencies based on PLP-ESI-MS | Initiation efficiencies normalized to extinction coefficients ε at 351 nm |
|---|---|---|
B![[thin space (1/6-em)]](https://www.rsc.org/images/entities/char_2009.gif) : :![[thin space (1/6-em)]](https://www.rsc.org/images/entities/char_2009.gif) MB MB |
1![[thin space (1/6-em)]](https://www.rsc.org/images/entities/char_2009.gif) : :![[thin space (1/6-em)]](https://www.rsc.org/images/entities/char_2009.gif) 0.86 0.86 |
1![[thin space (1/6-em)]](https://www.rsc.org/images/entities/char_2009.gif) : :![[thin space (1/6-em)]](https://www.rsc.org/images/entities/char_2009.gif) 0.39 0.39 |
B![[thin space (1/6-em)]](https://www.rsc.org/images/entities/char_2009.gif) : :![[thin space (1/6-em)]](https://www.rsc.org/images/entities/char_2009.gif) T T |
1![[thin space (1/6-em)]](https://www.rsc.org/images/entities/char_2009.gif) : :![[thin space (1/6-em)]](https://www.rsc.org/images/entities/char_2009.gif) 0.63 0.63 |
1![[thin space (1/6-em)]](https://www.rsc.org/images/entities/char_2009.gif) : :![[thin space (1/6-em)]](https://www.rsc.org/images/entities/char_2009.gif) 0.28 0.28 |
B![[thin space (1/6-em)]](https://www.rsc.org/images/entities/char_2009.gif) : :![[thin space (1/6-em)]](https://www.rsc.org/images/entities/char_2009.gif) N N |
1![[thin space (1/6-em)]](https://www.rsc.org/images/entities/char_2009.gif) : :![[thin space (1/6-em)]](https://www.rsc.org/images/entities/char_2009.gif) 0.45 0.45 |
1![[thin space (1/6-em)]](https://www.rsc.org/images/entities/char_2009.gif) : :![[thin space (1/6-em)]](https://www.rsc.org/images/entities/char_2009.gif) 0.20 0.20 |
T![[thin space (1/6-em)]](https://www.rsc.org/images/entities/char_2009.gif) : :![[thin space (1/6-em)]](https://www.rsc.org/images/entities/char_2009.gif) MB MB |
1![[thin space (1/6-em)]](https://www.rsc.org/images/entities/char_2009.gif) : :![[thin space (1/6-em)]](https://www.rsc.org/images/entities/char_2009.gif) 0.70 0.70 |
1![[thin space (1/6-em)]](https://www.rsc.org/images/entities/char_2009.gif) : :![[thin space (1/6-em)]](https://www.rsc.org/images/entities/char_2009.gif) 1.01 1.01 |
N![[thin space (1/6-em)]](https://www.rsc.org/images/entities/char_2009.gif) : :![[thin space (1/6-em)]](https://www.rsc.org/images/entities/char_2009.gif) MB MB |
1![[thin space (1/6-em)]](https://www.rsc.org/images/entities/char_2009.gif) : :![[thin space (1/6-em)]](https://www.rsc.org/images/entities/char_2009.gif) 0.92 0.92 |
1![[thin space (1/6-em)]](https://www.rsc.org/images/entities/char_2009.gif) : :![[thin space (1/6-em)]](https://www.rsc.org/images/entities/char_2009.gif) 1.33 1.33 |
In summary, the benzoyl fragment B of Bz shows the highest initiation efficiency compared to the radical fragment MB from 4MB and the two fragments T and N from MMMP. The initiation efficiencies normalized to the extinction coefficients exhibit the same trend. However, for the comparisons of T![[thin space (1/6-em)]](https://www.rsc.org/images/entities/char_2009.gif) :
:![[thin space (1/6-em)]](https://www.rsc.org/images/entities/char_2009.gif) MB as well as N
MB as well as N![[thin space (1/6-em)]](https://www.rsc.org/images/entities/char_2009.gif) :
:![[thin space (1/6-em)]](https://www.rsc.org/images/entities/char_2009.gif) MB, the ratio of the initiation efficiencies changes after normalization to the extinction coefficients. When comparing the same number of excited molecules, the fragments T and N show an equal or lower initiation efficiency compared to the MB fragment, respectively, due to the lower extinction coefficient of 4MB compared to MMMP. Taking into account our earlier study,7 the ability of radical formation of the excited molecules has been identified as a crucial step for efficient photoinduced initiation for the same radical structures originating from different initiator molecules (e.g., a 2,4,6-trimethyl benzoyl fragment generated on the one hand from mesitil and on the other hand from 2,4,6-trimethyl benzoin). On the other hand, the obtained results in the present investigation of Bz, 4MB, and MMMP reveal a by far more complex picture of the decisive factors defining good initiation capabilities if radicals with different molecular structures are present. As the investigation of the photophysical properties has shown (for details see Quantum chemical calculations) all studied initiator molecules are subject to an ISC originating from the first excited singlet state S1 after photoexcitation at 351 nm. As a consequence of underlying competitive relaxation processes, e.g., IC, a quantitative evaluation of ISC efficiencies is not possible in the case of MMMP. Furthermore, the analysis of the transient data combined with quantum chemical calculations displays a higher complexity of the relaxation pathways for MMMP due to partial excitation into higher singlet states.
MB, the ratio of the initiation efficiencies changes after normalization to the extinction coefficients. When comparing the same number of excited molecules, the fragments T and N show an equal or lower initiation efficiency compared to the MB fragment, respectively, due to the lower extinction coefficient of 4MB compared to MMMP. Taking into account our earlier study,7 the ability of radical formation of the excited molecules has been identified as a crucial step for efficient photoinduced initiation for the same radical structures originating from different initiator molecules (e.g., a 2,4,6-trimethyl benzoyl fragment generated on the one hand from mesitil and on the other hand from 2,4,6-trimethyl benzoin). On the other hand, the obtained results in the present investigation of Bz, 4MB, and MMMP reveal a by far more complex picture of the decisive factors defining good initiation capabilities if radicals with different molecular structures are present. As the investigation of the photophysical properties has shown (for details see Quantum chemical calculations) all studied initiator molecules are subject to an ISC originating from the first excited singlet state S1 after photoexcitation at 351 nm. As a consequence of underlying competitive relaxation processes, e.g., IC, a quantitative evaluation of ISC efficiencies is not possible in the case of MMMP. Furthermore, the analysis of the transient data combined with quantum chemical calculations displays a higher complexity of the relaxation pathways for MMMP due to partial excitation into higher singlet states.
Moreover, as discussed in previous studies,34–37 the character of the T1 state as well as different conformations – caused by internal rotation during ISC – and the potential energy surface of T1 may influence the efficiency of α-cleavage. Thereby, T1 states revealing a 3(nπ*) character are known to be more efficient concerning radical formation than 3(ππ*) states.34 Since orbital analyses of the T1 states of the three investigated initiator molecules differ insignificantly from each other (all photoinitiators show at least partly the 3(nπ*) character), the observed differences in radical generation seem to have other origins. Regarding internal rotation effects35–37 (rotation around the C(O)–C(OH) and C(O)–C(Me)2 bond, respectively) the transient data do not allow for an analysis with respect to different conformers. However, except for MMMP, one can assume similar behavior, since the molecular structures of Bz and 4MB only vary in their substituents on the benzoyl ring in para position.
By comparing the estimated ability of radical formation derived from the time-resolved experiments, we found a higher tendency for radical formation for 4MB and MMMP compared to Bz. Therefore, the observed differences in initiation efficiencies seem to be caused less by the varieties of photophysical properties rather than by the reactivity of the generated radical itself. In the case of the B, MB, and T fragments, the radicals only differ in their substituents on the benzoyl ring. With respect to the normalized initiation efficiencies (Table 4, right hand column), the incorporation probability of the radical fragments decreases for the substituted radicals MB and T, and thus, with an increase of steric effects. The importance of such effects regarding initiation efficiencies has already been demonstrated in experiments with different methyl substituted Bz derivatives by Voll et al.5 with other fragments. Due to its different molecular structure, the N fragment of MMMP is less easily comparable, however, considering the six-membered ring and the two branched methyl groups it is very likely that steric effects play an important role, too. The findings of the current study indicate that the ‘ideal’ initiator should preferably possess a benzoin-like molecular structure and as few substituents as possible at the aromatic rings in order to diminish the steric hindrance. At the same time substitution should enhance intersystem crossing (ISC) processes as well as the subsequent radical cleavage.
The present study has unambiguously shown that (i) an inspection of ε at the pump wavelength is by no means a guide for predicting initiation efficiencies of the generated radical fragments, (ii) the determination of the ISC efficiency is much better suited for judging the initiation efficiencies, (iii) however, ultimately, the reactivity of the radical fragments towards the vinylic double bonds cannot be neglected. Thus, the combination of PLP-ESI-MS and TA experiments is a powerful tool for quantitative evaluation of the initiation ability of identical radical fragments originating from disparate source molecules. When different fragments originating from disparate source molecules are to be quantified in terms of their initiation ability, additional information regarding the addition rate coefficient of the individual fragments onto the vinylic double bond is required.
Acknowledgements
C. B.-K. and A. N. U. acknowledge support for the current project from the German Research Council (DFG). C. B.-K. acknowledges long term support via the Helmholtz STN program of the KIT.References
- H. F. Gruber, Prog. Polym. Sci., 1992, 17, 953–1044 CrossRef CAS.
- H. J. Hageman, Prog. Org. Coat., 1985, 13, 123–150 CrossRef CAS.
- M. Buback and A. Kuelpmann, Macromol. Chem. Phys., 2003, 204, 632–637 CrossRef CAS.
- F. Günzler, E. H. H. Wong, S. P. S. Koo, T. Junkers and C. Barner-Kowollik, Macromolecules, 2009, 42, 1488–1493 CrossRef.
- D. Voll, A. Hufendiek, T. Junkers and C. Barner-Kowollik, Macromol. Rapid Commun., 2012, 33, 47–53 CrossRef CAS PubMed.
- D. Voll, T. Junkers and C. Barner-Kowollik, Macromolecules, 2011, 44, 2542–2551 CrossRef CAS.
- T. J. A. Wolf, D. Voll, C. Barner-Kowollik and A.-N. Unterreiner, Macromolecules, 2012, 45, 2257–2266 CrossRef CAS.
- C. Barner-Kowollik, F. Günzler and T. Junkers, Macromolecules, 2008, 41, 8971–8973 CrossRef CAS.
- U. Megerle, I. Pugliesi, C. Schriever, C. F. Sailer and E. Riedle, Appl. Phys. B: Lasers Opt., 2009, 96, 215–231 CrossRef CAS.
- K. Tamura, C. R. Doerr, L. E. Nelson, H. A. Haus and E. P. Ippen, Opt. Lett., 1994, 19, 46–48 CrossRef CAS PubMed.
- R. Ahlrichs, M. Baer, M. Haeser, H. Horn and C. Koelmel, Chem. Phys. Lett., 1989, 162, 165–169 CrossRef CAS.
- A. D. Becke, Phys. Rev. A: Gen. Phys., 1988, 38, 3098–3100 CrossRef CAS.
- P. A. M. Dirac, Proc. R. Soc. London, Ser. A, 1929, 123, 714–733 CrossRef CAS.
- K. Eichkorn, O. Treutler, H. Oehm, M. Haeser and R. Ahlrichs, Chem. Phys. Lett., 1995, 240, 283–290 CrossRef CAS.
- K. Eichkorn, O. Treutler, H. Oehm, M. Haeser and R. Ahlrichs, Chem. Phys. Lett., 1995, 242, 652–660 CrossRef CAS.
- K. Eichkorn, F. Weigend, O. Treutler and R. Ahlrichs, Theor. Chem. Acc., 1997, 97, 119–124 CrossRef CAS.
- A. Schaefer, H. Horn and R. Ahlrichs, J. Chem. Phys., 1992, 97, 2571–2577 CrossRef CAS.
- J. C. Slater, Phys. Rev., 1951, 81, 385–390 CrossRef CAS.
- O. Treutler and R. Ahlrichs, J. Chem. Phys., 1995, 102, 346–354 CrossRef CAS.
- S. H. Vosko, L. Wilk and M. Nusair, Can. J. Phys., 1980, 58, 1200–1211 CrossRef CAS.
- F. Weigend, Phys. Chem. Chem. Phys., 2006, 8, 1057–1065 RSC.
- R. Bauernschmitt and R. Ahlrichs, J. Chem. Phys., 1996, 104, 9047–9052 CrossRef CAS.
- R. Bauernschmitt and R. Ahlrichs, Chem. Phys. Lett., 1996, 256, 454–464 CrossRef CAS.
- S. Grimme, F. Furche and R. Ahlrichs, Chem. Phys. Lett., 2002, 361, 321–328 CrossRef CAS.
- A. D. Becke, J. Chem. Phys., 1993, 98, 5648–5652 CrossRef CAS.
- C. Lee, W. Yang and R. G. Parr, Phys. Rev. B: Condens. Matter, 1988, 37, 785–789 CrossRef CAS.
- R. A. Kendall, T. H. Dunning, Jr and R. J. Harrison, J. Chem. Phys., 1992, 96, 6796–6806 CrossRef CAS.
- D. R. Lide, CRC Handbook of Chemistry and Physics, Internet Version 2005, CRC Press, Boca Raton, FL, 2005 Search PubMed.
- W. G. Barb, J. Polym. Sci., 1953, 11, 117–126 CrossRef CAS.
- M. Lipson and N. J. Turro, J. Photochem. Photobiol., A, 1996, 99, 93–96 CrossRef CAS.
- M. A. El-Sayed, J. Chem. Phys., 1963, 38, 2834–2838 CrossRef CAS.
- C. Ma, Y. Du, W. M. Kwok and D. L. Phillips, Chem.–Eur. J., 2007, 13, 2290–2305 CrossRef CAS PubMed.
- F. Morlet-Savary, X. Allonas, C. Dietlin, J. P. Malval and J. P. Fouassier, J. Photochem. Photobiol., A, 2008, 197, 342–350 CrossRef CAS.
- S. Jockusch, M. S. Landis, B. Freiermuth and N. J. Turro, Macromolecules, 2001, 34, 1619–1626 CrossRef CAS.
- K.-T. Lu, F. Weinhold and J. C. Weisshaar, J. Chem. Phys., 1995, 102, 6787–6805 CrossRef CAS.
- A. H. Zewail, J. Phys. Chem. A, 2000, 104, 5660–5694 CrossRef CAS.
- M. Spichty, N. J. Turro, G. Rist, J. L. Birbaum, K. Dietliker, J. P. Wolf and G. Gescheidt, J. Photochem. Photobiol., A, 2001, 142, 209–213 CrossRef CAS.
Footnotes |
| † Electronic supplementary information (ESI) available: Results of quantum chemical calculations, evaluation of transient data, amplitude calculations, normalized TA traces, and singlet absorption bands. See DOI: 10.1039/c4py00418c |
| ‡ These authors contributed equally to this publication. |
| This journal is © The Royal Society of Chemistry 2014 |

