 Open Access Article
Creative Commons Attribution 3.0 Unported Licence
Monitoring of viscosity changes during free radical polymerization using fluorescence lifetime measurements†
Jan Martin
Nölle
a,
Christian
Jüngst
a,
Andreas
Zumbusch
a and
Dominik
Wöll
*ab
aDepartment of Chemistry, University of Konstanz, Universitätsstr. 10, 78464 Konstanz, Germany. E-mail: dominik.woell@uni-konstanz.de; Tel: +49 7531 88 2024
bZukunftskolleg, University of Konstanz, Universitätsstr. 10, 78464 Konstanz, Germany
First published on 27th January 2014
Abstract
A molecular rotor with a fluorescence lifetime depending on the local viscosity of its surroundings has been successfully used as a probe to monitor local viscosity changes during the bulk radical polymerization of methyl methacrylate.
The diffusion of monomer, polymer and initiator molecules plays a pivotal role in the kinetics of polymerization and therefore also in the properties of the produced polymers. In particular, chain termination, chain propagation and radical formation depend on local viscosity and these processes reach the diffusion limit at a certain conversion.1 Changes in viscosity are especially pronounced during bulk polymerization reactions. As a consequence, interesting kinetics such as the Trommsdorff effect appear.
Bulk viscosity2 can be measured with several methods such as viscometry, rheometry or dilatometry.3 However, these methods probe only the macroscopic viscosity and lack an insight into the molecular level. Fluorescence spectroscopy and microscopy methods allow for measurements of different observables which, depending on the chosen sensing dye,4 can be related to the local environment,5 in particular local viscosity. Translational and rotational diffusion are of special interest among the aforementioned observables. They can be determined by fluorescence correlation spectroscopy (FCS),6,7 wide-field fluorescence microscopy,6,8 fluorescence recovery after photobleaching (FRAP)9 and fluorescence anisotropy measurements.10 Furthermore, the changes in local viscosity during polymerization can also be followed using excimer formation,11 collisional fluorescence quenching,12 or changes in quantum yield of molecular rotors.13
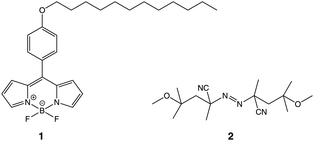
Due to the change of photophysical parameters, molecular rotors have proven to be an ideal probe for the local viscosity. In particular, the BODIPY-C12 dye (1, see Scheme 1) has attracted considerable interest in chemical, physical and biological applications. Two strategies for determining the viscosity via the fluorescence properties of molecular rotors have been presented in the literature: a ratiometric14 and a lifetime approach.15 Both offer the advantage that the measurement is independent of the dye concentration.
The lifetime approach has been used to follow a sol-to-gel process during the hydrogelation of gelrite and the formation of an inorganic polymer from tetraethyl orthosilicate.16 For biological applications it generated interest especially in the field of intracellular viscosity imaging.15,17–20
In our present work, we demonstrate that fluorescence lifetime measurements of probe 1 can elucidate local viscosity changes during the radical bulk polymerization of methyl methacrylate initiated by the azobisisobutyronitrile- (AIBN-) derivative 2 (see Scheme 1). The appearance of different lifetime components points to heterogeneities evolving during the polymerization process.
The fluorescence lifetime of BODIPY-C12 1 was monitored during the radical bulk polymerization of MMA. Examples for fluorescence decay curves at five different conversions on a logarithmic scale are presented in Fig. 1. It is evident that increasing conversion leads to an increase of the fluorescence lifetimes. All curves were fitted with a biexponential function (n = 2) to appropriately fit the measured time-correlated single photon counting (TCSPC) curves:
 | (1) |
 | (2) |
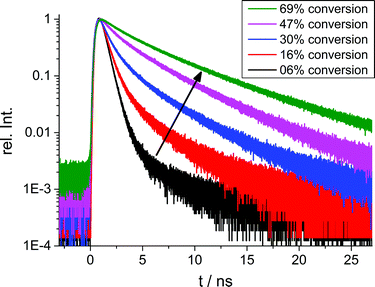 | ||
| Fig. 1 Representative fluorescence decay curves measured by TCSPC at 6%, 16%, 30%, 47% and 69% conversion during the bulk polymerization of MMA using 0.5% of radical starter 2. | ||
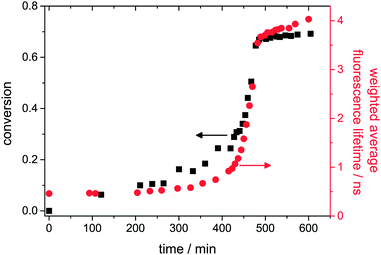
As shown in Fig. 2, the weighted average fluorescence lifetime evolves similar to the monomer-to-polymer conversion as determined by Raman measurements using the method described by Chu et al.21 (see the ESI†). Three different periods can be distinguished: the low conversion period, the gel effect period and the glass effect period.22 At a conversion below ca. 20%, the fluorescence lifetime of our probe just changes slightly indicating only a minor increase in viscosity of the polymerizing solution. In the period between ca. 20% and 70% conversion, a significant auto-acceleration is caused by the Trommsdorff effect which is pronounced during the bulk polymerization of MMA. In this regime, the lifetime increases rapidly from 1 ns to 3.8 ns. We verified in previous work that this effect is not due to a temperature-rise in our polymerization system.6 With the onset of the glass effect period at conversions higher than 70%, the rise in conversion and fluorescence lifetime flattens down and becomes constant at a later stage after long curing time.
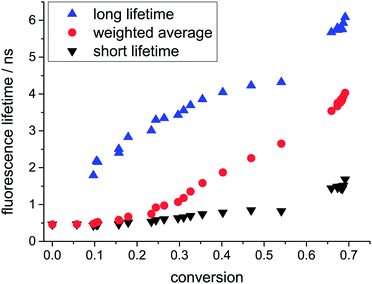
Analysis of the different lifetime components according to eqn (1) showed that the change of the weighted average fluorescence lifetime in the auto-acceleration regime is not mainly caused by an increase of the two lifetimes themselves but rather by a significant change in their amplitudes. In fact, the long lifetime increases from 1.80 to 4.32, whereas the short lifetime only increases from 0.43 to 0.85 within a conversion of 60% (see Fig. 3). At very low conversion, only the short lifetime can be observed. However, already at 10% conversion a second component appears which gains increasingly more weight especially during the auto-acceleration period through mere inspection of the amplitude fractions in Fig. 4. At a conversion of 60%, the two components show approximately the same amplitude. This does not change in the final period, i.e. the glass effect period, even after several days. However, in this regime the fluorescence lifetimes of both components still increase presumably due to curing effects (see Fig. 3). Typical fluorescence lifetime curves and their fits for different conversions are presented in the ESI.†
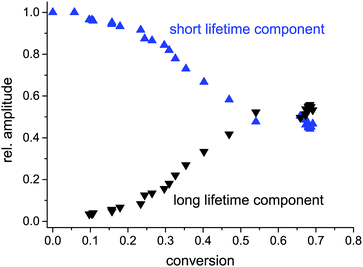 | ||
| Fig. 4 Fraction of the two fluorescence lifetime components presented in Fig. 3. | ||
The appearance of two different lifetimes points to two distinguishable fractions of probe molecules experiencing different local environments. One fraction exhibits a fluorescence lifetime shorter than 1 ns up to a conversion of 60% and is not strongly influenced by the polymerization process. We assume that this fraction of molecules is in regions of low polymer density. Thus, the rotation of bonds is comparable to the situation in a low-viscous solution. The fraction of probes with longer fluorescence lifetimes shows more significant changes with increasing conversion. It represents probes in regions where the polymer density has already evolved to a level where it significantly hinders the rotation of the molecular rotors. These higher density regions grow during the polymerization process and therefore the fraction of molecules with a long fluorescence lifetime is also enhanced. From these findings, we deduce that the polymerization of MMA creates a mixture with significant heterogeneity on the nano- to micrometre length scale, which is in agreement with previous results in our lab using single molecule tracking.6 Surprisingly, even after several days, two different lifetimes with approximately the same amplitudes remained, indicating that even after the polymerization process has basically reached its end, the produced PMMA shows heterogeneity on the molecular level. The rotation of one half of the molecular rotors is still possible with a rate corresponding to a (nano)viscosity of ca. 0.200 Pa s (= 200 cP), as determined using the calibration curve from Levitt et al.,19 whereas for the other half of the probes, the viscosity exceeds 10 Pa s. At this point, an accurate determination of viscosity using fluorescence lifetime measurements is not possible anymore because the lifetime is solely determined by the radiative fluorescence rate and non-radiative processes become negligible (see also ESI,† Section 3). For our system, the fluorescence lifetime reached a constant value of ca. 6 ns which was also observed in the finally produced polymer glass which possesses a macroscopic viscosity of at least 1012 Pa s, according to the definition of the glass transition.23 However, molecular rotors do not probe the macroscopic viscosity which is determined by motion of the polymer chains on larger length scales, but rather the dynamics in the direct neighbourhood to the molecular rotor. In analogy to the segmental motion of polymer chains,24 the mobility of a molecular rotor depends on the fraction of free volume. Free volume is still present and can even be redistributed at temperatures below the glass transition temperature, as e.g. demonstrated by Vallée et al. using fluorescence lifetime fluctuations of fluorescent dyes due to changes of the polarisability of the surrounding matrix.5,25,26
In conclusion, we have shown that the polymerization of methyl methacrylate can be monitored using fluorescence lifetime measurements of embedded molecular rotors. They probe the local viscosity of their direct surrounding and allow for the elucidation of structural heterogeneities evolving during the polymerization process. Three different stages with different evolution of their fluorescence lifetimes can be distinguished, i.e. the initial period at conversions below 20%, the gel effect region between 20% and 70% and the glass effect regime at higher conversion. Therefore, fluorescence lifetime measurements with molecular rotors are a very useful tool for in situ measurements of viscosity changes during polymerization processes.
Acknowledgements
C. J. thanks the Konstanz Research School Chemical Biology and D. W. thanks the Center for Applied Photonics (CAP) and the Zukunftskolleg of the University of Konstanz for financial and administrative support.Notes and references
- C. Barner-Kowollik and G. T. Russell, Prog. Polym. Sci., 2009, 34, 1211–1259 CrossRef CAS PubMed.
- C. W. Macosko, Rheology: Principles, Measurements, and Applications, Wiley-VCH, 1994 Search PubMed.
- O. Okay, D. Kaya and O. Pekcan, Polymer, 1999, 40, 6179–6187 CrossRef CAS.
- P. Bosch, F. Catalina, T. Corrales and C. Peinado, Chem. – Eur. J., 2005, 11, 4314–4325 CrossRef CAS PubMed.
- R. A. L. Vallée, M. Baruah, J. Hofkens, F. C. De Schryver, N. Boens, M. Van der Auweraer and D. Beljonne, J. Chem. Phys., 2007, 126, 184902 CrossRef PubMed.
- B. Stempfle, M. Dill, M. J. Winterhalder, K. Müllen and D. Wöll, Polym. Chem., 2012, 3, 2456–2463 RSC.
- M. Dorfschmid, K. Müllen, A. Zumbusch and D. Wöll, Macromolecules, 2010, 43, 6174–6179 CrossRef CAS.
- B. M. I. Flier, M. Baier, J. Huber, K. Müllen, S. Mecking, A. Zumbusch and D. Wöll, Phys. Chem. Chem. Phys., 2011, 13, 1770–1775 RSC.
- M. T. Cicerone, F. R. Blackburn and M. D. Ediger, Macromolecules, 1995, 28, 8224–8232 CrossRef CAS.
- M. Levitus, J. L. Bourdelande, G. Marques and P. F. Aramendia, J. Photochem. Photobiol., A, 1999, 126, 77–82 CrossRef CAS.
- O. Valdés-Aguilera, C. P. Pathak and D. C. Neckers, Macromolecules, 1990, 23, 689–692 CrossRef.
- S. E. Webber, Macromol. Symp., 1999, 143, 359–370 CrossRef CAS.
- K. E. Miller, R. H. Krueger and J. M. Torkelson, J. Polym. Sci., Part B: Polym. Phys., 1995, 33, 2343–2349 CrossRef CAS.
- M. A. Haidekker, T. P. Brady, D. Lichlyter and E. A. Theodorakis, J. Am. Chem. Soc., 2006, 128, 398–399 CrossRef PubMed.
- M. K. Kuimova, Phys. Chem. Chem. Phys., 2012, 14, 12671–12686 RSC.
- G. Hungerford, A. Allison, D. McLoskey, M. K. Kuimova, G. Yahioglu and K. Suhling, J. Phys. Chem. B, 2009, 113, 12067–12074 CrossRef CAS PubMed.
- M. K. Kuimova, Chimia, 2012, 66, 159–165 CrossRef CAS PubMed.
- M. K. Kuimova, G. Yahioglu, J. A. Levitt and K. Suhling, J. Am. Chem. Soc., 2008, 130, 6672–6673 CrossRef CAS PubMed.
- J. A. Levitt, M. K. Kuimova, G. Yahioglu, P. H. Chung, K. Suhling and D. Phillips, J. Phys. Chem. C, 2009, 113, 11634–11642 CAS.
- C. Jüngst, M. Klein and A. Zumbusch, J. Lipid Res., 2013, 54, 3419–3429 CrossRef PubMed.
- B. Chu, G. Fytas and G. Zalczer, Macromolecules, 1981, 14, 395–397 CrossRef CAS.
- J. Qin, W. Guo and Z. Zhang, Polymer, 2002, 43, 1163–1170 CrossRef CAS.
- C. A. Angell, Science, 1995, 267, 1924–1935 CAS.
- E. Donth, The Glass Transition – Relaxation Dynamics in Liquids and Disordered Materials, Springer, 2001 Search PubMed.
- R. A. L. Vallée, N. Tomczak, L. Kuipers, G. J. Vancso and N. F. van Hulst, Phys. Rev. Lett., 2003, 91, 038301 CrossRef.
- E. Braeken, G. De Cremer, P. Marsal, G. Pepe, K. Müllen and R. A. L. Vallée, J. Am. Chem. Soc., 2009, 131, 12201–12210 CrossRef CAS PubMed.
Footnote |
| † Electronic supplementary information (ESI) available. See DOI: 10.1039/c3py01684f |
| This journal is © The Royal Society of Chemistry 2014 |

